KT Half Trend MT4
- Indicateurs
-
KEENBASE SOFTWARE SOLUTIONS
 Keenbase Trading développe des indicateurs professionnels et des Expert Advisors pour MetaTrader 4 et MetaTrader 5 afin d'aider les traders à prendre des décisions de trading plus éclairées.
 - Version: 1.0
- Activations: 5
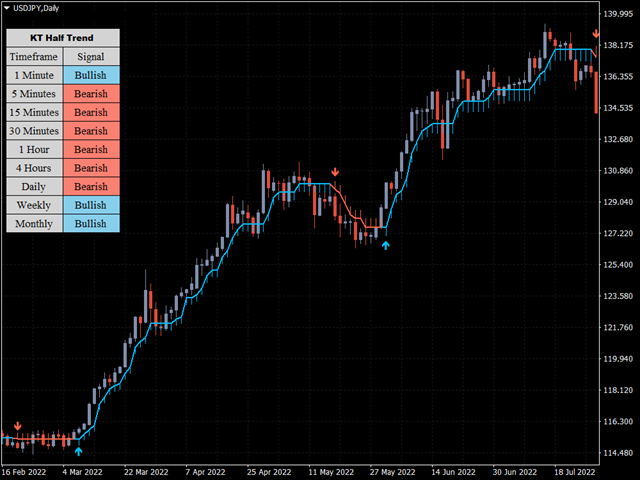
Le KT HalfTrend est un indicateur de tendance basé sur une moyenne mobile qui trace des zones sur le graphique. Il indique un changement de tendance en affichant des zones d’invalidation haussières et baissières.
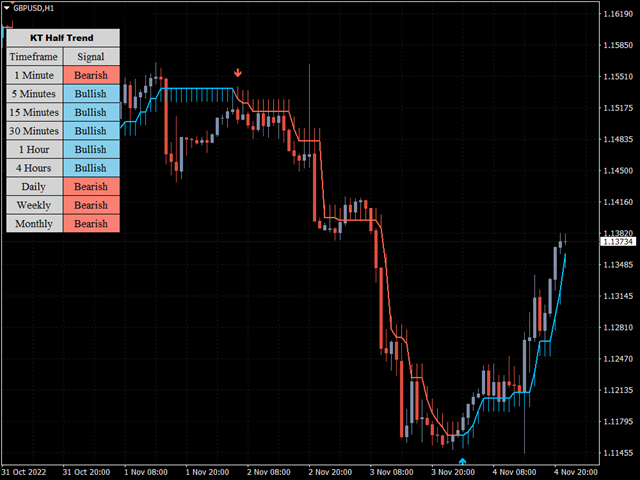
Il affiche également la force d’achat et de vente avec des flèches sur le graphique principal. Lorsque la tendance est absente, l’indicateur devient plat, ce qui reflète une phase d’accumulation, de distribution ou de consolidation temporaire. En présence d’une tendance, une pente apparaît dans la direction correspondante.
Plus la pente est raide, plus le signal de tendance est fort, qu’il soit haussier ou baissier. Une forte tendance haussière est représentée en bleu, tandis qu’une forte tendance baissière est représentée en rouge.
Fonctionnalités
- Indicateur très intuitif et facile à utiliser.
- Fonctionne sur tous les actifs et toutes les unités de temps.
- Affiche des signaux pour entrées rapides ou filtrées.
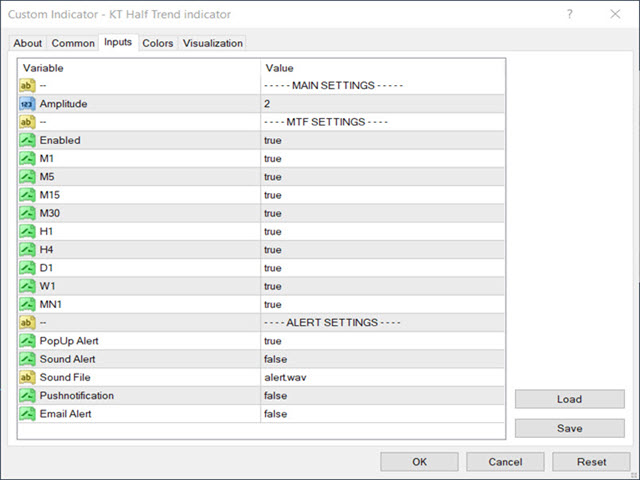
- Paramètres personnalisables : moyenne mobile, Parabolic SAR et couleurs.
Applications
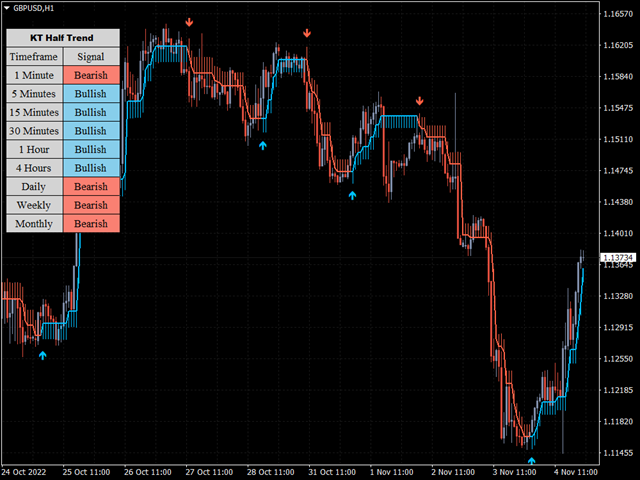
En général, les conditions d’achat sont réunies lorsque le prix passe au-dessus de la pente de l’indicateur et que le HalfTrend devient bleu.
Une flèche bleue apparaît sous la bougie, indiquant un mouvement haussier. Le stop-loss doit être placé sous l’indicateur.
Si une flèche rouge descendante apparaît, cela suggère de clôturer la position acheteuse ou de fixer un take-profit.
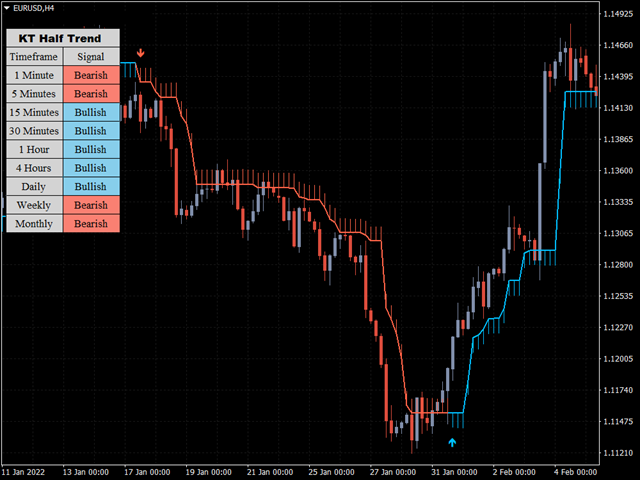
Les conditions de vente apparaissent lorsque le prix passe sous la pente de l’indicateur et que le HalfTrend devient rouge.
Une flèche rouge descendante s’affiche au-dessus de la bougie, et un stop-loss doit être placé au-dessus de l’indicateur.
Si une flèche bleue haussière réapparaît, vous pouvez clôturer votre vente ou f