HoughTransform
- Indicadores
-
Stanislav Korotky
 Trading is just my hobby. I'm working in IT industry. So developement of experts, indicators, and script is not a problem at all to me. Wide range of technologies are used: MQL4, MQL5, system and applied programming, web-services, neural networks and more.
New: - Versión: 1.3
- Actualizado: 23 noviembre 2021
- Activaciones: 5
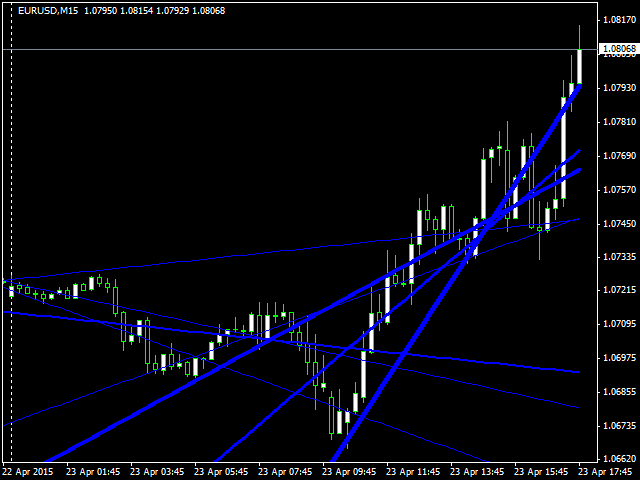
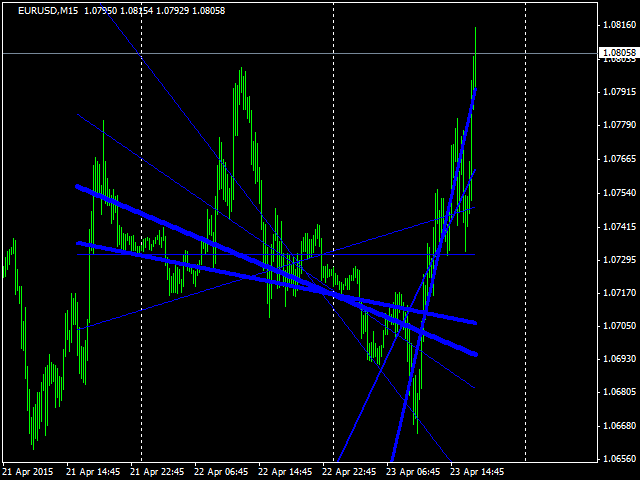
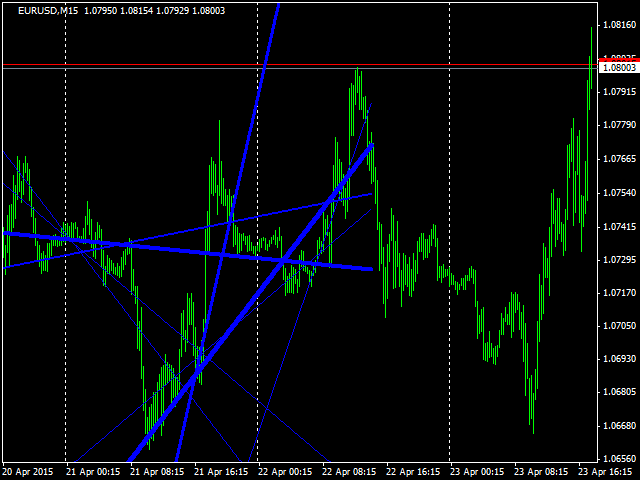
Este indicador construye automáticamente un conjunto alternativo de líneas de resistencia y soporte basado en áreas donde se concentran los precios (en lugar de puntos extremos). El algoritmo utiliza la transformada lineal de Hough(Wikipedia).
Las nuevas líneas se utilizan para operar de forma similar al enfoque clásico, es decir, indican los puntos de posible reversión o ruptura en las acciones futuras de los precios. Sin embargo, su principal ventaja es que cubren las regiones de precios más pobladas y consistentes, descubriendo una especie de "centro de masa" y "atractores", que parecen ser características más estables y fundamentales que los extremos dispersos.
El indicador muestra hasta 8 líneas rectas más prominentes (en el sentido que implica la fórmula de transformación). Cuanto más gruesa es la línea, mejor es su representación en el espacio de coordenadas polares, lo que significa que encuentra una confirmación más fuerte en el gráfico de precios.
El indicador se calcula barra por barra, los ticks no se procesan.
Parámetros
- PictureSize - número de barras utilizadas para el análisis; la misma cantidad de celdas se reserva para la cuantificación del precio en el rango entre el precio máximo y mínimo en el número de barras dado; el valor por defecto es 100;
- Offset - un desplazamiento en barras para el análisis en el historial; el valor por defecto es 1, lo que significa análisis en línea; como el indicador se calcula en la apertura de la barra, no tiene sentido establecer Offset igual a 0, porque la nueva barra suele tener precios iguales de Apertura, Cierre, Máximo y Mínimo y no afecta al análisis;
- HoughSize - el tamaño del espacio de coordenadas polares utilizado para el análisis; el valor por defecto es 20; cuanto mayor sea el valor, más preciso será el cálculo de las líneas, pero requerirá más recursos; los valores recomendados son de 10 a 50;
- Precio - uno de los dos modos de captura del precio en cada barra: Mínimo/Alto (por defecto) o Cierre/Cierre; el primero significa que la barra se detecta desde su Máximo hasta su Mínimo, el segundo - desde la Apertura (Cierre de la barra anterior) hasta el Cierre;
- Color - color de las líneas, azul por defecto;
Los sceenshots abajo demuestran el indicador con diversos valores de PictureSize y en la historia en Offset especificado.