SFT Reversal Arrows
- Indicadores
-
Artem Kuzmin
 ALL PRODUCTS ▶️ https://www.mql5.com/ru/users/zombiezorrofx/seller
🔥 Maximum commission discounts:
💠 Binance 35% (trading bypassing sanctions) - Versión: 2.0
- Activaciones: 5
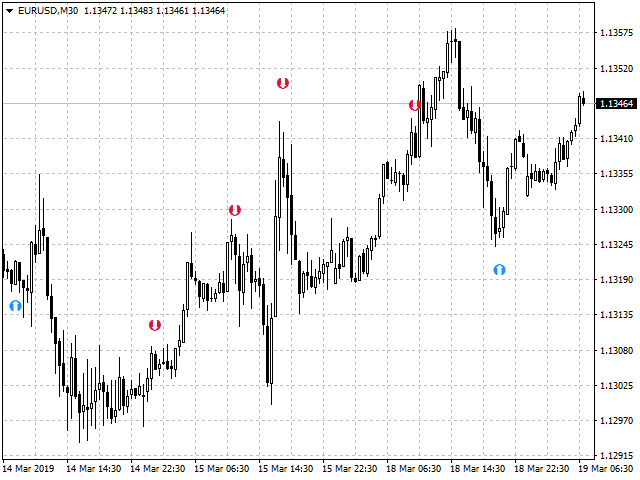
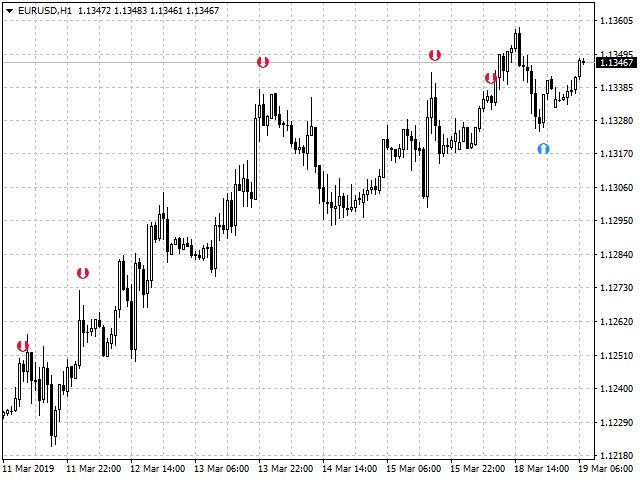
Indicador de flecha, para entrar a tiempo en los retrocesos de precios
La flecha aparece en la barra cerrada y no desaparece.
Permite entrar en la operación justo al principio del movimiento
Se puede utilizar en cualquier par de divisas, metales y criptodivisas
Adecuado para trabajar con opciones binarias
Características distintivas
- No redibuja;
- Determina la corrección del precio
- Configuración avanzada para el ajuste fino;
- Funciona en todos los plazos y en todos los símbolos;
- Adecuado para el comercio de divisas, metales, opciones y criptomonedas (Bitcoin, Litecoin, Ethereum, etc.)
- Adecuado para el comercio manual y para el desarrollo de asesores.
Para entradas más precisas y señales de confirmación adicionales se puede utilizar junto con otros indicadores.
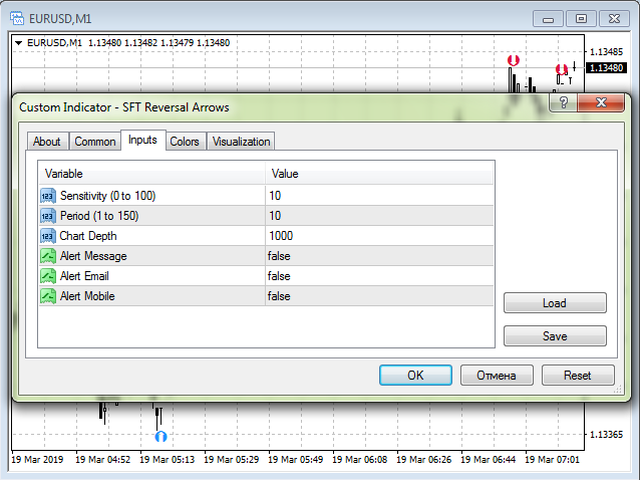
Ajustes del indicador
- Sensibilidad (0 a 100) - sensibilidad del indicador, valores válidos de 0 a 100;
- Periodo(1 a 150) - periodo del indicador, valores válidos de 1 a 150;
- Profundidad del Grá fico - profundidad del indicador en el gráfico;
- Mensaje de Alerta - muestra mensajes en la pantalla y confirmación sonora de la señal;
- Alert Email - envía señales al correo, instrucciones para configurar el terminalaquí;
- Alert Mobile - envía al teléfono, a través del terminal móvil instalado, instrucciones de configuraciónaquí;
Recomendaciones de negociación
- Cuando aparezca la flecha roja, abra Vender o Poner (para opciones)
- Cuando aparezca la flecha azul, abra Buy o Call (para opciones)
- La dirección de la operación debe corresponder a la dirección de la tendencia en un marco temporal superior.
- Salga de la operación en la señal inversa o en el SL y TP establecidos.
- Cuando se utiliza SL y TP, es aconsejable establecer el SL para el extremo más cercano, TP = 1..2 SL.
- Las señales funcionan bien cuando se combinan con el indicador gratuito SFT Trading Oscillator
Hay otras opciones, en el proceso de negociación se puede desarrollar la táctica más conveniente para usted.
Para obtener más información y una visión más detallada de los métodos de negociación, consulte aquí:
Estrategia de trading con el indicador SFT Reversal Arrows
Le deseamos un comercio estable y rentable.
Gracias por utilizar nuestro software.
Si le gusta, haga una buena acción y comparta el enlace con sus amigos.
Para no perderse el lanzamiento de nuevos programas útiles para el comercio - añadir como amigo:SURE FOREX TRADING