One to Three Trendline Breakout
- Indicadores
- Versión: 2.0
- Actualizado: 22 julio 2023
- Activaciones: 5

Versión 1.3 : Hemos actualizado el indicador para incluir una opción de escaneo histórico de barras. Así que en lugar de escanear todas las barras de la historia (que puede hacer que el indicador lento a veces), puede seleccionar el número máximo de barras que puede escanear que puede aumentar el rendimiento y hacer que el indicador más rápido.
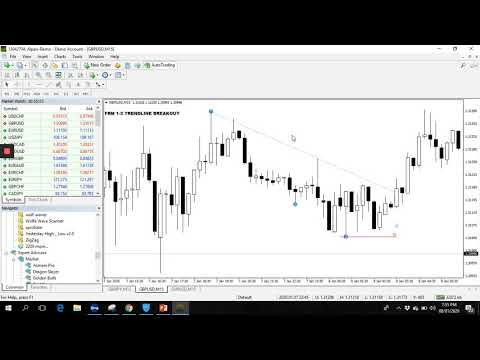
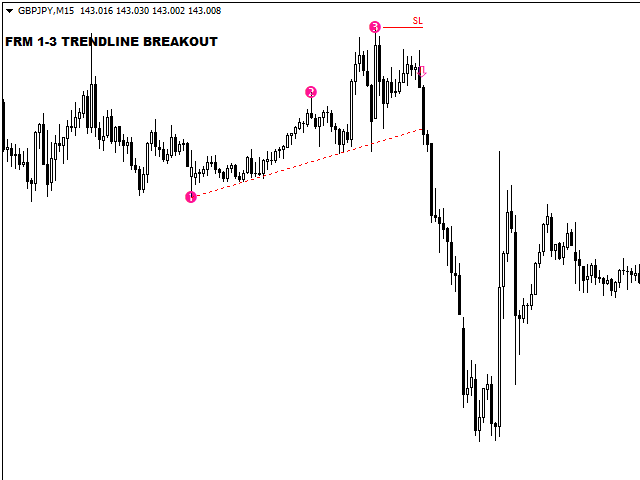
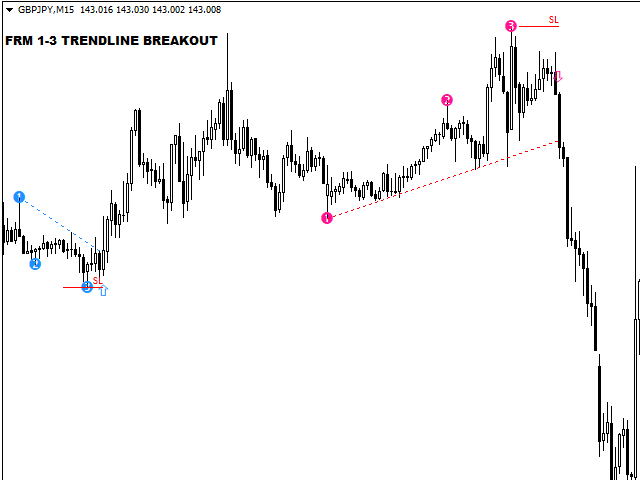
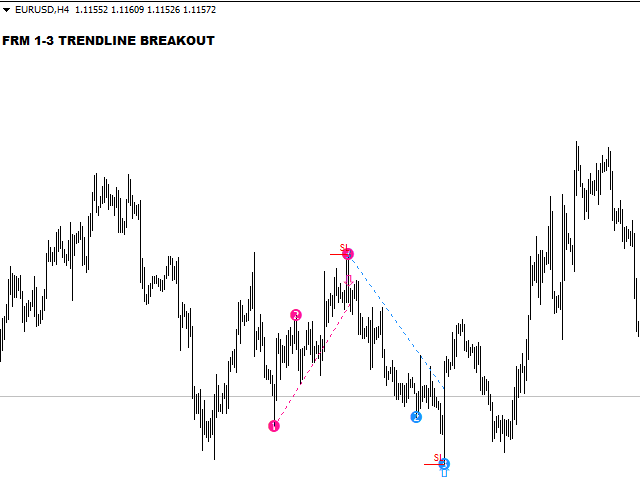
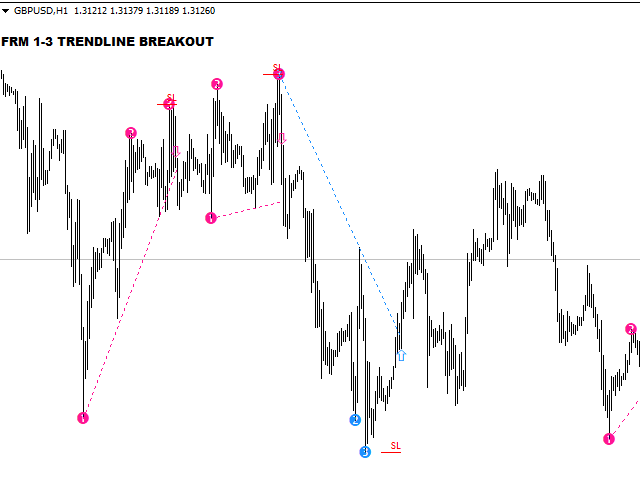
Este indicador escanea el patrón 1-3 Trendline. El indicador es un sistema de ruptura de bajo riesgo 100% sin repintado. Los patrones se forman alrededor de los máximos y mínimos oscilantes, lo que los convierte en un patrón de bajo riesgo con alta recompensa.
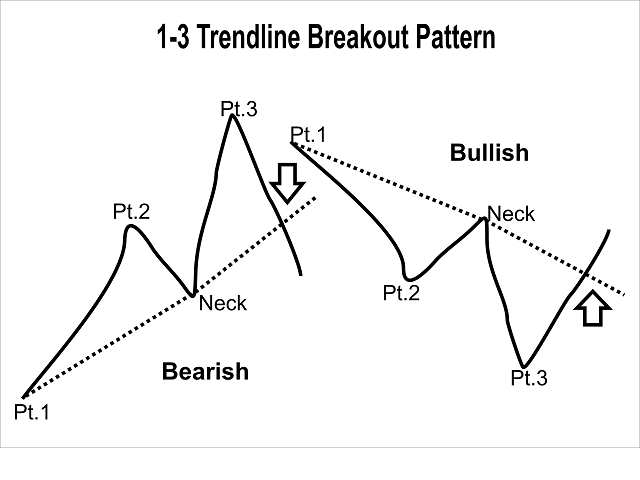
FONDO DEL PATRÓN
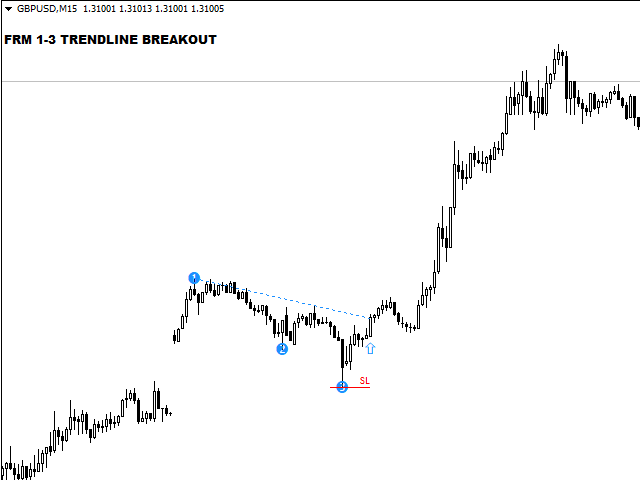
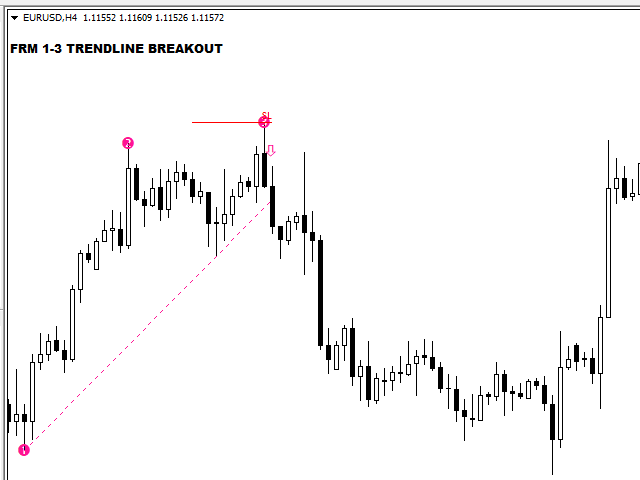
El patrón 1-3 Trendline Breakout está formado por cuatro (4) puntos que se componen de tres (3) puntos primarios y el cuello del patrón. Una línea de tendencia siempre está formada por el punto 1 y el cuello del patrón. Cuando el precio rompe la línea de tendencia formada, suele indicar un cambio en la oferta y la demanda y, por tanto, una posible nueva tendencia. El patrón de 1-3 líneas de tendencia se produce en todos los mercados y está formado por la oferta y la demanda. Esto significa que el patrón no se limita únicamente al mercado de divisas, sino que también puede utilizarse para operar con materias primas y acciones.
CÓMO USARLO
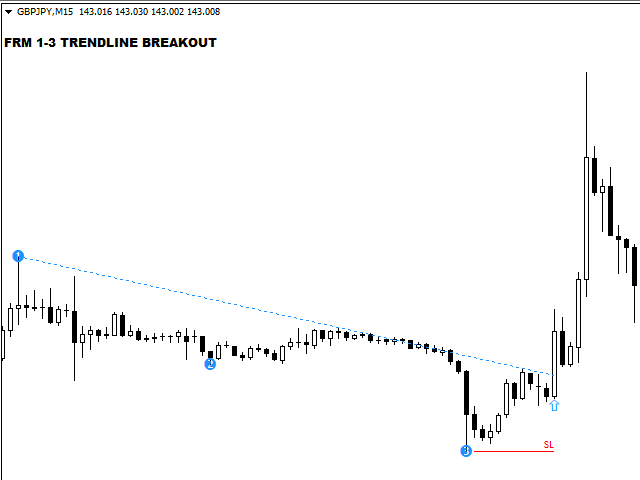
1. 1. Detecte el patrón cuando aparezca la señal
2. Cuando esto sucede en la mayoría de los casos se trata de un patrón falso, pero también hay algunos patrones exitosos formados de esta manera. Nuestro consejo es que si usted va a arriesgarse a tomar este tipo de patrón , asegúrese de que el stop loss / nivel de riesgo es muy pequeño.
3. Opere la señal
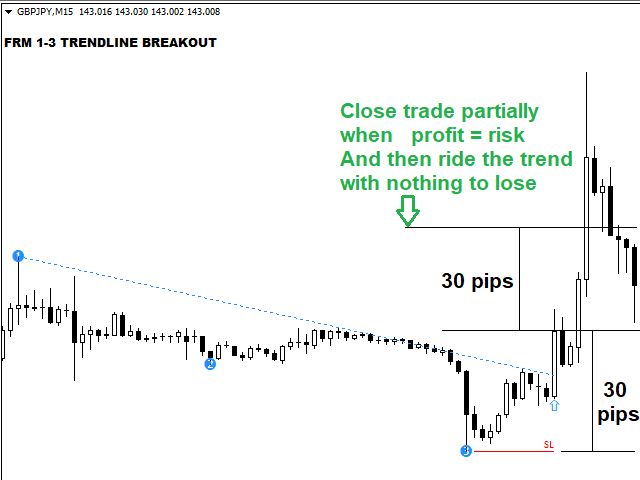
4. Cierre la ganancia parcial con una relación riesgo-recompensa de 1:1. Esto significa que cuando el precio alcance un beneficio igual al riesgo, cierre parte de la operación y obtenga el resto de los beneficios.
ENTRADAS
1. Periodo del patrón : El patrón se crea usando zigzag. El periodo del patrón es el periodo del zigzag.
2. Patrón alcista : Color del patrón alcista
3. Patrón Bajista : Color del patrón bajista
4. Alerta emergente : Verdadero/falso
5. Notificación por teléfono : Verdadero/falso
6. Notificación por correo electrónico : Verdadero/Falso
NOTA FINAL
Forex es un mercado impulsado por el sentimiento y los sentimientos pueden cambiar en cuestión de segundos por lo tanto ninguna estrategia de Forex es 100% rentable. Siempre opere con discreción, tome riesgos calculados y no apueste lo que no está dispuesto a perder. Mantente seguro y mantente verde en los pips.
AHORA PUEDE DESCARGAR VERSIONES GRATUITAS DE NUESTROS INDICADORES DE PAGO. ES NUESTRA FORMA DE DEVOLVER A LA COMUNIDAD.


Great product. Works well