SFT Go Trend
- Göstergeler
-
Artem Kuzmin
 ALL PRODUCTS ▶️ https://www.mql5.com/ru/users/zombiezorrofx/seller
🔥 Maximum commission discounts:
💠 Binance 35% (trading bypassing sanctions) - Sürüm: 1.0
- Etkinleştirmeler: 5
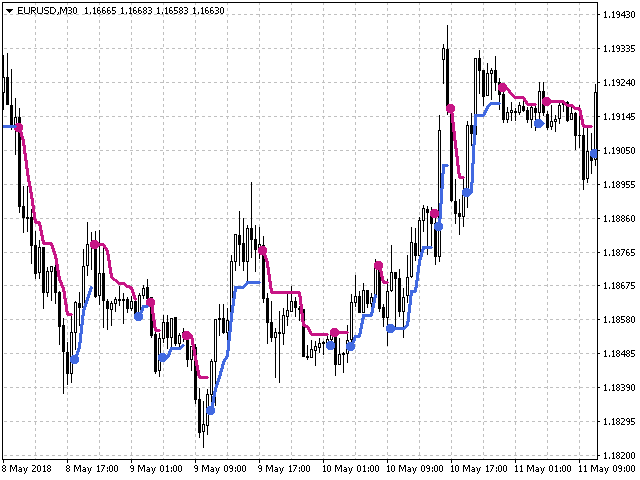
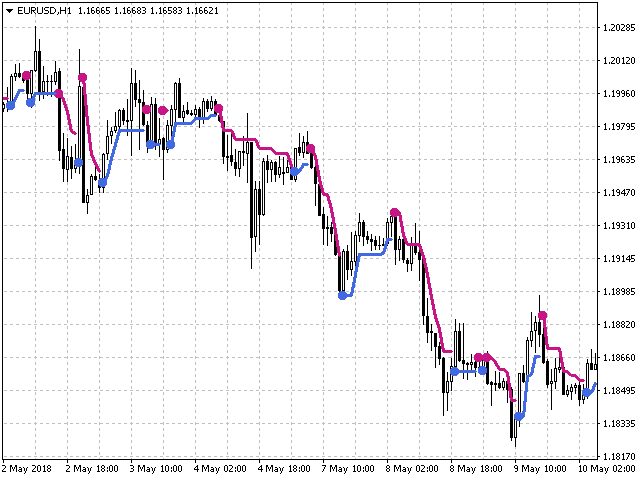
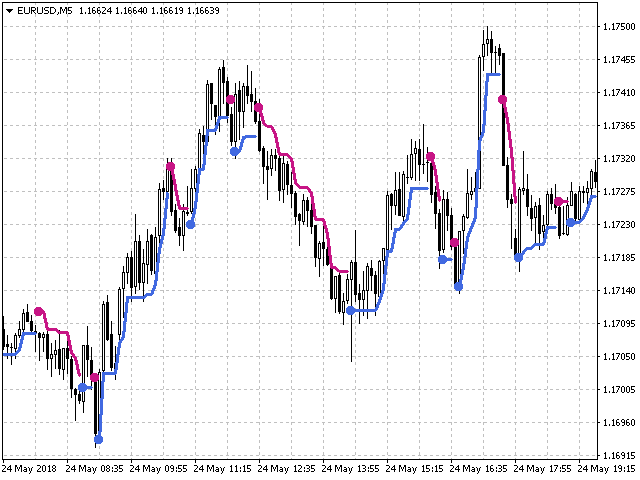
Opening positions in the direction of the trend is one of the most common trading tactics.
The main idea is that the probability of the trend continuation is higher than that of its change.
This indicator determines the direction of a local movement, marking the beginning of a trend with a large dot and its continuation with a line of the corresponding color.
Distinctive features
- No Repaint.
- Simple and accurate settings.
- Clear and understandable signals.
- Works on all timeframes and symbols.
- Suitable for manual trading and development of Expert Advisors.
For more accurate entries and additional confirmation of signals, it can be used in conjunction with other indicators.
Setting up the indicator
- Sensitivity - sensitivity of the trend identification;
- DeepBars – the number of candles (bars) for the indicator to calculate its values.
Trading Recommendations
- Open deals when the signal dot appears after a candle closes
- The direction of the deal should correspond to the direction of the trend on the higher timeframes
- Close the deal by an opposite signal or by the defined SL and TP levels
- When using SL and TP, set SL beyond the nearest extremum, TP = 1..2 SL
Other trading options are also possible, you can develop the most convenient tactics for you in the process of trading.
Additional information and a more detailed overview of trading methods can be seen here:
We wish you a stable and profitable trading.
Thank you for using our software.
If you like it, share a link with your friends.
In order not to miss the release of new useful trading programs. add SURE FOREX TRADING to the friends list