Indicadores técnicos para MetaTrader 5 - 38

Este producto recibe información de indicadores/herramientas de señales y muestra flechas o notificaciones cuando se cumplen condiciones específicas.
Por ejemplo, se muestran flechas y notificaciones cuando MA25 y MA50 se cruzan, cuando el SAR se invierte, cuando el MACD cambia su más/menos o cuando el precio de cierre cruza las Bandas de Bollinger.
Consulte la imagen de configuración de muestra para configuraciones específicas.
Para manuales detallados y archivos de configuración:
https://
FREE

StrikeZone Macd Atr es un oscilador avanzado adaptable a la volatilidad que escala el MACD tradicional utilizando ATR.
Este enfoque resuelve el problema común del MACD convencional: no reacciona adecuadamente a los cambios de volatilidad.
Con el escalado ATR, el impulso se vuelve más claro, más suave y más significativo en todas las condiciones del mercado. Características principales 1. Oscilador MACD con escala ATR El indicador ajusta (MACD - Señal) por el ratio ATR, permitiendo: Reducir el ru
FREE

!!!Esta Versión Gratuita sólo funciona con EURUSD!!! Wa Previous Candle Levels MT5 muestra los niveles de velas anteriores, muestra los niveles de velas anteriores Open High Low Close (Niveles OHLC) en diferentes marcos de tiempo. Está diseñado para ayudar al operador a analizar el mercado y prestar atención a los niveles de velas anteriores en diferentes marcos de tiempo. Todos sabemos que los niveles OHLC en mensual, semanal y diario son muy fuertes y la mayoría de las veces, el precio reacci
FREE

Hora en las principales ciudades. Hora de Pekín, hora de Tokio, hora de Sídney, hora de Wellington, hora de Nueva York, hora de Fráncfort, hora de Londres, hora de Dubai. La hora de la ciudad puede activarse o desactivarse. Alerta de cambio de color del spread. Establezca el número de pips a alertar, por ejemplo, establezca 100 pips, el texto se volverá rojo si la diferencia de pips es superior a 100 pips. Hora en las principales ciudades. Hora de Pekín, hora de Tokio, hora de Sydney, hora de We
FREE

Les presento el conocido indicador Fractal.
A este indicador se le han añadido niveles.
En los puntos extremos, se puede ver la continuación de la línea de precios, que cambia cuando cambian los valores del indicador Fractal.
El indicador es fácil de usar. Se han guardado los ajustes básicos de Fractal.
Parámetros FractalLevels:
LeftBars - el número de barras a la izquierda
RightBars - el número de barras a la derecha
FREE
Haven Entry Bands - Su Navegador para Entradas Precisas en el Mercado Presentamos Haven Entry Bands – no es solo un conjunto de líneas en su gráfico, sino un sistema completo para identificar tendencias y encontrar puntos de entrada de alta probabilidad. El indicador se basa en una combinación de la acción del precio suavizada y la volatilidad adaptativa, lo que le permite construir niveles dinámicos de soporte y resistencia basados en los ratios de Fibonacci. Más productos -> AQUÍ . Deje de ad

El indicador mide la fuerza de cada divisa de su lista.
Idea principal: Simplemente itera a través de todas las combinaciones de pares y añade la diferencia entre la apertura y el cierre en porcentaje. Parámetros: Lista de divisas - qué divisas serán calculadas (máximo 8) Tipo de cálculo - a partir de qué datos se calculará la fuerza Entrada de datos de cálculo - se utiliza como entrada relacionada con el tipo de cálculo Sufijo del símbolo - se utiliza en caso de sufijo en los símbolos, por eje
FREE

Este indicador de spread muestra el spread real de cada vela. Destaca el spread máximo y el spread mínimo del símbolo elegido. Este indicador es muy útil para ver en tiempo real la evolución del spread ayudando a evitar tomar una operación cuando el spread es demasiado alto.
Entradas:
Imprimir valor en Puntos: si es true muestra el spread como un número entero.
Mostrar spread mínimo y máximo de los últimos N días: seleccione el número de días para considerar el spread máximo y mínimo
Ajusta
FREE

Simple, directo y eficiente: eso es lo que ofrece Bars Trend y Pivot Support.
Con este sistema, tienes a tu disposición una herramienta intuitiva que facilita tu análisis sobre el gráfico. Marca automáticamente soportes y resistencias importantes en función del periodo elegido, además de resaltar la línea Pivot, todo ello con opciones de activación y desactivación según tu preferencia.
El panel también muestra claramente la dirección de las velas en los marcos temporales D1, H4, H1 y M30, lo
FREE

Este indicador es la combinación del RSI (IFR) con la Media Móvil Simple aplicada al RSI en un único indicador para facilitar la creación de una estrategia. Hice este indicador para que un solo indicador contiene los topes necesarios para implementar un EA.
Descripción de los buffers para el EA,
Buffer 0 -> Valor del RSI Buffer 1 -> Valor de la media móvil aplicada al RSI
FREE

Indicador SuperTrend - Descripción y aviso importante El SuperTrend es un indicador técnico compuesto diseñado para ayudarle a identificar la tendencia principal, medir su fuerza y evaluar la calidad de la señal. Sin embargo, un indicador es sólo una herramienta: nunca es 100% preciso y no puede sustituir a una gestión de riesgos sólida. 1. Fórmula básica y componentes ATR (Average True Range): mide la volatilidad de los precios; personalice la sensibilidad mediante Periodos y Multiplicador . Ba
FREE

INDICADOR: GEN RSI Hunter Desarrollador: gedeegi Descripción general GEN RSI Hunter es un indicador técnico basado en el Índice de Fuerza Relativa (RSI) que detecta automáticamente señales potenciales de COMPRA y VENTA basadas en condiciones de sobrecompra/sobreventa y patrones de reversión de precios. Este indicador es perfecto para los operadores que desean captar oportunidades de giro a corto plazo utilizando la confirmación de la acción del precio y patrones de precios como Doble Techo y Do
FREE

Indicador desarrollado para notificar al usuario cuando el RSI entra y sale de las regiones de sobrecompra y sobreventa, la información se muestra en forma de alertas sonoras y de texto. Las notificaciones se pueden deshabilitar en cualquier momento. El usuario puede cambiar el período del indicador, y es posible insertar el indicador RSI en el gráfico a través de las alertas.
FREE

RQL Trend Board - Descripción RQL Trend Board es un simple pero poderoso tablero de tendencias multi-marco de tiempo.
Muestra la tendencia actual del mercado a través de varios marcos temporales al mismo tiempo, utilizando un método interno de clasificación de tendencias. Cada marco de tiempo se muestra como un cuadro de color: Verde - sesgo alcista → buscar configuraciones largas
Amarillo - oscilación / poco claro → no hay zona de comercio
Rojo - sesgo bajista → buscar configuracione
FREE
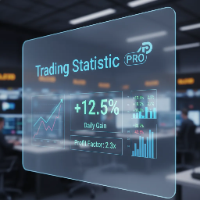
El indicador estadístico para metatrader 5 TradingStatisticPro recopila datos estadísticos sobre sus operaciones, lo que facilita la evaluación de la eficacia de las operaciones, los beneficios obtenidos y los riesgos. El indicador se coloca de forma compacta en la esquina del gráfico principal del terminal y muestra la siguiente información: 1. 1. El beneficio obtenido. 2. La reducción máxima. 3. El factor de recuperación. 4. Factor de ganancia. 5. La relación entre operaciones rentables y no
FREE

https://www.mql5.com Un indicador de media móvil doble Este indicador utiliza el propio sistema de dos períodos de tiempo diferentes de los indicadores de media móvil para reflejar el movimiento de los precios de mercado. Se recomienda utilizar la configuración de los parámetros por defecto, que se puede ajustar de acuerdo a su propia experiencia para obtener el mejor poder de predicción. Espero que le sirva de ayuda en sus operaciones.
FREE

Bandas ATR con zonas de toma de beneficios para MT5 Optimice su gestión de riesgos y su estrategia de trading con el indicador de Bandas ATR para MT5 - una potente herramienta diseñada para ayudarle a navegar por la volatilidad del mercado, identificar niveles de precios clave y establecer objetivos realistas de stop-loss y take-profit. Características principales: Bandas basadas en ATR : El núcleo de este indicador se basa en el Average True Range (ATR) para calcular bandas dinámicas superiores
FREE

Market Time Watch Una herramienta ligera, limpia y esencial para cada trader Market Time Watch es una herramienta profesional de visualización de tiempo en el gráfico, diseñada para traders que necesitan ver la hora local, la hora del servidor y la cuenta regresiva de la vela actual con total precisión. Este indicador muestra toda la información directamente en el gráfico sin elementos pesados o molestos. Ya sea que hagas scalping, intradía, trading de noticias o simplemente necesites una refere
FREE

El indicador Cossover MA Histogram es una herramienta sencilla que muestra la tendencia basada en el cruce de medias móviles. Simplemente especifique dos medias móviles y parámetros adicionales como el método MA y el precio aplicado. Cuando la MA rápida está por encima de la MA lenta el histograma es verde, indicando una tendencia alcista. Cuando la MA rápida está por debajo de la MA lenta, el histograma es rojo, lo que indica una tendencia bajista.
FREE

Este sencillo indicador creativo proporcionará un marco preciso para el sentimiento del mercado dentro del análisis técnico de diferentes marcos temporales. Por ejemplo, para los traders como yo que utilizamos la estrategia "Mark Fisher" regularmente, este es un indicador perfecto para tener una visión de los mercados desde el punto de vista de corto plazo a largo plazo, utilizando los puntos de ruptura de los mínimos y máximos de las velas y perfecto para combinar con "Price Action" . Para más
FREE

Este es un indicador estocástico multi marco, puede adjuntar cualquier marco de tiempo del indicador estocástico en un gráfico. Es muy útil si desea comprobar los datos estocásticos marco de tiempo múltiples. Si usted está interesado en EA, haga clic en los enlaces de abajo para echar un vistazo: https://www.mql5.com/en/market/product/80170 https://www.mql5.com/en/market/product/81136
Como usarlo: > Introduzca el primer marco temporal que desee en el gráfico del par de divisas. > Introduzca el
FREE

El ATR es una medida de volatilidad introducida por el técnico de mercado J. Welles Wilder Jr. en su libro "New Concepts in Technical Trading Systems". En general, los operadores están acostumbrados a ver el ATR en forma de indicador de subventana. Lo que presento aquí es una versión simplificada del ATR - sólo el número actual del ATR - muy útil para monitorizar sólo el momento del gráfico actual. Si quieres monitorizar varios timeframes en el mismo gráfico, sólo tienes que añadir el indicador
FREE
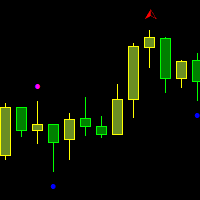
El indicador dibuja dos tipos de fractales de Bill Williams: Fractales rotos - el precio ha estado al menos una vez por encima o por debajo de estos fractales. Fractales no rotos - fractales nuevos en los que el precio aún no se ha movido por encima o por debajo de ellos. Puede configurar el color de los fractales, así como el número de barras utilizadas para la visualización del indicador.
фрактал Вильямса фрактал БВ фракталы Вильямса пробой фрактала пробитый фрактал Торговый хаос broken fract
FREE

Este indicador proporciona formas comunes como opciones de objeto de dibujo. Las formas se pueden girar, redimensionar y arrastrar, y mantendrán sus proporciones (de acuerdo con la línea de tendencia de su asa) en diferentes escalas del gráfico. Se admiten múltiples dibujos.
Formas : Cuadrado Rombo
Triángulo (cuadrilátero e isósceles) Círculo (cuadrícula, cuadrícula superpuesta, cuadrícula flexible, cuadrícula giratoria, círculos concéntricos) Características: rayos (todas las aristas del objeto
FREE

SAM Waves PRO - Indicador de señales profesional para operaciones diarias SAM Waves PRO es la versión ampliada del popular indicador SAM Waves , diseñado específicamente para los operadores de Forex intradía disciplinados. Incluye notificaciones en tiempo real a través de push, correo electrónico y alertas de sonido, asegurando que nunca se pierda una señal de comercio calificado. Probada en más de 5,5 años de datos históricos, la estrategia ha logrado una tasa de ganancias constante por encima

El indicador muestra las señales del sistema MAC (Moving Average Channel) de Jake Bernstein ---------------------------------------- Sistema asume varios tipos de entrar en el comercio, en este indicador sólo un tipo implementado - en el cierre de la segunda barra de disparo. Se recomienda comenzar a utilizar este indicador junto con las lecciones gratuitas de Jake Bernstein https://www.youtube.com/@JakeatMBH/videos La flecha muestra la barra de señal - entrar en el cierre o en la apertura de la
FREE

Este indicador / oscilador múltiple (en adelante indicador), marco de tiempo múltiple e indicador de símbolo múltiple identifica cuando ocurre una divergencia entre el precio y uno, dos o tres indicadores. Identifica divergencias tanto regulares / clásicas (inversión de tendencia) como ocultas (continuación de tendencia). Tiene opciones de filtro de tendencias RSI y MA que permiten filtrar solo las configuraciones más fuertes. Combinado con sus propias reglas y técnicas, este indicador le permit

Indicador de señal SilverTrend (v4.0) Breve descripción.
SilverTrend_Signal es un indicador versátil de análisis técnico de seguimiento de tendencias diseñado para MetaTrader 5. Identifica posibles puntos de inversión del mercado analizando la acción del precio dentro de un canal dinámico basado en la volatilidad. El indicador traza señales claras de compra (flecha hacia arriba) y venta (flecha hacia abajo) directamente en el gráfico y proporciona alertas audiovisuales personalizables para
FREE
Haven QQE PRO - Su Guía Visual de Tendencias en Todos los Marcos Temporales Presentamos Haven QQE PRO – una herramienta práctica basada en el algoritmo QQE, creada para resolver la tarea principal de un trader: identificar rápidamente la tendencia actual y operar en su dirección. El indicador analiza datos de varios marcos temporales a la vez y muestra claramente quién domina el mercado: los compradores o los vendedores. Otros productos -> AQUÍ . Olvídese de tener que cambiar entre gráfico

Este indicador está diseñado de acuerdo a la combinación de los indicadores WPR y Stoch, cuando WPR sube y Stoc sube rápidamente también, el precio puede encontrarse con una fuerte resistencia, muchas veces a corto plazo tomará ganancias, pero si el precio rompe a través de ella, las posiciones largas son más propensas a ser rentables , y lo contrario se mantuvo cierto también. Puede ajustar los parámetros de WPR y Stoc para adaptar el símbolo con el que opera. Haga clic aquí para ver la edició
FREE

El indicador mide la frecuencia de los ticks entrantes para analizar la actividad del mercado. Los ticks alcistas y bajistas se analizan por separado, informando sobre el sentimiento del mercado predominante en ese momento. Según las observaciones, un aumento de la frecuencia de los ticks (pánico) indica el comienzo de fuertes cambios de precios, y un aumento de la frecuencia de los ticks en una dirección determinada no sólo acompaña a un cambio de precios en esta dirección, sino que a menudo lo
FREE
Mystic Pulse V2.0 es un indicador de fuerza de tendencia basado en el Sistema de Movimiento Direccional (DI+ / DI-). Cuenta cuántas velas consecutivas muestran un impulso alcista o bajista creciente. El aumento de DI+ genera un recuento positivo (presión alcista), mientras que el aumento de DI- genera un recuento negativo (presión bajista). Estos recuentos se restablecen cuando el impulso se debilita, dando una visión clara de la persistencia de la tendencia y las inversiones potenciales. Esta v
FREE

Este proyecto no alcanzó el número básico de financiación, por lo que lo abandono momentáneamente. El sistema es ahora libre para otros comerciantes para continuar con la idea. Usted puede seguir mi nuevo proyecto a través de mis señales.
Una herramienta para el inversor institucional, ahora disponible para los usuarios domésticos. ¡Te equipamos como los bancos equipan a sus analistas!
Como funciona
Centrado en el mercado Forex, aprovecha la necesidad de las naciones de controlar el valor de
FREE

VERSIÓN PRO https://www.mql5.com/en/market/product/144989?source=Site https://www.mql5.com/en/users/gedeegi/seller GEN Soporte & Resistencia (EGGII77) es un indicador MT5 que automáticamente detecta y dibuja niveles de Soporte & Resistencia basados en pivotes de máximos y mínimos. El indicador cuenta con dos conjuntos de S&R (estructura principal y niveles rápidos), un número máximo personalizable de líneas, colores ajustables y una pantalla de gráfico limpia para un análisis más claro de la acc
FREE

El indicador de gráfico DFG muestra los niveles DFG históricos utilizados en el panel DFG. Estos niveles se generan dinámicamente utilizando medias móviles y relaciones de Fibonacci. Las bandas de Fibonacci se ajustan automáticamente para reflejar los cambios en el rango de precios y la dirección de la tendencia. El indicador también cuenta con botones para seleccionar el símbolo del gráfico y el marco temporal, junto con una amplia gama de opciones de personalización. Características principale
FREE
Ocho indicadores para configuraciones de 3 días/sesiones/semanas. Consulte nuestros otros productos para fxer.net:
https://www.mql5.com/en/market/product/114888
https://www.mql5.com/en/market/product/114890
Características diarias del indicador: Cierre/alto/bajo diario Apertura/alta/baja/cierre semanal Sesiones de Tokio/Londres/Nueva York Alertas Señales y alertas para Primeros días verdes Primeros días rojos Días interiores Días fuera 3x días de ruptura al alza 3x días de ruptura a la baja N
FREE

Velas ATR (Average True Range como velas OHLC) ATR Candles visualiza el Average True Range (ATR) en una sub-ventana separada usando barras OHLC al estilo de velas . Cada vela representa el cambio en el ATR desde la barra anterior, lo que facilita ver la expansión y contracción de la volatilidad a lo largo del tiempo. Principales características: ATR mostrado como velas OHLC (apertura = ATR anterior, cierre = ATR actual) Entrada: Periodo ATR Dos modos de color : Coincide con la dirección de la ve
FREE

El Oscilador Andino es un indicador de impulso diseñado para ayudar a los traders a identificar tendencias, reversiones y la fuerza del mercado con alta precisión. Inspirado en osciladores clásicos como el MACD y RSI, este indicador suaviza las fluctuaciones del precio y proporciona señales más claras para entrar y salir del mercado.
Características principales: • Detección de impulso y tendencia – ayuda a identificar cambios alcistas y bajistas a tiempo. • Oscilador suavizado – re
FREE

VR Pivot es un indicador de puntos de pivote clave (pivot). Los puntos de pivote son un tipo especial de niveles de soporte (support) y resistencia (resistance) que se utilizan para identificar las zonas de precios más fuertes. Los comerciantes profesionales utilizan los niveles de pivote para determinar los precios a los que hay una alta probabilidad de una reversión de precios. Los niveles se calculan de acuerdo con fórmulas matemáticas especiales, se tienen en cuenta los precios de cierre, ap

Se trata de un indicador MACD ordinario que se muestra en la ventana principal según el estilo de gráfico seleccionado, es decir, Barras, Velas o Línea. Cuando se cambia de tipo de gráfico, la visualización del indicador también cambia. Lamentablemente, no he podido mejorar la velocidad de cambio de tipo de gráfico. Después de cambiar, hay retrasos antes de la llegada de un nuevo tick.
Los parámetros del indicador Periodo EMA rápido Periodo EMA lento Periodo de señal SMA Precio aplicado
FREE

Fractals ST Patterns Strategy es una modificación del indicador Fractals de Bill Williams. Permite establecer cualquier número de barras para encontrar un fractal. Este sencillo indicador corresponde a los parámetros especificados en la Estrategia ST Patterns (https://stpatterns.com/) . Los Structural Target Patterns son esencialmente el propio mercado, que se divide sistemáticamente en componentes. Para formar Patrones ST , no se necesitan líneas de tendencia, proporciones geométricas del propi
FREE

Lot Size Calculator – Calculadora de Tamaño de Lote Este indicador calcula el tamaño de lote según el porcentaje de riesgo seleccionado y la distancia del stop loss. Se puede usar en Forex, metales, índices, materias primas y criptomonedas.
Características principales Cálculo del tamaño de lote según el balance y el porcentaje de riesgo Modos de orden de mercado y orden pendiente Líneas visuales en el gráfico: entrada, stop loss y take profit Visualización de la relación riesgo/beneficio Ajust

La mejor y la única pantalla de la hora mundial para MT5
Características :
- JAPÓN, LONDRES Y NUEVA YORK Tiempo de visualización
- Usted puede personalizar con diferentes fuentes, color y tamaño del texto
- Usted puede personalizar la posición de la caja y el color de la caja para satisfacer su
- Sólo para Metatrader 5
- Personalizar GMT de acuerdo a su zona horaria
- Fácil de usar. Sólo tiene que conectar a su MT5
- No hay código oculto o sin errores
FREE

Haven Market Session Time PRO – tu asistente confiable para el análisis de sesiones de mercado y noticias. Este indicador compacto te mantiene informado sobre las sesiones de trading clave y los eventos económicos importantes directamente en el gráfico. Personaliza la visualización de las sesiones que necesitas: Asia, Londres, EE.UU. y otras regiones. El indicador resalta automáticamente los períodos de actividad, mostrando las horas de inicio y fin de cada sesión. Recibirás alertas sobre evento

Surge la probabilidad de registrar precios más altos cuando MACD rompe el nivel de resistencia histórico del oscilador. Se recomienda encarecidamente confirmar la ruptura del precio con la ruptura del oscilador, ya que tienen efectos comparables a la ruptura de los niveles de soporte y resistencia del precio; seguramente, las operaciones cortas tendrán la misma percepción. Como ventaja, muchas veces la ruptura del oscilador precede a la ruptura del precio como una alerta temprana de un evento pr
FREE

Se trata de un motor CBDR extremadamente limpio, eficiente y bien diseñado.
Calcula el rango de los distribuidores del banco central de ICT (CBDR). Utilizando sólo los cuerpos de las velas - NO las mechas (estructura abierto-cerrado).
Para una ventana de tiempo definida (por ejemplo, 00:00-05:00 Nueva York).
Para cada día pasado y también para hoy en tiempo real. Dibuja lo siguiente en el gráfico: Un rectángulo que muestra todo el rango del cuerpo CBDR La línea CBDR High (cuerpo superior) La lí
FREE

Delta Volumen Simple es un indicador muy potente que lee la oferta en el Mercado.
Calcula el Delta a partir del movimiento del precio y la diferencia de los volúmenes de COMPRA y VENTA. Su estructura especial le permite obtener todos los valores de timeframe disponibles en la plataforma MT5. Trabaja con Tick Volumes y Real Volumes (si están disponibles en su Broker). Una buena observación de este instrumento puede sugerir grandes puntos de entrada y posibles retrocesos. Estamos seguros de que e

Indicador Demarker altamente configurable.
Funciones: Funciones de alerta altamente personalizables (en niveles, cruces, cambios de dirección vía email, push, sonido, popup) Capacidad multi timeframe Personalización del color (en niveles, cruces, cambios de dirección) Opciones de interpolación lineal y modo de histograma Funciona en el probador de estrategias en modo multi timeframe (también en fin de semana sin ticks) Niveles ajustables Parámetros:
Demarker Timeframe: Puede establecer los mar
FREE

El Indicador Supertrend para MT5 es una herramienta poderosa de seguimiento de tendencias diseñada para ayudar a los traders a identificar la dirección del mercado con precisión. Basado en el Average True Range (ATR) , se ajusta dinámicamente a los movimientos del precio, lo que lo hace ideal para diferentes estilos de trading, como scalping, day trading y swing trading.
Características principales: • Detección precisa de tendencias – Identifica claramente tendencias alcistas y bajistas con
FREE

El índice de equilibrio relativo (REi) es un indicador de análisis técnico que muestra la dirección y la fuerza de una tendencia e indica la probabilidad de su cambio. Muestra la relación entre la subida y la bajada medias de los precios durante un periodo de tiempo determinado. El valor del índice permite evaluar si los compradores o los vendedores influyeron más en el precio durante un periodo de tiempo determinado y suponer la evolución futura. El indicador se caracteriza por la sencillez de
FREE

El concepto es sencillo: Trazar el comportamiento del Precio dentro de varios periodos de tiempo. Algunos Símbolos se comportan muy bien durante el día de negociación - con esto me refiero a la negociación Intradía - y este comportamiento termina trazando efectivamente bien con las Medias Móviles Exponenciales propuestas en este indicador... Obviamente este comportamiento no se puede ver en todos los simbolos, pero puedes probarlo... Simplemente coloca este indicador en un gráfico y lo verás por
FREE

Economiza tiempo y toma decisiones más certeras con las VWAPs ancladas Si deseas probar el poder de esta herramienta, puedes descargar el indicador gratuito de VWAPs ancladas para MT5 . Además de trabajar de forma independiente, este indicador también es una extensión para la versión gratuita Sweet VWAP. Esto se debe a que, al hacer clic en la versión gratuita, la VWAP que ves en el puntero del ratón se fijará. Y para una mejor comprensión, lo que estará fijado allí es este indicador, con todas

SuperTrend Pro - Indicador avanzado de detección de tendencias (MT5) SuperTrend Pro es un indicador de seguimiento de tendencias moderno y optimizado para MetaTrader 5 , diseñado para ofrecer una dirección de tendencia clara, una estructura de mercado precisa y una experiencia de trading visual de primera calidad . Se basa en un algoritmo SuperTrend mejorado basado en ATR , combinado con efectos visuales inteligentes, estilo de gráficos y un panel de información en tiempo real. -Características
FREE

Este indicador multi-marco de tiempo identifica la tendencia del mercado a operar dentro de una estrecha banda de precios. [ Guía de instalación | Guía de actualización | Solución de problemas | FAQ | Todos los productos ]
Es fácil de entender Encuentra situaciones de sobrecompra y sobreventa Dibuja al cierre de la barra y no retropinta El marco temporal de cálculo es personalizable La línea roja es el precio de sobrecompra La línea verde es el precio de sobreventa Tiene implicaciones comercial
FREE

El indicador Trend Everest MT5 es un indicador de seguimiento de tendencia que ayuda en la toma de decisiones. Se basa en el cálculo de ATR que ayuda y el casco promedio. Una cuestión clave es que el nominado Trend Everest MT5 no se repinta, por lo que puede backtest con mayor confianza. Cuando es Verde, UpTrend Cuando es una tendencia bajista Roja. No es que el Mercado sea fractal, por lo que cuanto mayor sea el tiempo gráfico, mayor será su grado de asertividad.

Supply Demand Ribbon es un indicador con líneas móviles de oferta y demanda que le ayuda a identificar las zonas de precios más fácilmente. El indicador le ayuda a determinar zonas flexibles de entrada, stop loss y toma de beneficios. También hay estrategias para cambiar algorítmicamente los colores de la cinta. ¡A partir de ahí se puede llegar a muchas estrategias de negociación para usted! ¡ Usted puede explorar muchas características en la versión avanzada aquí !
Versión MT4: ¡Haga clic aquí
FREE

El indicador Magic EMA es de gran ayuda para determinar la dirección de la tendencia. Puede ser un excelente complemento para su estrategia actual o la base de una nueva. Los seres humanos podemos tomar mejores decisiones cuando vemos mejor visualmente. Por eso lo hemos diseñado para que muestre un color diferente para las tendencias alcistas y bajistas. Cada uno puede personalizarlo de la forma que más le convenga. Ajustando el Periodo de Tendencia, podemos optimizarlo para tendencias más larg
FREE

Wikirobo | Indicador inteligente de zonas de entrada para todos los marcos temporales Wikirobo es un potente indicador que destaca automáticamente las posibles zonas de entrada como órdenes Buy Limit y Sell Limit en todos los marcos temporales. Aspectos destacados Zonas de entrada sugeridas para cada marco temporal ️ Niveles de Stop Loss claros y específicos para cada marco temporal mostrados en el gráfico para una mejor gestión del riesgo y dimensionamiento de las posiciones Ade
FREE

El indicador "Time Broker Deriv" está diseñado específicamente para su uso en los índices sintéticos Boom y Crash, así como en otros pares de trading disponibles en la plataforma MT5. Su función principal es proporcionar la hora del broker en comparación con nuestra hora local. Es importante destacar que el indicador "Time Broker Deriv" solo muestra la hora del broker.
FREE

El indicador PivotPointSuperTrend muestra perfectamente los datos de Tendencia basados en los datos de la matriz de Pivot y ATR y es muy cómodo para introducir operaciones y colocar stops. Si alguien puede añadir multitimefrem al código, yo y muchos usuarios estaremos muy agradecidos, Es decir, hacer que el indicador muestre el valor del marco temporal superior en el gráfico del marco temporal inferior, ¡Gracias de antemano!
FREE

El indicador se basa en la metodología de Robert Miner descrita en su libro "High probability trading strategies" y muestra señales junto con el impulso de 2 marcos temporales. Como indicador de impulso se utiliza un oscilador estocástico.
Los ajustes hablan por sí mismos period_1 es el marco temporal actual, 'current period_2 se indica - el plazo superior es 4 o 5 veces mayor que el actual. Por ejemplo, si el actual es de 5 minutos, entonces el más antiguo será de 20 minutos El resto de los a
FREE

Descripción This is an indicator for MT5 which has enhanced the "Fractals" indicator. El indicador "Fractales" está incluido en MT5 por defecto pero el periodo de trazado de la línea está fijado en "5" y no se puede modificar. Por ello he reinventado el indicador Fractales con algunas funciones útiles añadidas. Esta herramienta será útil especialmente para aquellos que están aprendiendo a trazar buenas líneas horizontales y quieren tener alguna referencia. Por supuesto, también gustará a aquel
FREE

Este indicador te permite transformar la apariencia de tu gráfico aplicando una transición suave entre dos colores personalizables para el fondo. Este efecto de degradado llamativo le da a tu gráfico un aspecto fresco y moderno, haciéndolo más atractivo visualmente. El degradado se aplica a todas las ventanas de indicadores que actualmente están en tu gráfico cuando se adjunta el indicador y también afectará a cualquier nueva ventana de indicador que se agregue más tarde. ¡Pruébalo y refresca la
FREE
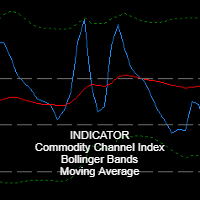
Descripción del indicador principal: RosMaFin Triple Insight CCI Navigator es un indicador técnico avanzado que combina el poder de tres indicadores populares - CCI (Commodity Channel Index), Bandas de Bollinger y Media Móvil - en una ventana integral. Esta versátil herramienta proporciona a los operadores una visión compleja de las condiciones del mercado y ayuda a identificar posibles oportunidades de negociación con mayor precisión. Características principales: Visualización de los tres indic
FREE

Este sencillo indicador pinta con un color más oscuro la barra de volumen cuando la cantidad negociada está por encima de la media de un número selecto de periodos del propio volumen, destacando los momentos en los que hubo un gran volumen de operaciones por encima de la media. También es posible utilizar una configuración de cuatro colores donde el tono del color muestra la fuerza del volumen de la vela. El indicador utiliza por defecto la media simple de 20 periodos, pero es posible cambiar a
FREE

El Asesor Experto para este indicador se puede encontrar aquí: https: //www.mql5.com/en/market/product/115567 El indicador Líneas de ruptura de contracción/expansión con Fair Value Gaps (FVGs) para MetaTrader 5 (MT5) es una potente herramienta de análisis técnico diseñada para ayudar a los operadores a identificar y visualizar rupturas en niveles críticos de contracción y expansión en los mercados financieros. Mediante la incorporación de Fair Value Gaps (FVGs), este indicador mejora la capacida
FREE
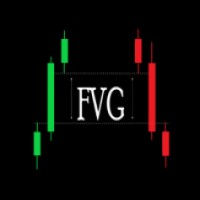
Presentación del indicador de brecha del valor razonable : Una herramienta de negociación sencilla y eficaz El indicador Fair Value Gap está diseñado para ayudar a los operadores a identificar y utilizar fácilmente los Fair Value Gaps (FVG) en sus estrategias de negociación. Los FVG ponen de relieve los desequilibrios de precios que el mercado vuelve a visitar a menudo, ofreciendo posibles oportunidades de entrada o salida en las operaciones. Tanto si es un principiante como un operador experim
FREE

El impulso de la fuerza de la divisa tiene muchas similitudes con el medidor de la fuerza de la divisa presentado en la página anterior, pero las diferencias son mucho más pronunciadas. Usted puede tratar de poner ambos en el mismo gráfico y ver la diferencia en los resultados. El impulso de la fuerza de la div isa mide la fuerza de una divisa basada en (usted lo adivina) su impulso relativo a otras divisas, mientras que el medidor de la fuerza de la divisa mide la fuerza de una divisa basada en
FREE
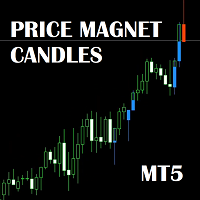
El indicador muestra velas que son potencialmente interesantes para que el precio del mercado las alcance. Al observarlas, podrás anticipar hacia dónde podría moverse el mercado a continuación. La idea es completamente original y está relacionada con el concepto de Smart Money (Dinero Inteligente) . Cómo funciona:
Las velas activas se destacan con color. Funcionan como imanes para los creadores de mercado, ya que todavía contienen liquidez. Dependiendo de su posición respecto al precio actual, l

El indicador ZigZag SMC/SMT para MT5 es la herramienta ideal para los traders que desean identificar con precisión máximos y mínimos basándose en los conceptos avanzados de Smart Money Concepts (SMC) y Smart Money Trap (SMT).
Beneficios principales: Identificación automática de máximos y mínimos estratégicos. Basado en conceptos utilizados por traders institucionales. Ideal para analizar liquidez, estructura del mercado y manipulación. Fácil de usar: simplemente agréguelo al gráfico
FREE
MetaTrader Market es el mejor lugar para vender los robots comerciales e indicadores técnicos.
Sólo necesita escribir un programa demandado para la plataforma MetaTrader, presentarlo de forma bonita y poner una buena descripción. Le ayudaremos publicar su producto en el Servicio Market donde millones de usuarios de MetaTrader podrán comprarlo. Así que, encárguese sólo de sus asuntos profesionales- escribir los programas para el trading automático.
Está perdiendo oportunidades comerciales:
- Aplicaciones de trading gratuitas
- 8 000+ señales para copiar
- Noticias económicas para analizar los mercados financieros
Registro
Entrada
Si no tiene cuenta de usuario, regístrese
Para iniciar sesión y usar el sitio web MQL5.com es necesario permitir el uso de Сookies.
Por favor, active este ajuste en su navegador, de lo contrario, no podrá iniciar sesión.