Technische Indikatoren für den MetaTrader 5 - 38

Der Relative Equilibrium Index (REi) ist ein Indikator der technischen Analyse, der die Richtung und Stärke eines Trends anzeigt und die Wahrscheinlichkeit seiner Änderung angibt. Er zeigt das Verhältnis zwischen dem durchschnittlichen Kursanstieg und dem durchschnittlichen Kursrückgang über einen bestimmten Zeitraum an. Anhand des Indexwertes lässt sich beurteilen, ob Käufer oder Verkäufer in einem bestimmten Zeitraum einen stärkeren Einfluss auf den Kurs hatten, und man kann von der weiteren E
FREE

Beschreibung: Der Indikator für benutzerdefinierte gleitende Durchschnitte zeigt drei verschiedene gleitende Durchschnitte auf dem Diagramm an: einen einfachen gleitenden Durchschnitt über 10 Perioden (SMA10) in Kalk, einen einfachen gleitenden Durchschnitt über 21 Perioden (SMA21) in Rot und einen exponentiellen gleitenden Durchschnitt über 200 Perioden (EMA200) in kräftigem Weiß. Dieser Indikator hilft Händlern, Trends und potenzielle Einstiegs- und Ausstiegspunkte auf der Grundlage des Verhal
FREE

Der technische Indikator, bekannt als Perfect Trend Lines . Dieser Indikator ist ein wertvolles Instrument der technischen Analyse und wird verwendet, um die Entscheidungsfindung beim Handel zu verbessern. Im Folgenden wird Schritt für Schritt beschrieben, wie er funktioniert und wie er von Händlern verwendet werden kann: Trendidentifizierung : Perfekte Trendlinien werden gezeichnet, indem man zwei oder mehr Kurspunkte auf einem Diagramm verbindet und so die allgemeine Richtung des Marktes aufze
FREE
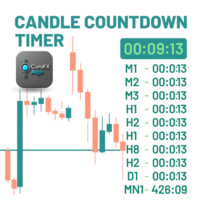
ClaroFxAlgo Kerzen-Countdown-Timer - MetaTrader 5 Indikator Übersicht CandleCountdownTimer ist ein leistungsfähiger und dennoch leichtgewichtiger MT5-Indikator, der dynamische Countdowns bis zum nächsten Kerzenschluss anzeigt und Händlern hilft, ein präzises Timing-Bewusstsein über alle Zeitrahmen hinweg zu erlangen. Sein schlankes, anpassbares Design stellt sicher, dass wichtige Timing-Daten sichtbar sind - ohne Ihre Charts zu überladen. Hauptmerkmale ️ Main Timer Display - Live-Countdown
FREE

Dieser Multi-Indikator/Oszillator (im Folgenden Indikator), der mehrere Zeitrahmen und Symbole umfasst, erkennt, wenn eine Divergenz zwischen dem Preis und einem, zwei oder drei Indikatoren auftritt. Er identifiziert sowohl regelmäßige/klassische (Trendumkehr) als auch versteckte (Trendfortsetzung) Divergenzen. Er verfügt über RSI- und MA-Trendfilteroptionen, die es ermöglichen, nur die stärksten Setups herauszufiltern. In Kombination mit Ihren eigenen Regeln und Techniken können Sie mit diesem
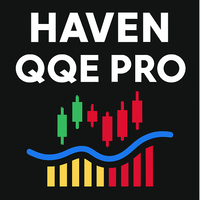
Haven QQE PRO - Ihr visueller Leitfaden für Trends auf allen Zeitebenen Wir stellen vor: Haven QQE PRO – ein praktisches Werkzeug auf Basis des QQE-Algorithmus, das entwickelt wurde, um die Hauptaufgabe eines Traders zu lösen: den aktuellen Trend schnell zu erkennen und in dessen Richtung zu handeln. Der Indikator analysiert Daten aus mehreren Zeitebenen gleichzeitig und zeigt anschaulich, wer den Markt dominiert – Käufer oder Verkäufer. Weitere Produkte -> HIER . Vergessen Sie das Umschal

TickChartAskLine ist ein spezieller Indikator für MetaTrader 5, der entwickelt wurde, um den gleitenden Spread auf Tick-Charts zu visualisieren, die mit TickChartService erstellt wurden. Der Indikator zeigt zwei Linien auf dem Chart an: eine blaue Bid-Linie (Hauptpreis) und eine rote Ask-Linie, Dadurch können Händler die Spread-Dynamik in Echtzeit visuell verfolgen. Dies ist von entscheidender Bedeutung für Scalper und Hochfrequenzhändler, die die Einstiegskosten auf jeder Tick-Ebene überwachen
FREE

Der Cossover-MA-Histogramm-Indikator ist ein einfaches Werkzeug, das den Trend auf der Grundlage der Überkreuzung von gleitenden Durchschnitten anzeigt. Geben Sie einfach zwei gleitende Durchschnitte und zusätzliche Parameter wie MA-Methode und angewandter Preis an. Wenn der schnelle MA über dem langsamen MA liegt, ist das Histogramm grün und zeigt einen Aufwärtstrend an. Wenn der schnelle MA unter dem langsamen MA liegt, ist das Histogramm rot und zeigt einen Abwärtstrend an.
FREE

SuperTrend-Indikator - Beschreibung und wichtiger Hinweis Der SuperTrend ist ein zusammengesetzter technischer Indikator, der Ihnen helfen soll, den primären Trend zu identifizieren, seine Stärke zu messen und die Signalqualität zu bewerten. Ein Indikator ist jedoch nur ein Hilfsmittel - er ist nie 100%ig genau und kann ein solides Risikomanagement nicht ersetzen. 1. Kernformel & Komponenten ATR (Average True Range): misst die Preisvolatilität; die Empfindlichkeit kann über Perioden und Multipli
FREE

SilverTrend Signal Indikator (v4.0) Kurzbeschreibung
Das SilverTrend_Signal ist ein vielseitiger, trendfolgender technischer Analyse-Indikator für den MetaTrader 5. Er identifiziert potentielle Marktumkehrpunkte durch die Analyse der Preisbewegung innerhalb eines dynamischen volatilitätsbasierten Kanals. Der Indikator zeigt klare Kauf- (Pfeil nach oben) und Verkaufssignale (Pfeil nach unten) direkt auf dem Chart an und bietet anpassbare akustische und visuelle Warnungen, um Händler über neu
FREE

Dieser Indikator ist nach der Kombination von WPR und Stoch-Indikatoren, wenn WPR geht nach oben und Stoc geht nach oben schnell zu, der Preis kann auf starken Widerstand, viele Male kurz, um Gewinn zu nehmen, aber wenn der Preis brechen durch sie, Long-Positionen sind eher profitabel zu sein, und das Gegenteil gilt auch . Sie können die Parameter von WPR und Stoc an das von Ihnen verwendete Symbol anpassen. Klicken Sie hier, um die erweiterte Ausgabe zu sehen :https://www.mql5.com/en/market/pr
FREE

Der Indikator misst die Häufigkeit der eingehenden Ticks, um die Marktaktivität zu analysieren. Bullische und bearische Ticks werden getrennt analysiert und geben Aufschluss über die derzeit vorherrschende Marktstimmung. Beobachtungen zufolge deutet ein Anstieg der Tickfrequenz (Panik) auf den Beginn starker Kursveränderungen hin, und ein Anstieg der Tickfrequenz in eine bestimmte Richtung begleitet nicht nur eine Kursveränderung in diese Richtung, sondern nimmt sie oft auch vorweg. Der Indikato
FREE

Dieser MetaTrader 5-Indikator zeichnet ICT Killzone-Sitzungsmarker mit vertikalen Linien in das Diagramm ein. Er zeichnet die Anfangs- und Endzeiten für drei institutionelle Handelssitzungen - Asien , London und New York - für eine benutzerdefinierte Anzahl von historischen Tagen. Es werden keine Puffer oder Plots verwendet; stattdessen stützt sich der Indikator vollständig auf Chart-Objekte (OBJ_VLINE) .
1. Eingaben und Parameter Der Indikator ermöglicht die vollständige Anpassung jedes Killzo
FREE

LongTerm — Indikator zur mittel- und langfristigen Trendrichtungsanalyse LongTerm ist ein Indikator zur Richtungsanalyse , der entwickelt wurde, um die Stärke und Qualität des mittel- bis langfristigen Trends zu interpretieren, mit einem klaren Fokus auf die Long-orientierte Analyse . Er ist kein Einstiegssignal und kein Timing-Indikator , sondern ein Analysewerkzeug, das dem Trader hilft zu verstehen, wann der Markt günstige oder ungünstige Bedingungen für einen Long-Trend bietet , indem es das
FREE
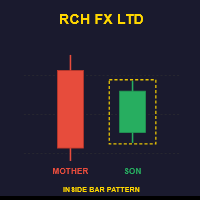
Möchten Sie eine Sitzungsfilterung für Ihre Zeitzone? https://www.mql5.com/en/market/product/148638?source=Site+Profile Upgrade auf ADVANCED v1.40 für präzises Backtesting mit anpassbaren Handelszeiten und GMT-Offset-Kontrollen. Inside Bar Detector - Kostenlose Version Erkennt und markiert automatisch Inside-Bar-Muster in Ihren Charts mit visuellen Rechtecken. Einfach, zuverlässig und funktioniert auf allen Zeitrahmen. Merkmale: Erkennung von Inside Bar in Echtzeit Anpassbare Farben und Stile de
FREE
Mystic Pulse V2.0 ist ein Trendstärkeindikator, der auf dem Directional Movement System (DI+ / DI-) basiert. Er zählt, wie viele aufeinanderfolgende Kerzen eine zunehmende bullische oder bearische Dynamik aufweisen. Eine steigende DI+ erzeugt einen positiven Zähler (Aufwärtsdruck), während eine steigende DI- einen negativen Zähler (Abwärtsdruck) erzeugt. Diese Zählungen werden zurückgesetzt, wenn das Momentum nachlässt, was eine klare visuelle Darstellung der Trendbeständigkeit und möglicher Umk
FREE

Zeit in größeren Städten. Peking-Zeit, Tokio-Zeit, Sydney-Zeit, Wellington-Zeit, New York-Zeit, Frankfurt-Zeit, London-Zeit, Dubai-Zeit. Die Stadtzeit kann ein- oder ausgeschaltet werden. Alarm bei Spread-Farbwechsel. Stellen Sie die Anzahl der Pips ein, bei denen ein Alarm ausgelöst werden soll, z. B. 100 Pips, dann wird der Text rot, wenn die Differenz mehr als 100 Pips beträgt. Zeit in Großstädten: Peking-Zeit, Tokio-Zeit, Sydney-Zeit, Wellington-Zeit, New York-Zeit, Frankfurt-Zeit, London-Ze
FREE

Zweck DG DayInfo ist ein kostenloser Indikator, der Informationen anzeigt über: Höchstkurse des Tages; die Mindestpreise des Tages; Die prozentualen Schwankungen des Tages; Richtung der Tageskerze (aufwärts, abwärts oder flach); Kerzen-Timer; Auf diese Weise hilft Ihnen DG DayInfo, das Tagesmaximum und -minimum zu sehen, die prozentuale Abweichung des Tages und die verbleibende Zeit bis zum Kerzenschluss zu überprüfen.
Hauptmerkmale Entwickelt, um einfach zu bedienen zu sein, mit wenigen Parame
FREE

Ich präsentiere den bekannten Fractal-Indikator.
Diesem Indikator wurden Niveaus hinzugefügt.
An den Extrempunkten können Sie die Fortsetzung der Preislinie sehen, die sich ändert, wenn sich die Werte des Fraktal-Indikators ändern.
Der Indikator ist einfach zu bedienen. Die grundlegenden Fractal-Einstellungen wurden gespeichert.
FractalLevels Parameter:
LeftBars - die Anzahl der Balken auf der linken Seite
RightBars - die Anzahl der Balken auf der rechten Seite
FREE

PRO VERSION https://www.mql5.com/en/market/product/144989?source=Site https://www.mql5.com/en/users/gedeegi/seller GEN Support & Resistance (EGGII77) ist ein MT5-Indikator, der automatisch Unterstützungs- und Widerstandsniveaus auf der Grundlage von Pivot-Hochs und -Tiefs erkennt und einzeichnet. Der Indikator verfügt über zwei Sätze von S&R (Hauptstruktur und Quick Levels), eine anpassbare maximale Anzahl von Linien, anpassbare Farben und eine übersichtliche Chartanzeige für eine klarere Preisa
FREE
Session Bias Diese Strategie der Verzerrung nützlich für diejenigen, die TRADESHARE auf youtube folgen . Dieses Skript wurde entwickelt von BokaroTraderFx für Händler, die Unterstützung bei der Bestimmung ihrer Session Bias wünschen, insbesondere für diejenigen, die innerhalb von Sessions handeln, die typischerweise durch eine einzelne 4-Stunden-Kerze repräsentiert werden. Die Methode beinhaltet die Verwendung von Preisaktionen, um eine tägliche Tendenz zu ermitteln, die Entscheidungen darüber
FREE

Market Time Watch Uma ferramenta leve, limpa e essencial para todo trader Market Time Watch é um mostrador de tempo profissional no gráfico, projetado para traders que precisam ver com precisão a hora local, a hora do servidor e a contagem regressiva da vela atual. Tudo isso diretamente no gráfico, sem painéis pesados ou elementos desnecessários. Se você faz scalping, day trade, opera notícias ou apenas precisa de uma referência clara de tempo, Market Time Watch oferece tudo de forma minimalista
FREE

Dieser Indikator ist die Kombination des RSI (IFR) mit dem einfachen gleitenden Durchschnitt, der auf den RSI angewendet wird, in einem einzigen Indikator, um die Erstellung einer Strategie zu erleichtern. Ich habe diesen Indikator so gestaltet, dass ein einziger Indikator die notwendigen Puffer enthält, um einen EA zu implementieren.
Beschreibung der Puffer für den EA,
Puffer 0 -> RSI-Wert Puffer 1 -> Wert des gleitenden Durchschnitts, der auf den RSI angewendet wird
FREE

Vorerst kostenlos, der Preis wird am 1. Januar 2025 30 USD betragen.
Features: Pin Bar-Erkennung : Der Indikator ist so konzipiert, dass er bullische und bearische Pin-Bars anhand spezifischer Kriterien erkennt, einschließlich der relativen Größe des Kerzenkörpers und des Schattens sowie der Position des Kerzenkörpers in Bezug auf das 38,2%-Fibonacci-Level. Anpassbare Beschriftungen : Über jedem identifizierten bullischen oder bearischen Pin Bar wird ein benutzerdefinierter Text angezeigt, wie z
FREE

Candle Countdown (MT5) — Verbleibende Zeit der aktuellen Kerze Candle Countdown ist ein schlanker MetaTrader-5-Indikator, der die verbleibende Zeit bis zum Kerzenschluss in Echtzeit als Countdown anzeigt. Er aktualisiert sich jede Sekunde und bleibt dabei übersichtlich, ohne den Chart zu überladen. Hauptfunktionen Live-Countdown (mm:ss oder hh:mm:ss je nach Timeframe) 3 Anzeige-Positionen Preislevel (TradingView-Style) — nahe am aktuellen Preislevel ausgerichtet Oben rechts — feste Position in d
FREE

VR Pivot ist ein Indikator für wichtige Drehpunkte (pivot). Umkehrpunkte sind eine spezielle Art von Unterstützung (support) und Widerstandsstufen (resistance), die verwendet werden, um die stärksten Preiszonen zu identifizieren. Professionelle Händler verwenden Umkehrpunkte, um die Preise zu bestimmen, zu denen eine hohe Wahrscheinlichkeit einer Preisumkehr besteht. Die Niveaus werden nach speziellen mathematischen Formeln berechnet, die Preise des Schließens, Öffnens, Maximums, Minimums des vo

Fractals ST Patterns Strategy ist eine Modifikation des Fractals-Indikators von Bill Williams. Er ermöglicht es, eine beliebige Anzahl von Balken für die Suche nach einem Fraktal einzustellen. Dieser einfache Indikator entspricht den Parametern, die in der ST Patterns Strategy (https://stpatterns.com/) angegeben sind. Structural Target Patterns sind im Wesentlichen der Markt selbst, der konsequent in Komponenten aufgeteilt wird. Um ST-Patterns zu bilden, werden keine Trendlinien, geometrischen P
FREE

Lot Size Calculator – Lotgrößen-Rechner Dieser Indikator berechnet die Lotgröße basierend auf dem gewählten Risiko-Prozentsatz und der Stop-Loss-Distanz. Geeignet für Forex, Metalle, Indizes, Rohstoffe und Kryptowährungen.
Hauptfunktionen Berechnung der Lotgröße basierend auf Kontostand und Risiko-Prozentsatz Unterstützung für Markt- und Pending-Orders Visuelle Linien im Chart: Einstieg, Stop Loss und Take Profit Anzeige des Chancen-Risiko-Verhältnisses Automatische Anpassung der Lotgröße je n

ATR ist ein Maß für die Volatilität, das von Markttechniker J. Welles Wilder Jr. in seinem Buch "New Concepts in Technical Trading Systems" eingeführt wurde. Im Allgemeinen sind Händler daran gewöhnt, die ATR in Form eines Sub-Fenster-Indikators zu sehen. Was ich hier vorstelle, ist eine vereinfachte Version der ATR - nur die aktuelle ATR-Zahl -, die sehr nützlich ist, um nur den aktuellen Moment des aktuellen Charts zu überwachen. Wenn Sie mehrere Zeitrahmen im selben Chart überwachen möchten,
FREE

Haven Market Session Time PRO – Ihr zuverlässiger Assistent für die Analyse von Marktsitzungen und Nachrichten. Dieser kompakte Indikator hält Sie über die wichtigsten Handelssitzungen und bedeutenden Wirtschaftsnachrichten direkt im Chart informiert. Passen Sie die Anzeige der benötigten Sitzungen an – Asien, London, USA und andere Regionen. Der Indikator hebt automatisch die Aktivitätszeiträume hervor und zeigt die Start- und Endzeiten jeder Sitzung an. Sie erhalten Benachrichtigungen über bev

Delta Single Volume ist ein sehr leistungsfähiger Indikator, der das Angebot auf dem Markt anzeigt.
Er berechnet das Delta aus der Bewegung des Preises und der Differenz der KAUF- und VERKAUFS-Volumina. Seine spezielle Struktur ermöglicht es Ihnen, alle auf der MT5-Plattform verfügbaren Zeitrahmenwerte zu erhalten. Es arbeitet mit Tick-Volumen und Real-Volumen (falls bei Ihrem Broker verfügbar). Eine gute Beobachtung dieses Instruments kann großartige Einstiegspunkte und mögliche Umkehrungen vo

Es besteht die Wahrscheinlichkeit, dass höhere Kurse verzeichnet werden, wenn der MACD aus dem historischen Widerstandsniveau des Oszillators ausbricht. Es wird dringend empfohlen, Kursausbrüche mit Oszillatorausbrüchen zu bestätigen, da sie vergleichbare Auswirkungen haben wie das Durchbrechen von Unterstützungs- und Widerstandsniveaus durch den Kurs; sicherlich werden Short-Trades die gleiche Wahrnehmung haben. Der Vorteil ist, dass der Oszillatorausbruch oft dem Preisausbruch vorausgeht und s
FREE

Hochgradig konfigurierbare Demarker-Anzeige.
Merkmale: Hochgradig anpassbare Alarmfunktionen (bei Levels, Kreuzen, Richtungsänderungen per E-Mail, Push, Sound, Popup) Multi-Timeframe-Fähigkeit Farbanpassung (bei Pegeln, Kreuzen, Richtungsänderungen) Optionen für lineare Interpolation und Histogramm-Modus Funktioniert im Strategie-Tester im Multi-Timeframe-Modus (auch am Wochenende ohne Ticks) Einstellbare Levels Parameter:
Demarker Timeframe: Sie können die unteren/höheren Timeframes für Demar
FREE

Der Supertrend Indikator für MT5 ist ein leistungsstarkes Trendfolge-Tool, das Tradern hilft, die Marktrichtung präzise zu bestimmen. Basierend auf dem Average True Range (ATR) passt er sich dynamisch an Kursbewegungen an und eignet sich für verschiedene Handelsstile, einschließlich Scalping, Daytrading und Swingtrading.
Hauptmerkmale: • Präzise Trenderkennung – Identifiziert klar bullische und bärische Trends mit einer farbcodierten Trendlinie. • ATR-basierte Volatilitätsanpassu
FREE

Zeit sparen und fundiertere Entscheidungen treffen mit verankerten VWAPs Wenn Sie die Leistung dieses Tools testen möchten, können Sie den kostenlosen Anker-VWAP-Indikator für MT5 herunterladen. Dieser Indikator funktioniert nicht nur unabhängig, sondern ist auch eine Erweiterung der kostenlosen Sweet VWAP-Version. Das liegt daran, dass, wenn Sie auf die kostenlose Version klicken, der VWAP, den Sie am Mauszeiger sehen, fixiert wird. Und zur besseren Verständlichkeit, derjenige, der dort fixiert

SuperTrend Pro - Fortgeschrittener Trend-Erkennungs-Indikator (MT5) SuperTrend Pro ist ein moderner, optimierter Trendfolgeindikator für MetaTrader 5 , der eine klare Trendrichtung, eine präzise Marktstruktur und ein erstklassiges visuelles Handelserlebnis bietet. Er basiert auf einem verbesserten ATR-gestützten SuperTrend-Algorithmus , kombiniert mit intelligenter Grafik, Chart-Styling und einem Echtzeit-Informationspanel. -Hauptmerkmale - Erweiterte SuperTrend-Logik Verwendet ATR (Average True
FREE

Der Trend Everest MT5-Indikator ist ein Trendfolgeindikator, der bei der Entscheidungsfindung hilft. Es basiert auf der Berechnung von ATR, die unterstützen, und dem durchschnittlichen Rumpf. Ein wichtiges Problem ist, dass der Trend Everest MT5-Nominierte nicht neu gestrichen wird, sodass Sie mit größerer Sicherheit Backtests durchführen können. Wenn es grüner High-Trend ist Wenn es Roter Abwärtstrend ist. Nicht, dass der Markt fraktal ist, je länger die Grafikzeit, desto größer ist sein Durchs

StrikeZone Macd Atr ist ein fortschrittlicher volatilitätsadaptiver Oszillator, der den traditionellen MACD mit Hilfe der ATR skaliert.
Dieser Ansatz löst das häufige Problem des herkömmlichen MACD: Er reagiert nicht richtig auf sich ändernde Volatilität.
Mit der ATR-Skalierung wird das Momentum klarer, gleichmäßiger und aussagekräftiger über alle Marktbedingungen hinweg. Wichtigste Merkmale 1. ATR-skalierter MACD-Oszillator Der Indikator passt (MACD - Signal) an das ATR-Verhältnis an und ermögl
FREE

Der PivotPointSuperTrend-Indikator zeigt die Trenddaten auf Basis der Matrixdaten von Pivot und ATR perfekt an und ist sehr praktisch für die Eingabe von Trades und das Setzen von Stops. Wenn jemand multitimefrem zum Code hinzufügen kann, werde ich und viele Benutzer sehr dankbar sein, D.h. dass der Indikator den Wert des höheren Zeitrahmens auf dem Chart des niedrigeren Zeitrahmens anzeigt, Vielen Dank im Voraus!
FREE

Hochgradig konfigurierbarer MFI-Indikator. Merkmale: Hochgradig anpassbare Alarmfunktionen (bei Levels, Kreuzen, Richtungsänderungen per E-Mail, Push, Sound, Popup) Multi-Timeframe-Fähigkeit Farbanpassung (bei Levels, Kreuzen, Richtungswechseln) Optionen für lineare Interpolation und Histogramm-Modus Funktioniert im Strategie-Tester im Multi-Timeframe-Modus (auch am Wochenende ohne Ticks) Einstellbare Levels Parameter:
MFI Timeframe: Sie können den aktuellen oder einen höheren Timeframe für MF
FREE

Beschreibung This is an indicator for MT5 which has enhanced the "Fractals" indicator. Der Indikator "Fraktale" ist standardmäßig im MT5 enthalten, aber die Periode, in der die Linie gezeichnet wird, ist auf "5" festgelegt und kann nicht geändert werden. Daher habe ich den Indikator "Fraktale" neu erfunden und einige nützliche Funktionen hinzugefügt. Dieses Tool ist vor allem für diejenigen nützlich, die lernen, wie man gute horizontale Linien zeichnet und eine Referenz erhalten möchten. Natür
FREE

Mit dem benutzerdefinierten Panel können Sie alle wichtigen Informationen sammeln und sie in einer praktischen Tabelle in der oberen rechten Ecke des Diagramms anzeigen.
Sie können den Inhalt der Tabelle selbst bestimmen. Jede Zeile zeigt Ihre eigene Bedingung oder Ihren eigenen Wert an. Jede Spalte zeigt einen anderen Zeitrahmen an. Das Panel kann bis zu 10 Zeilen und bis zu 8 Spalten enthalten. Beispielhafte Verwendung Zeile : Preis > EMA(30)
Modus : YES_NO
Bedeutung : liegt aktueller Kurs üb
FREE

Dieser Indikator ermöglicht es Ihnen, das Aussehen Ihres Charts zu verändern, indem Sie einen sanften Übergang zwischen zwei anpassbaren Farben für den Hintergrund anwenden. Dieser auffällige Farbeffekt verleiht Ihrem Chart ein frisches, modernes Aussehen und macht es visuell ansprechender. Der Farbverlauf wird auf alle Indikatorfenster angewendet, die sich derzeit auf Ihrem Chart befinden, wenn der Indikator angehängt ist, und wird auch alle neuen Indikatorfenster beeinflussen, die später hinzu
FREE

Willkommen bei HiperCube VIX Rabattcode für 25% bei Darwinex Zero: DWZ2328770MGM Dieser Indikator liefert Ihnen echte Informationen zum Marktvolumen von sp500 / us500
Definition HiperCube VIX, auch bekannt als CBOE Volatility Index, ist ein weithin anerkanntes Maß für Marktangst oder -stress. Er signalisiert das Maß an Unsicherheit und Volatilität auf dem Aktienmarkt und verwendet den S&P 500-Index als Proxy für den breiten Markt. Der VIX-Index wird auf Grundlage der Preise von Optionskontrakt
FREE

Gewiss! Ich möchte Ihnen ein leistungsfähiges Tool für den MetaTrader 5 (MT5) vorstellen, das automatisch Unterstützungs- und Widerstandsniveaus (S&R) auf Ihren Trading-Charts identifizieren und einzeichnen kann. Dieses Tool heißt "Support and Resistance Levels Guru". Unterstützung Widerstand Levels Guru Der Support & Resistance Indicator zeigt automatisch wichtige S&R Levels auf Ihrem Chart an. Diese Niveaus sind entscheidend für die technische Analyse und werden von vielen Händlern verwendet.
FREE

RQL Trend Board - Beschreibung RQL Trend Board ist ein einfaches, aber leistungsstarkes Multi-Timeframe-Trend-Dashboard.
Es zeigt die aktuelle Markttendenz über mehrere Zeitrahmen gleichzeitig an, wobei eine interne Trendklassifizierungsmethode verwendet wird. Jeder Zeitrahmen wird als farbiger Kasten angezeigt: Grün - bullische Tendenz → nach Long-Setups suchen
Gelb - Range / unklar → keine Handelszone
Rot - bearische Tendenz → nach Short-Setups suchen Der Indikator gibt ein klares Ge
FREE

Supply Demand Ribbon ist ein Indikator mit sich bewegenden Angebots- und Nachfragelinien, die Ihnen helfen, Preiszonen leichter zu identifizieren. Der Indikator hilft Ihnen, flexible Einstiegs-, Stop-Loss- und Take-Profit-Bereiche zu bestimmen. Es gibt auch Strategien für die algorithmische Änderung der Ribbon-Farben. Auf dieser Grundlage können Sie viele Handelsstrategien für sich selbst entwickeln! Sie können viele Funktionen der Advanced Version hier entdecken !
MT4 Version: Klicken Sie hier
FREE

Dieser Indikator stellt die berechneten Niveaus der "tausend" Regionen der IBOV auf dem Mini-Index dar, in denen es ein starkes institutionelles Engagement gibt, das auf ihren Options-Lock-Positionen beruht. In diesem Sinne neigen die Akteure dazu, ihre Positionen zu verteidigen, indem sie auf den Mini-Index einwirken. Mit diesen Regionen auf dem Chart können Sie das Konzept der Bipolarität nutzen, um sowohl bei der Verteidigung als auch beim Testen nach einem Ausbruch nach Trades zu suchen. Wen
FREE

Dieser einfache Indikator malt mit einer dunkleren Farbe auf dem Volumenbalken, wenn die gehandelte Menge über dem Durchschnitt der ausgewählten Anzahl von Perioden des Volumens selbst liegt, wodurch die Momente hervorgehoben werden, in denen es ein großes Volumen von Geschäften über dem Durchschnitt gab. Es ist auch möglich, eine Konfiguration von vier Farben zu verwenden, wobei der Farbton die Stärke des Kerzenvolumens anzeigt. Der Indikator ist standardmäßig auf den einfachen Durchschnitt vo
FREE

Der Indikator "Time Broker Deriv" wurde speziell für die synthetischen Indizes Boom und Crash sowie für andere auf der MT5-Plattform verfügbare Handelspaare entwickelt. Seine Hauptfunktion besteht darin, die Zeit des Brokers im Vergleich zu unserer Ortszeit anzuzeigen. Es ist wichtig zu beachten, dass der "Time Broker Deriv" Indikator nur die Zeit des Brokers anzeigt.
FREE

Der Indikator basiert auf der Methodik von Robert Miner, die er in seinem Buch "High probability trading strategies" beschrieben hat, und zeigt Signale zusammen mit dem Momentum von 2 Zeitrahmen an. Ein Stochastik-Oszillator wird als Momentum-Indikator verwendet.
Die Einstellungen sprechen für sich selbst Periode_1 ist der aktuelle Zeitrahmen, 'current' period_2 wird angezeigt - der übergeordnete Zeitrahmen ist 4 oder 5 Mal größer als der aktuelle Zeitrahmen. Wenn der aktuelle Zeitrahmen beisp
FREE

Der DFG-Chart-Indikator zeigt die historischen DFG-Niveaus an, die im DFG-Dashboard verwendet werden. Diese Niveaus werden dynamisch mithilfe von gleitenden Durchschnitten und Fibonacci-Verhältnissen generiert. Die Fibonacci-Bänder passen sich automatisch an, um Änderungen in der Preisspanne und der Trendrichtung widerzuspiegeln. Der Indikator verfügt außerdem über Schaltflächen zur Auswahl des Chart-Symbols und des Zeitrahmens sowie über eine breite Palette von Anpassungsoptionen. Hauptmerkmale
FREE

Einführung in den Fair Value Gap-Indikator : Ein einfaches und effektives Handelsinstrument Der Fair-Value-Gap-Indikator wurde entwickelt, um Händlern zu helfen, Fair-Value-Gaps (FVGs) leicht zu erkennen und in ihren Handelsstrategien zu nutzen. FVGs weisen auf Preisungleichgewichte hin, die der Markt häufig wieder aufgreift und die potenzielle Einstiegs- oder Ausstiegsmöglichkeiten bieten. Egal, ob Sie Anfänger oder erfahrener Händler sind, dieser Indikator vereinfacht das Erkennen dieser wert
FREE

Das Währungsmomentum hat viele Ähnlichkeiten mit dem auf der vorherigen Seite vorgestellten Währungsstärkemesser , aber die Unterschiede sind viel ausgeprägter. Sie können versuchen, beide in denselben Chart zu setzen und den Unterschied in den Ergebnissen zu sehen. Das Währungsstärkemomentum misst die Stärke einer Währung basierend auf (Sie ahnen es) ihrem Momentum relativ zu anderen Währungen, während das Währungsstärkemessgerät die Stärke einer Währung basierend auf den Pips misst , die sie i
FREE
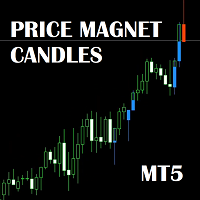
Der Indikator zeigt Kerzen an, die potenziell interessant für den Marktpreis sind. Durch das Beobachten dieser Kerzen können Sie abschätzen, wohin sich der Markt als Nächstes bewegen könnte. Die Idee ist völlig originell und eng mit dem Konzept des Smart Money verbunden. Funktionsweise:
Aktive Kerzen werden farblich hervorgehoben. Sie wirken wie Magnete für Market Maker, da sie noch Liquidität enthalten. Je nach Position relativ zum aktuellen Preis werden die Kerzen in Rot oder Blau dargestellt,
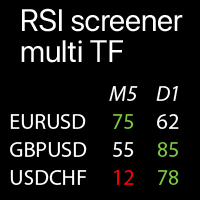
Multi-Timeframe RSI-Werte für ausgewählte Symbole: Vergleichen Sie aktuelle Markttrends Der Indikator zeigt RSI-Werte von allen ausgewählten Timeframes und Symbolen in einer einzigen Tabelle an, was eine schnelle Analyse der aktuellen Marktpreistrends ermöglicht.
Mein multifunktionales Tool : 66+ Funktionen | Kontaktieren Sie mich bei Fragen | MT4-Version Jedes Symbol kann angepasst werden: entfernt/ersetzt. Sie können bis zu 40 Symbole hinzufügen. Das Panel kann an jede Stelle des Ch

MT4-Version hier verfügbar: https://www.mql5.com/en/market/product/43438
Telegram-Kanal & Gruppe: https://t.me/bluedigitsfx
V.I.P Gruppen-Zugang: Zahlungsnachweis an unseren Posteingang senden
Empfohlener Broker: https://bit.ly/BlueDigitsFxStarTrader BlueDigitsFx Spike And Strike Reversal MT5 — Leistungsstarker Misch-Oszillator zur präzisen Erkennung von Marktumkehrungen BlueDigitsFx Spike And Strike Reversal ist ein zusammengesetzter Oszillator, der mehrere Indikatorsignale kombiniert, um Ih

Hochgradig konfigurierbarer Average True Range (ATR) Indikator.
Merkmale: Hochgradig anpassbare Alarmfunktionen (bei Levels, Kreuzen, Richtungsänderungen per E-Mail, Push, Sound, Popup) Multi-Timeframe-Fähigkeit Farbanpassung (bei Pegeln, Kreuzen, Richtungsänderungen) Optionen für lineare Interpolation und Histogramm-Modus Funktioniert im Strategie-Tester im Multi-Timeframe-Modus (auch am Wochenende ohne Ticks) Einstellbare Levels Parameter:
ATR-Zeitrahmen: Sie können den unteren/höheren Zeitr
FREE

Dieser Indikator ist ein sehr einfacher Indikator, der Candlesticks auf einem Chart zeichnet. Es ist jedoch möglich, nicht nur auf dem Hauptchart, sondern auch auf mehreren Untercharts zu zeichnen. Darüber hinaus ist es möglich, verschiedene Symbole und Zeitrahmen aus dem Hauptchart zu zeichnen. Merkmale. 1. beliebige Symbole 2. beliebige Zeitrahmen 3. zwei Kerzentypen (normal und Heikin Ashi) 4. viele Kerzenfarben (Schnittpunkt mit ma_1) 5. Pivot-Linie (ver1.2) Im Falle einer positiven Kerze, F
FREE

Nem Nem ist super genau mt5 Indikator ist es mit jedem Paar arbeiten jeden Zeitrahmen wird es zeigen, und bieten Ihnen mit hohen Winrate Signal können Sie für Forex-Paare, Gold und alle anderen Paare ist es einfach zu bedienen auch können Sie die weißen Linien für den Beginn und das Ende der Signale sehen es wird Ihnen helfen, das Diagramm zu lesen und geben und die richtigen Entscheidungen in Trades. auch wird es klar für Sie, wenn zu betreten und zu verlassen aus allen Geschäften
FREE

Der YK-SMART-EMA ist ein Indikator, der mehrere Exponential Moving Average (EMA)-Linien auf einem Preisdiagramm anzeigt, um die Analyse von Preistrends zu unterstützen. Dieser Indikator verfügt über fünf EMA-Linien: EMA14 (rote Linie): Wird auf der Grundlage der Schlusskurse der letzten 14 Kerzen berechnet. EMA30 (blaue Linie): Berechnet auf der Grundlage der Schlusskurse der letzten 30 Kerzen. EMA50 (grüne Linie): Berechnet auf der Grundlage der Schlusskurse der letzten 50 Kerzen. EMA100 (orang
FREE
RSI Trendline Breakout Pro RSI-Indikator mit automatischer Trendlinienerkennung und hochpräzisen Ausbruchssignalen.
Übersicht Verändern Sie Ihren Handel mit dem fortschrittlichsten RSI-Trendlinien-Ausbruchssystem, das auf dem Markt erhältlich ist. Dieser professionelle Indikator kombiniert eine hochentwickelte zonenbasierte Analyse mit einer automatischen Trendlinienerkennung, um hochpräzise Handelssignale zu liefern, die über alle Zeitrahmen und Marktbedingungen hinweg funktionieren. Hauptmerk

HTF PO3 Kerzen-Indikator Der HTF PO3 Kerzen-Indikator projiziert das „Power of Three“-Konzept eines höheren Zeitrahmens direkt auf deinen Chart, sodass du wichtige Strukturlevels und potenzielle Ein- und Ausstiegszonen im größeren Marktumfeld siehst, ohne den Timeframe zu wechseln.
Hauptmerkmale: 1. Überlagerung von Kerzen aus höherem Timeframe 2. Anpassbares Erscheinungsbild (gefüllt/hohl, Konturstil, Linienbreite, Farben) 3. Dynamische Timeframe-Auswahl: 1 Minute bis 1 Monat 4. Kompa

Der Ai-Trendspotter (D Originals).
Der Untergang von Forex.
Wir fragen oft: „Wie verdient man mit Brokerage Geld?“ und freuen uns über jeden kleinen erfolgreichen Trade.
Aber nachdem Sie (D Originals) verwendet haben, werden Sie sich fragen: „Wie bin ich über Nacht reich geworden?“.
So Deep, Action spricht mehr als Stimme.
Mit dem Ai Trend Spotter haben Sie keine Angst vor:
*Marktmanipulation
*Marktumkehr
* Scharfschützen-Eintritt und -Existenz
*Kerzensprung
Der Indikator gilt für
IQ Trade Status - Ein professionelles Handels-Panel, um alle Ihre LIVE-Trades in einem einzigen Dashboard zu verfolgen. IQ Trade Status ist nicht nur ein Handels-Panel, sondern ein professionelles Dashboard, das für MetaTrader entwickelt wurde. Es ersetzt das Standard-Terminal-Fenster durch einen übersichtlichen, strukturierten und umsetzbaren Überblick über Ihr Konto und Ihre offenen Trades.
Das Dashboard ist so konzipiert, dass es Ihnen hilft, drei wichtige Fragen sofort zu beantworten: Wie v

Es macht es einfacher zu sehen, wo es Konsolidierungszonen für frühere Kurse gab und ermöglicht es Ihnen, das Histogramm dort hervorzuheben, wo es die größte Konsolidierungszone gibt.
Input parameters Preisintervall (Intervalo de preço) Ist der Preis zwischen den Histogrammen
Zeitraum Anzahl der zu analysierenden Kerzenständer
Prozentsatz Hebt das Histogramm hervor, in dem es eine minimale Konsolidierung in Bezug auf den analysierten Zeitraum gibt
FREE

Wenn Sie nach einer Möglichkeit suchen, Ihre Handelsergebnisse zu verbessern, dann ist der VWAPiEagleVision Indikator genau das Richtige für Sie! Dieser Roboter ist so programmiert, dass er den VWAP in Echtzeit verfolgt und diese Informationen nutzt, um Trends und profitable Handelsmöglichkeiten zu erkennen.
Der VWAP (Volume Weighted Average Price, volumengewichteter Durchschnittspreis) ist ein Indikator, der von Händlern häufig verwendet wird, um den Durchschnittspreis gewichtet nach dem geha
FREE

Tokyo Session Box Indikator : Zeichnen Sie eine Box der Tokio-Sitzung. Eingaben Tutorial: 1. Automatisch: true/false. Um die Box automatisch auf Basis der GMT zu berechnen. 2. Zeitzone des Brokers: Wenn Automatic auf False steht, müssen Sie die Zeitzone des Brokers definieren (z.B. 2). 3. Eigenschaften der Schaltfläche ON/OFF: x, y, Ecke, Farbe, Hintergrundfüllung, Breite, Höhe, Schriftart und Schriftgröße. Mit dieser Schaltfläche können Sie das Tokio-Sitzungsfenster ein- und ausblenden.
FREE

Fraktale Volatilitätskarte - Hurst Heatmap (MT5) Fractal Volatility Map hebt die Volatilitätskompression vor der Expansion hervor. Sie zeichnet eine fünfzeilige Heatmap der Hurst-Metrik über mehrere Lookback-Fenster und bestätigt die Kompression mit einem ATR-basierten Quiet-Volatility-Check. Wenn sich mehrere Reihen in der Nähe des neutralen Bereichs befinden und die Volatilität unterdrückt wird, wird auf dem letzten geschlossenen Balken ein Kompressionssignal angezeigt. Dies ist ein Analyse-/
FREE

Meta Cipher B: Das All-in-One Oszillatorpaket für MT5 Meta Cipher B bringt das beliebte Konzept des Market Cipher B nach MetaTrader 5 – optimiert für Geschwindigkeit und Präzision. Von Grund auf für Leistung entwickelt, liefert es professionelle Handelssignale ohne Verzögerung oder langsames Scrollen. Obwohl es eigenständig sehr leistungsfähig ist, wurde Meta Cipher B so konzipiert, dass es sich natürlich mit Meta Cipher A kombinieren lässt, um ein vollständiges Marktbild und tiefere Bestätigung
Der MetaTrader Market ist die beste Plattform für den Verkauf von Handelsroboter und technischen Indikatoren.
Sie brauchen nur ein gefragtes Programm für die MetaTrader Plattform schreiben und schön gestalten sowie eine Beschreibung hinzufügen. Wir helfen Ihnen, das Produkt im Market Service zu veröffentlichen, wo Millionen von MetaTrader Benutzern es kaufen können. Konzentrieren Sie sich auf dem Wesentlichen - schreiben Sie Programme für Autotrading.
Sie verpassen Handelsmöglichkeiten:
- Freie Handelsapplikationen
- Über 8.000 Signale zum Kopieren
- Wirtschaftsnachrichten für die Lage an den Finanzmärkte
Registrierung
Einloggen
Wenn Sie kein Benutzerkonto haben, registrieren Sie sich
Erlauben Sie die Verwendung von Cookies, um sich auf der Website MQL5.com anzumelden.
Bitte aktivieren Sie die notwendige Einstellung in Ihrem Browser, da Sie sich sonst nicht einloggen können.