Trail Stops Point
- Indicadores
- Versión: 1.10
- Actualizado: 26 abril 2023

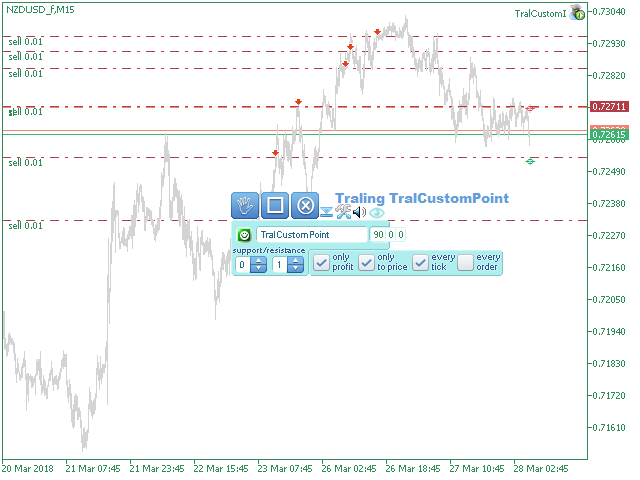
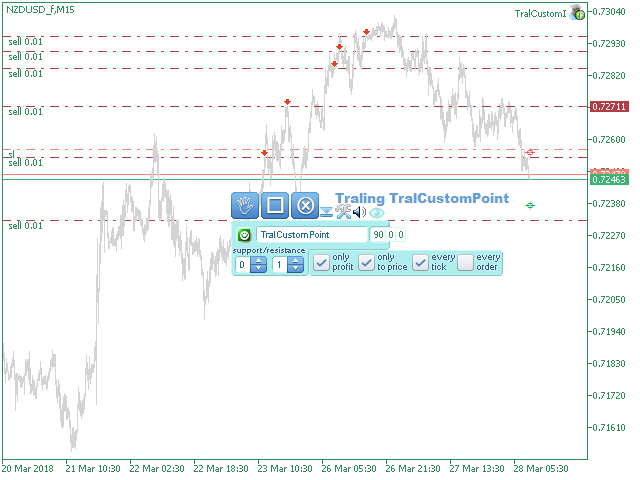
El indicador Trail Stops Point muestra la desviación del precio actual en una distancia determinada.
Ha sido desarrollado como un indicador adicional para Trail Stops por Custom Indicator, para proporcionar un simple seguimiento de una posición stop loss a una distancia especificada en puntos.
Parámetros del indicador
- Distancia - distancia del trailing stop en puntos.
Números de tope: 0 - Soporte, 1 - Resistencia.


very useful