
Custom Panel
- Indicadores
-
Marcin Konieczny
 Marcin Konieczny - Soft4FX
High-quality trading solutions for Metatrader 4
Indicators, simulators, scripts and more...
http://soft4fx.com - Versión: 1.2
- Actualizado: 7 noviembre 2018
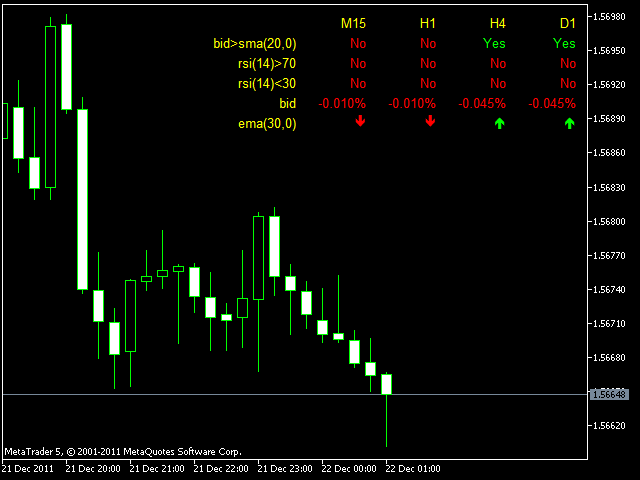
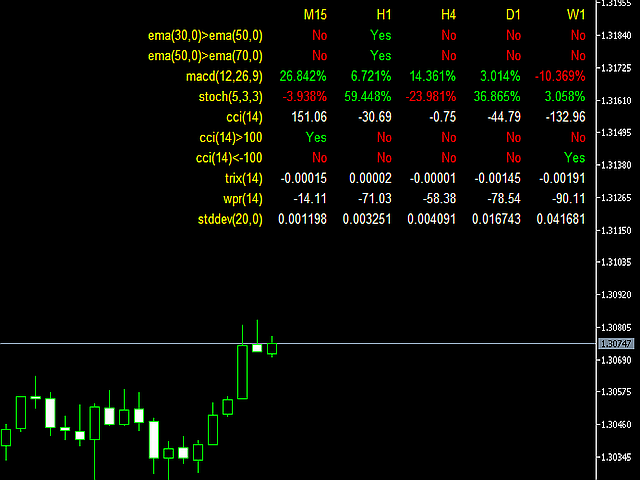
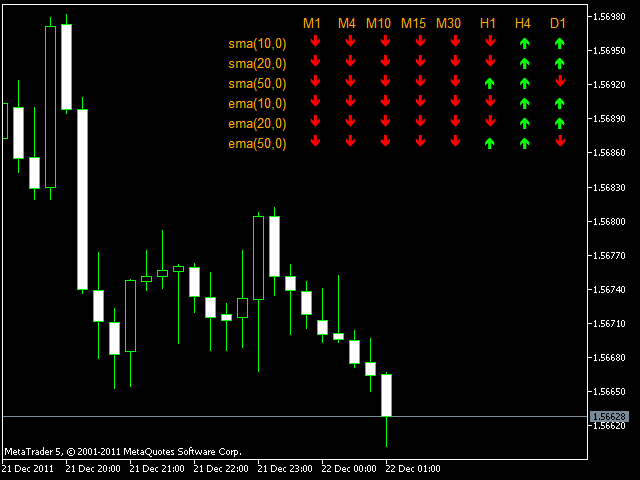
El panel personalizado le permite recopilar todo tipo de información importante y mostrarla en una práctica tabla en la esquina superior derecha del gráfico.
Usted mismo puede elegir el contenido del panel. Cada fila mostrará su propia condición o valor personalizado. Cada columna muestra un marco temporal diferente. El panel puede contener hasta 10 filas y 8 columnas.
Ejemplo de uso
Fila: Precio > EMA(30)
Modo: SI_NO
Significado: ¿Está el precio actual por encima de EMA(30)?
Fila: Ask < Bandas[L]
Modo: SI_NO
Significado: ¿Está el precio actual por debajo de la banda inferior de Bollinger?
Fila: CCI(16)
Modo: PORCENTAJE
Significado: ¿Cuál es el porcentaje de cambio del CCI(16) desde el cierre de la barra anterior?
Fila: MACD[S](12,20,10)
Modo: ARROWS FLECHAS
Significado: La línea de señal MACD(12,20,10) está subiendo o bajando.
Fila: Stoch[M] > Stoch[S]
Modo: SI_NO
Significado: ¿está la línea principal estocástica por encima de la línea de señal estocástica?
Fila: Bid
Modo: CAMBIO
Significado: ¿Cuál es el cambio en el precio de oferta desde el cierre de la barra anterior?
Información detallada
Cada fila del panel puede trabajar en uno de 5 modos:
- SÍ_NO - mostrando SÍ o NO basándose en su condición personalizada (por ejemplo, Precio > SMA(30), RSI(14) < 30, EMA(5) > EMA(10), ...). Puede utilizar los operadores '<', '>' y '='.
- VALOR - muestra simplemente el valor actual de un indicador o del precio actual
- CAMBIO - muestra el cambio del precio o del valor del indicador entre la barra
- anterior y la actualPORCENTO - igual que en el modo CAMBIO, pero mostrado como porcentaje
- FLECHAS - igual que en el modo CAMBIO, pero sólo se muestra la flecha hacia arriba o hacia abajo
En el modo SÍ_NO debe utilizarse exactamente un operador (<,>,=). En todos los demás modos los operadores están prohibidos.
El panel soporta los siguientes indicadores incorporados:
- Medias móviles(SMA, EMA, SMMA y LWMA)
- Índice de fuerza relativa (RSI)
- Índice del canal de materias primas (CCI)
- MACD
- Oscilador estocástico (Stoch)
- SAR parabólico
- Rango porcentual Williams (WPR, %R)
- Media exponencial triple (TRIX)
- Bandas de Bollinger
- Desviación estándar (StdDev)
- Rango Medio Real (ATR)
- Oscilador de Momento (MOM)
- Índice de Vigor Relativo (RVI)
- Índice de movimiento direccional medio (ADX)
El panel sólo reconoce las siguientes funciones. Las mayúsculas y minúsculas son indiferentes. Los parámetros suministrados entre paréntesis pueden omitirse. Los parámetros no especificados se ajustarán a los valores por defecto. Por ejemplo, es posible especificar sólo el primero o el primero y el segundo o los tres o ninguno.
- P o PRICE o BID -> muestra el precio de oferta
- ASK -> muestra el precio de venta
- cualquier número, por ejemplo 20, 1.4506, -100, ...
- CCI(periodo)
- RSI(periodo)
- MACD(fast ema, slow ema, macd ema) -> muestra la línea principal del MACD
- MACD[M](fast ema, slow ema, macd ema) -> muestra la línea principal MACD
- MACD[S](fast ema, slow ema, macd ema) -> muestra la línea de señal MACD
- MA(period, shift) -> muestra SMA por defecto
- SMA(period, shift)
- EMA(period, shift)
- SMMA(period, shift)
- LWMA(periodo, desplazamiento)
- STOCH(%K, %D, desaceleración) -> muestra la línea principal estocástica
- STOCH[M](%K, %D, desaceleración) -> muestra la línea estocástica principal
- STOCH[S](%K, %D, desaceleración) -> muestra la línea de señal estocástica
- SAR(paso, máximo) o PSAR(paso, máximo) -> muestra el SAR Parabólico
- WPR(periodo) o %R(periodo)
- TRIX(periodo)
- BANDS[U](periodo, desplazamiento, desviación) o BB[U](periodo, desplazamiento, desviación) -> muestra la banda superior de Bollinger
- BANDS[L](period, shift, deviation) or BB[L](period, shift, deviation) -> muestra la banda inferior de Bollinger
- STDDEV(periodo, desplazamiento) o DEV(periodo, desplazamiento)
- ATR(periodo)
- MOM(periodo)
- RVI(period) o RVI[M](period) -> muestra la línea principal del RVI
- RVI[S](period) -> muestra la línea de señal RVI
- ADX(period) -> muestra la línea principal ADX
- ADX[DI+](period) -> muestra la línea DI+
- ADX[DI-](period) -> muestra la línea DI-


I just love it! Simple to configure, very versatile, small size. Great work! Thanks