YouTubeにあるマーケットチュートリアルビデオをご覧ください
ロボットや指標を購入する
仮想ホスティングで
EAを実行
EAを実行
ロボットや指標を購入前にテストする
マーケットで収入を得る
販売のためにプロダクトをプレゼンテーションする方法
MetaTrader 5のためのテクニカル指標 - 38

本製品はインジケーター/シグナルツールから情報を受信し、特定の条件が満たされた場合に矢印や通知を表示します。
たとえば、MA25 と MA50 がクロスしたとき、SAR が反転したとき、MACD プラスマイナスが変化したとき、終値がボリンジャーバンドをクロスしたときなどに矢印が表示され、通知されます。
具体的な設定についてはサンプル設定画像をご参照ください。
詳細なマニュアルと設定ファイル: https://www.mql5.com/en/blogs/post/755082
様々な設定で矢印を表示させることができ、アイデア次第で組み合わせも無限です。 シグナルツール やインディケーターと連携する設定方法が分からない場合は、サポートしますのでご連絡下さい。
個別でご依頼いただければ、スマホへのプッシュ、メール、Slack、Line、Discord通知などへの通知、パラメタの8個まで追加、または個別でインディケータとの連携なども対応します。 お手持ちのシグナルツールの補助として、またイベントの通知機能としてもお使い頂けます。 https://www.mql5.com/en/us
FREE

StrikeZone Macd Atr is an advanced volatility-adaptive oscillator that scales the traditional MACD using ATR.
This approach solves the common problem of conventional MACD: it does not react properly to changing volatility.
With ATR scaling, momentum becomes clearer, smoother, and more meaningful across all market conditions. Key Features 1. ATR-Scaled MACD Oscillator The indicator adjusts (MACD – Signal) by ATR ratio, allowing: Reduced noise during high-volatility periods Enhanced sensitivity du
FREE

!!!This Free Version just works on EURUSD!!! Wa Previous Candle Levels MT5 shows the previous candle levels, it shows the previous candle Open High Low Close levels (OHLC Levels) in different time frame. It's designed to help the trader to analyse the market and pay attention to the previous candle levels in different time frame. We all know that the OHLC Levels in Monthly, Weekly and Daily are really strong and must of the time, the price strongly reacts at those levels. In the technical anal
FREE

主要城市的时间。北京时间、东京时间、悉尼时间、惠灵顿时间、纽约时间、法兰克福时间、伦敦时间、迪拜时间。 城市时间可选择开启或者关闭。 点差变色提醒。设置点差提醒点数,例如,设置100点,点差大于100点,文字会变红色。 Time in major cities. Beijing time, Tokyo time, Sydney time, Wellington time, New York time, Frankfurt time, London time, Dubai time. City time can be turned on or off. Dot difference color change reminder. Set the point difference reminder points. For example, set 100 points. If the point difference is greater than 100 points, the text will turn red.
FREE

I present the well-known Fractal indicator.
Levels have been added to this indicator.
At the extreme points, you can see the continuation of the price line, which changes when the values of the Fractal indicator change.
The indicator is easy to use. The basic Fractal settings have been saved.
FractalLevels Parameters:
LeftBars - the number of bars on the left
RightBars - the number of bars on the right
FREE
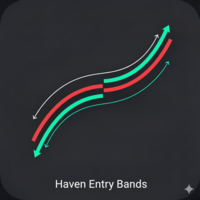
Haven Entry Bands - 正確なマーケットエントリーへのナビゲーター ご紹介します、 Haven Entry Bands – これは単なるチャート上の線ではなく、トレンドを特定し、確率の高いエントリーポイントを見つけるための包括的なシステムです。このインジケーターは、平滑化された価格アクションと適応型ボラティリティの組み合わせに基づいており、フィボナッチ比率に基づいた動的なサポートおよびレジスタンスレベルを構築します。 他の製品はこちら -> こちら . どこでエントリーすべきか推測するのはもうやめましょう。Haven Entry Bandsは、買い手と売り手のどちらが市場を支配しているかを自動的に判断し、取引を開始するための重要なゾーンをハイライト表示します。これにより、最も重要な「情報に基づいた意思決定」に集中する時間を確保できます。 インジケーターの主要なシグナル このインジケーターは、それぞれが特定の目的を持つ3種類のシグナルを生成します: エントリーシグナル (Entry Signals) – ベースラインの方向が転換し、新しいトレンドが発生するまさにその瞬間

Indicator measures strength of each currency in your list.
Main idea: It simply iterates through all combinations of pairs and adds difference between open and close in percent. Parameters: List of currencies - what currencies will be calculated (maximum is 8) Calculation type - from which data will be strength calculated Calculation data input - used as input related to calculation type Symbol suffix - used in case of suffix on symbols, e.g: when your symbols look like EURUSDm, EURUSDmicro etc
FREE

This spread indicator displays the actual spread of each candle. It highlights the maximum spread and the minimum spread of the chosen symbol. This indicator is very helpful to see in real time the spread evolution helping to avoid taking a trade when the spread is too high.
Inputs:
Print value in Points: if true displays the spread as a whole number
D isplay minimum and maximum spread of the past N days: select the number of days to consider the maximum and minimum spread
Automatically adj
FREE

シンプル、直接的、そして効率的 — それが Bars Trend and Pivot Support の真髄です。
このシステムを使用すると、グラフ上での分析を容易にする直感的なツールを利用できます。選択した期間に基づいて重要なサポートとレジスタンスを自動的にマークし、ピボット ラインを強調表示します。これらはすべて、ユーザーの好みに応じて有効化および無効化のオプションを備えています。
ダッシュボードには、D1、H4、H1、M30 の時間枠でのローソク足の方向も明確に表示され、さまざまな取引アプローチに不可欠な戦略的洞察が提供されます。
さらに、システムは現在のスプレッドと次のローソク足の形成までの残り時間を実用的な方法でチャートに統合して通知します。
私のメインインジケーター「ブルートフォーストレンド」と一緒に使用してください: https://www.mql5.com/en/market/product/132647?source=Site +Market+My+Products+Page
FREE

Esse indicador é a combinação do RSI (IFR) com Média Móvel Simples aplicada o RSI em um único indicador para facilitar a criação de alguma estratégia. Fiz esse indicador para que um único indicador contenha os buffer necessários para implementar alguma EA.
Descrição dos Buffers para o EA,
Buffer 0 -> Valor do RSI Buffer 1 -> Valor da média móvel aplicada ao RSI
FREE

SuperTrend Indicator – Description & Important Notice The SuperTrend is a composite technical indicator designed to help you identify the primary trend, measure its strength, and assess signal quality. However, an indicator is only a tool —it’s never 100% accurate and cannot replace sound risk management. 1. Core Formula & Components ATR (Average True Range): measures price volatility; customize sensitivity via Periods and Multiplier . Upper/Lower Bands: derived from ATR and your chosen source p
FREE

INDICATOR: GEN RSI Hunter Developer: gedeegi General Description GEN RSI Hunter is a technical indicator based on the Relative Strength Index (RSI) that automatically detects potential BUY and SELL signals based on overbought/oversold conditions and price reversal patterns. This indicator is perfect for traders who want to capture short-term swing opportunities using price action confirmation and price patterns like Double Top and Double Bottom. Signals are confirmed by breakout candles and val
FREE

FREE

RQL Trend Board – Description RQL Trend Board is a simple but powerful multi-timeframe trend dashboard.
It shows the current market bias across several timeframes at the same time, using an internal trend-classification method. Each timeframe is displayed as a colored box: Green – bullish bias → look for long setups
Yellow – ranging / unclear → no trade zone
Red – bearish bias → look for short setups The indicator gives a clear overall picture of where the market wants to go, instead o
FREE
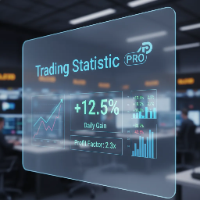
The statistical indicator for the metatrader 5 TradingStatisticPro collects statistical data on your trade, which makes it easier to assess the effectiveness of trading, the profit received and the risks. The indicator is compactly placed in the corner of the main chart of the terminal and displays the following information: 1. The profit earned. 2. Maximum drawdown. 3. The recovery factor. 4. Profit factor. 5. The ratio of profitable and unprofitable transactions (winrate). 6. Average profit a
FREE

https://www.mql5.com A double moving average indicator This indicator uses the system's own two different time period of moving average indicators to reflect the movement of market prices. It is recommended that you use the default parameter Settings, which you can set according to your own experience to get the best predictive power. I hope it can provide some help for your trading.
FREE

ATR Bands with Take-Profit Zones for MT5 Optimize your risk management and trading strategy with the ATR Bands indicator for MT5 – a powerful tool designed to help you navigate market volatility, identify key price levels, and set realistic stop-loss and take-profit targets. Key Features: ATR-Based Bands : The core of this indicator relies on the Average True Range (ATR) to calculate dynamic upper and lower bands that adapt to market volatility. The bands provide a clear indication of potential
FREE

Market Time Watch A clean, lightweight and essential time-tracking tool for every trader Market Time Watch is a professional on-chart time display designed for traders who need an accurate real-time clock and precise candle timing while analyzing the markets. This tool helps you instantly see current local time , server time , and candle countdown directly on your chart without any clutter or heavy UI components. Whether you scalp fast markets, swing-trade sessions, or simply need a clean time r
FREE

The Cossover MA Histogram indicator is a simple tool showing the trend based on crossover of moving averages. Simply specify two mobving averages and addicional parameters like MA method and Applied price. When fast MA is above slow MA the histogram is green, indicating an uptrend. When MA fast is below MA slow the histogram is red, indicating an downtrend.
FREE

This creative simple indicator will provide a precise framework for market sentiment within technical analysis of different timeframes. For instance, for traders like me that uses "Mark Fisher" strategy regularly, this is a perfect indicator for having an insight to markets from short term to long term point of view, using Break points of candles' lows and highs and perfect to combine with "Price Action" . For more options and modifications you can also edit the low timeframe candles withi
FREE

This is a multi frame stochastic indicator, you can attach any time frame of stoch indicator on one chart. It is very useful if you like to check multi time frame stoch data. If you are interested in EA,click below links to take a look: https://www.mql5.com/en/market/product/80170 https://www.mql5.com/en/market/product/81136
How to use: > Atach the first time frame you want on to the currency pair's chart > Atach the second time frame you want on to the currency pair's chart > Atach the third
FREE

ATR is a measure of volatility introduced by market technician J. Welles Wilder Jr. in his book, "New Concepts in Technical Trading Systems". In general, traders are accustomed to seeing the ATR in the form of a sub-window indicator. What I am presenting here is a simplified version of ATR - just the current ATR number - very useful for monitoring just the very moment of the current chart. If you want to monitor several timeframes in the same chart, just add the ATR Monitor indicator several tim
FREE
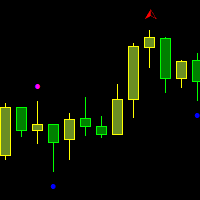
The indicator draws two types of Bill Williams' fractals: Broken fractals – the price has been at least once above or below these fractals. Unbroken fractals – new fractals where the price has not yet moved above or below them. You can configure the color of the fractals, as well as the number of bars used for the indicator's display.
фрактал Вильямса фрактал БВ фракталы Вильямса пробой фрактала пробитый фрактал Торговый хаос broken fractal unbroken fractal Williams fractal Trading Haos Bi
FREE

This indicator provides common shapes as drawing object options. The shapes are rotatable, resizable, draggable, and will keep their proportions (according to their handle trendline) across different chart scales. Multiple drawings are supported.
Shapes: Square Rhombus
Triangle (quadrilateral & isosceles) Circle (grid, overlapped grid, flexi grid, rotatable grid, concentric circles) Features: rays (all object edges will be rays) show/hide each individual drawing type, or all delete last drawn ob
FREE

SAM Waves PRO – Professional Signal Indicator for Day Trading SAM Waves PRO is the extended version of the popular SAM Waves indicator, designed specifically for disciplined intraday Forex traders. It includes real-time notifications via push, email, and sound alerts, ensuring you never miss a qualified trading signal. Backtested on over 5.5 years of historical data, the strategy has achieved a consistent win rate above 60 percent when traded using a fixed stop loss and take profit between 20 an

The indicator shows Jake Bernstein's MAC (Moving Average Channel) System signals ---------------------------------------- System assumes several types of entering in trade, in this indicator only one type implemented - on closing of second trigger bar. It is recommended to start using this indicator together with Jake Bernstein's free lessons https://www.youtube.com/@JakeatMBH/videos Arrow shows signal bar - enter on closing or on opening of the next bar, cross - stop level, dot - minimum profi
FREE

This multi indicator/oscillator (hereafter indicator), multi time frame and multi symbol indicator identifies when a divergence occurs between price and one, two or three indicators. It identifies both regular/classical (trend reversal) and hidden (trend continuation) divergences. It has RSI and MA trend filter options which makes it possible to filter out only the strongest setups. Combined with your own rules and techniques, this indicator will allow you to create (or enhance) your own powerfu

SilverTrend Signal Indicator (v4.0) Brief Description
The SilverTrend_Signal is a versatile, trend-following technical analysis indicator designed for MetaTrader 5. It identifies potential market reversal points by analyzing price action within a dynamic volatility-based channel. The indicator plots clear buy (up arrow) and sell (down arrow) signals directly on the chart and provides customizable audio/visual alerts to notify traders of new trading opportunities; helping traders quickly sp
FREE

Haven QQE PRO - 全ての時間足におけるトレンドのビジュアルガイド Haven QQE PRO をご紹介します。これはQQEアルゴリズムをベースにした実用的なツールで、トレーダーの主要な課題である「現在のトレンドを迅速に特定し、その方向に沿って取引する」を解決するために作られました。このインジケーターは、複数の時間足のデータを一度に分析し、市場を支配しているのが買い手か売り手かを明確に示します。 その他の製品 -> こちら . チャートを切り替える必要はもうありません。意思決定に必要なすべての情報が1か所に集約されています。 具体的にどのようなシグナルを受け取れますか? このインジケーターは、連携して機能する3種類のビジュアルシグナルを提供します: マルチタイムフレーム・ダッシュボード(パネル)
これがあなたの主要な指針です。チャートの隅にあるパネルが、すべての主要な時間足(例:M5、M15、H1、H4)のトレンド状況( Bullish, Bearish, Sideways )を表示します。これにより、全体像を瞬時に把握できます。 サブウィンドウのヒストグラム

This indicator is designed according to the combination of WPR and Stoch indicators, when WPR goes up and Stoc goes up quickly too, the price may meet strong resistance, many times short order will take profit, but if the price break through it, Long positions are more likely to be profitable, and the reverse held true as well. You can adjust the parameters of WPR and Stoc to Adapt the symbol you operate. Click here to look the advanced edition: https://www.mql5.com/en/market/pro
FREE

The indicator measures the frequency of incoming ticks to analyze the market activity. Bullish and bearish ticks are analyzed separately, informing about the currently predominant market sentiment. According to observations, an increase in the frequency of ticks (panic) indicates the beginning of strong price changes, and an increase in the frequency of ticks in a particular direction not only accompanies a price change in this direction, but also often anticipates it. The indicator is indispens
FREE

Mystic Pulse V2.0 is a trend-strength indicator built on the Directional Movement System (DI+ / DI−). It counts how many consecutive candles show increasing bullish or bearish momentum. Rising DI+ builds a Positive Count (uptrend pressure), while rising DI− builds a Negative Count (downtrend pressure). These counts reset when momentum weakens, giving a clear visual view of trend persistence and potential reversals. This MQL5 version is a conversion of the original TradingView script by chervolin
FREE

This project did not reach the basic funding number, so I am abandoning it momentarily. The system is now free for other traders to continue the idea. You can follow my new project through my signals.
A tool for institutional investor, now avaliable for Home users. We equip you like banks equip their analysts!
How it works
Focused on the Forex market, it takes advantage of the need of nations to control the value of their currency and the world exchange variations to analyze, through the pro
FREE

PRO VERSION https://www.mql5.com/en/market/product/144989?source=Site https://www.mql5.com/en/users/gedeegi/seller GEN Support & Resistance (EGGII77) is an MT5 indicator that automatically detects and draws Support & Resistance levels based on pivot highs and lows. The indicator features two sets of S&R (main structure and quick levels), a customizable maximum number of lines, adjustable colors, and a clean chart display for clearer price action analysis.
FREE

The DFG Chart Indicator displays the historical DFG levels used in the DFG dashboard. These levels are generated dynamically using moving averages and Fibonacci ratios. The Fibonacci Bands automatically adjust to reflect changes in the price range and trend direction. The indicator also features buttons for selecting chart symbol and timeframe, along with a wide range of customization options. Key Features Dynamic DFG Levels
Automatically calculated using moving averages and Fibonacci ratios. H
FREE
Eight indicator for 3 day/session/week setups. Check out our other products for fxer.net:
https://www.mql5.com/en/market/product/114888
https://www.mql5.com/en/market/product/114890
Indicator daily features: Daily close/high/low Weekly open/high/low/close Tokyo/London/New York sessions Alerts Signals and alerts for First Green days First Red days Inside days Outside days 3x days of breakout up 3x days of breakouts down Do not be stupid and take every signal. Learn 3day setups first.
FREE

ATR Candles (Average True Range as OHLC candles) ATR Candles visualizes Average True Range (ATR) in a separate subwindow using candlestick-style OHLC bars . Each candle represents the change in ATR from the previous bar, making it easy to see volatility expansion and contraction over time. Key features: ATR shown as OHLC candles (open = previous ATR, close = current ATR) Input: ATR period Two color modes : Match price candle direction (bull/bear) Independent: green/red based on current ATR close
FREE

The Andean Oscillator is a powerful momentum-based indicator designed to help traders identify trends, reversals, and market strength with high precision. Inspired by traditional oscillators like the MACD and RSI, this unique tool smooths out price fluctuations and provides clearer signals for both entry and exit points.
Key Features: • Momentum & Trend Detection – Helps traders spot bullish and bearish momentum shifts early. • Smoothed Oscillator – Reduces noise and provides more reliable t
FREE

VR Pivot - これは、主要なピボットポイント(pivot)の指標です。 ピボットポイントは、最強の価格帯を識別するために使用される特別なタイプのサポートレベル(support)と抵抗(resistance)です。プロのトレーダーは、価格の反転の高い確率がある価格を決定するために逆転のポイントを使用します.レベルは、特別な数式に従って計算され、終了、開口部、最大、前の期間の最小値の価格が考慮されます。最も効果的なのは、毎日の期間です。一見すると、これらのレベルに特別なものは何もないと思われるかもしれませんが、ピボットポイントのレベルの助けを借りて価格の動きを分析すると、ほとんどの場合、これらのレベルが良好で正確な結果を示していることがわかります。 テクニカルサポート、設定およびソフトウェアの体験版は、作者のプロファイルによりリクエスト できます。 逆転ポイントは、ピボットポイントとしてだけでなく、最大利益のために可能な限り効率的に使用できるレベルとして使用することができます, 損失を最小限に抑えるために損失を停止, リスクを軽減するために、損失ゾーンにポジションを転送. インジケ

This is an ordinary MACD indicator displayed in the main window according to the selected chart style, i.e. Bars, Candlesticks or Line. When you switch the chart type, the indicator display also changes. Unfortunately I could not improve the chart type switching speed. After switching, there are delays before the arrival of a new tick.
The indicator parameters Fast EMA period Slow EMA period Signal SMA period Applied price
FREE

Fractals ST Patterns Strategy is a modification of Bill Williams' Fractals indicator. It allows setting any number of bars to find a fractal. This simple indicator corresponds to the parameters specified in the ST Patterns Strategy ( https://stpatterns.com/ ) . Structural Target Patterns are essentially the market itself, which is consistently divided into components. To form ST Patterns , no trend lines, geometric proportions of the model itself, trading volume or open market interest are neede
FREE

Lot Size Calculator – ロットサイズ計算ツール このインディケーターは、選択したリスク%とストップロス幅に基づいてロットサイズを計算します。FX、金属、株価指数、商品、暗号資産に対応しています。
主な機能 残高とリスク%に基づいたロットサイズ計算 成行注文と指値注文に対応 チャート上の視覚的ライン:エントリー、ストップロス、テイクプロフィット リスクリワード比の表示 ストップロス距離に応じた自動ロット調整 チャート上に損益を表示
使用方法 チャートにインディケーターを追加 設定でリスク%を選択 成行注文または指値注文を選択 エントリー、ストップロス、テイクプロフィットラインを調整 計算されたロットサイズで注文を実行
パラメータ リスク%: 0.1% ~ 100% 計算方法: 残高に対するリスク% 表示内容: エントリー、ストップロス、テイクプロフィットと損益

The best and the only World Time Display for MT5
Features :
- JAPAN, LONDON & NEW YORK Time Display
- You can customize with different Font, Color And Text Size
- You can customize Box Position and Box Color to meet your satisfaction
- Only For Metatrader 5
- Customize GMT according to your Time Zone
- Simple To Use. Just Attach to your MT5
- No hidden code or no errors
FREE

Haven Market Session Time PRO – your reliable assistant for market session and news analysis. This compact indicator keeps you informed about key trading sessions and important news events directly on the chart. Customize the display of the sessions you need – Asia, London, US, and other regions. The indicator automatically highlights activity periods, showing the start and end times of each session. You'll receive alerts about upcoming high-impact economic calendar events. A convenient panel in

Probability emerges to record higher prices when MACD breaks out oscillator historical resistance level. It's strongly encouraged to confirm price breakout with oscillator breakout since they have comparable effects to price breaking support and resistance levels; surely, short trades will have the same perception. As advantage, many times oscillator breakout precedes price breakout as early alert to upcoming event as illustrated by 2nd & 3rd screenshot. Furthermore, divergence is confirmed in c
FREE

This is an extremely clean, efficient, and well-designed CBDR engine.
Calculates ICT’s Central Bank Dealers Range (CBDR) Using only candle bodies — NOT wicks (open–close structure).
For a defined time window (e.g., 00:00–05:00 New York).
For each past day and also for today in real time. Draws the following on chart: A rectangle showing the entire CBDR body range The CBDR High line (body top) The CBDR Low line (body bottom) An optional midline A pip label showing total CBDR size Optional extens
FREE

Delta Single Volume is a very powerful indicator that reads the supply on the Market.
It calculates the Delta from movement of the price and the difference of BUY and SELL volumes. Its special structure allows you to get all timeframe values available on the MT5 platform. It works on Tick Volumes and Real Volumes (if avalaibles on your Broker). A good observation of this instrument can suggest great entry points and possible reversal. We are confident that this tool will help you to improve you

Highly configurable Demarker indicator.
Features: Highly customizable alert functions (at levels, crosses, direction changes via email, push, sound, popup) Multi timeframe ability Color customization (at levels, crosses, direction changes) Linear interpolation and histogram mode options Works on strategy tester in multi timeframe mode (at weekend without ticks also) Adjustable Levels Parameters:
Demarker Timeframe: You can set the lower/higher timeframes for Demarker. Demarker Bar Shift: Y ou
FREE

The Supertrend Indicator for MT5 is a powerful trend-following tool designed to help traders identify market direction with precision. Based on the Average True Range (ATR), it dynamically adjusts to price movements, making it suitable for various trading styles, including scalping, day trading, and swing trading.
Key Features: • Accurate Trend Detection – Clearly identifies bullish and bearish trends with a color-coded trend line. • ATR-Based Volatility Adjustment – Adapts to market conditi
FREE

The Relative Equilibrium index (REi) is a technical analysis indicator that shows the direction and strength of a trend and indicates the probability of its change. It shows the ratio of the average price increase to the average fall over a certain period of time. The value of the index allows you to assess whether buyers or sellers had a stronger influence on the price over a set period of time and to assume further developments. The indicator is characterized by simplicity of interpretation an
FREE

The concept is simple: Plotting Price behavior within several periods of time. Some Symbols behave very well during the trading day - with this I mean Intraday trading - and this behavior ends up plotting effectively well with the proposed Exponential Moving Averages in this indicator... Obviously that this behavior could not be seen in all Symbols, but you can give it a try... Just drop this indicator in a chart and you will see for yourself...
This indicator is intended for "Feeling the Trend"
FREE

時間を節約し、より正確な意思決定を Sweet VWAP で このツールのパワーをテストしたい場合、 MetaTrader 5 用の無料のアンカード VWAP インディケーター をダウンロードできます。 このインディケーターは独立して動作するだけでなく、無料版 Sweet VWAP の拡張機能でもあります。 無料版をクリックすると、マウスポインターで見える VWAP が固定されます。そして、固定されるのはこのインディケーターであり、その機能をすべて備えています。 このインディケーターは Sweet VWAP と完全に統合されています。これは MetaTrader 5 用の無料のアンカード VWAP インディケーターです。 機能 アンカーする時間 これは VWAP をアンカーしたいローソク足です。これは Sweet VWAP(無料版)が自動的に行います。チャートでクリックするだけです。 取引量の種類 取引量の種類を選択するか、自動にしておくことができます。自動の場合、ブローカーがこの情報を提供している場合、取引アセットの実際の取引量を優先して使用します。 VWAP の平滑化メソッド 単純

SuperTrend Pro – Advanced Trend Detection Indicator (MT5) SuperTrend Pro is a modern, optimized trend-following indicator for MetaTrader 5 , designed to deliver clear trend direction, precise market structure, and a premium visual trading experience . It is based on an enhanced ATR-powered SuperTrend algorithm , combined with smart visuals, chart styling, and a real-time information panel. -Key Features - Advanced SuperTrend Logic Uses ATR (Average True Range) with adjustable Period and Multipli
FREE

This multi-timeframe indicator identifies the market's tendency to trade within a narrow price band. [ Installation Guide | Update Guide | Troubleshooting | FAQ | All Products ]
It is easy to understand Finds overbought and oversold situations Draws at bar closing and does not backpaint The calculation timeframe is customizable The red line is the overbought price The green line is the oversold price It has straightforward trading implications. Look for buying opportunities when the market is o
FREE

Trend Everest MT5 indicator is a trend following indicator that aids in decision making. It is based on the calculation of ATR that assist and the average hull. A key issue is that the Trend Everest MT5 nominee does not repaint, so you can backtest with greater confidence. When it is Green, UpTrend When it is a Red downtrend. Not that the Market is fractal, so the longer the graphic time, the greater its degree of assertiveness.

Supply Demand Ribbon is an indicator with moving supply and demand lines that help you identify price zones more easily. The indicator helps you determine flexible entry, stop loss, and take profit areas. There are also strategies for algorithmically changing ribbon colors. From there you can come up with many trading strategies for yourself! You can explore many feature in Advanced version here !
MT4 Version: Click here! You can combine it with our indicators below to make your trading
FREE

The Magic EMA indicator is of great help in determining trend direction. It can be an excellent addition to your existing strategy or the basis of a new one. We humans can make better decisions when we see better visually. So we designed it to show a different color for rising and falling trends. Everyone can customize this in the way that suits them best. By setting the Trend Period, we can optimize it for longer or shorter trends for our strategy. It is great for all time frames.
IF YOU NEED
FREE

Wikirobo | Smart Entry Zone Indicator for All Timeframes Wikirobo is a powerful indicator that automatically highlights potential entry zones as Buy Limit and Sell Limit orders across all timeframes. Highlights Suggested entry zones for every timeframe ️ Clear, timeframe-specific Stop Loss levels shown on the chart for better risk management and position sizing Suitable for scalpers, day traders, and swing traders —flexible for any trading style How to Use Instea
FREE

El indicador "Time Broker Deriv" está diseñado específicamente para su uso en los índices sintéticos Boom y Crash, así como en otros pares de trading disponibles en la plataforma MT5. Su función principal es proporcionar la hora del broker en comparación con nuestra hora local. Es importante destacar que el indicador "Time Broker Deriv" solo muestra la hora del broker.
FREE

Индикатор PivotPointSuperTrend отлично показывает данные Тренд на основе мат данных от Pivot и ATR и очень удобен для входа в сделку и выставления стопов. Если кто то сможет добавить в код мултитаймфрем, я и многие пользователи будут очень Благодарны, то есть чтобы ондикатор показывал значение старшего таймафрема на графике младшего таймфрема, Заранее Спасибо!
FREE

The indicator is based on Robert Miner's methodology described in his book "High probability trading strategies" and displays signals along with momentum of 2 timeframes. A Stochastic oscillator is used as a momentum indicator.
The settings speak for themselves period_1 is the current timeframe, 'current' period_2 is indicated - the senior timeframe is 4 or 5 times larger than the current one. For example, if the current one is 5 minutes, then the older one will be 20 minutes The rest of the s
FREE

製品概要 本製品はMT5用インジケータであり、MT5に内蔵されてるフラクタルインジケータに改良を加えたも のです。 フラクタルインジケータは標準でMT5に搭載されていますが、計算期間が「5」に固定されており変更することができません。
そこで、いくつかの機能を追加したフラクタルインジケーターを再開発しました。 本ツールは、フラクタルを重要な水平線と考えているトレーダーだけではなく、適切な水平線の描画方法を学習しているが、参考となる情報も同時に見たいと考えている初心者の方にとっても役立つと考えています。
FlexibleFractalsLine インジケーターの利点 フラクタルラインのOn/Off ラインを描画していないチャートを確認したいと思った時に、プロパティ画面からスイッチをOffにするだけでラインを消すことができます。インジケータを都度削除してラインを消す必要はありません。
フラクタルラインの計算期間の変更 本ツールのフラクタルの計算期間は初期値として「21」が設定されていますが、任意の期間に変更できます。 ただし、設定可能なのは「奇数」の番号のみであることにご注意くださ
FREE

このインジケーターは、2つのカスタマイズ可能な色の間で滑らかな遷移を適用することで、チャートの外観を変えることができます。この目を引くグラデーション効果により、チャートは新鮮でモダンな印象を与え、視覚的に魅力的になります。 インジケーターがチャートに添付されると、現在のチャート上にあるすべてのインジケーターウィンドウにグラデーションが適用され、その後追加される新しいインジケーターウィンドウにも影響を与えます。 ぜひ試してみて、あなたのチャートの外観をリフレッシュしてください!視覚的に改善されたチャートは、取引の際の体験を向上させ、より良い判断を下す助けになります。新しい外観のチャートで取引を楽しんでください!
FREE
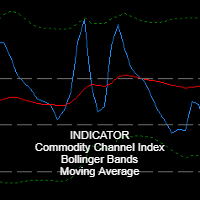
Main Indicator Description: RosMaFin Triple Insight CCI Navigator is an advanced technical indicator that combines the power of three popular indicators - CCI (Commodity Channel Index), Bollinger Bands, and Moving Average - in one comprehensive window. This versatile tool provides traders with a complex view of market conditions and helps identify potential trading opportunities with greater precision. Key Features: Display of all three indicators in one window for efficient analysis Fully custo
FREE

This simple indicator paints with a darker color on the volume bar when the quantity traded is above the average of select number of periods of the volume itself, highlighting the moments when there was a large volume of deals above the average. It is also possible to use a configuration of four colors where the color tone shows a candle volume strength. The indicator defaults to the simple average of 20 periods, but it is possible to change to other types of averages and periods. If you like t
FREE

The Expert Advisor for this Indicator can be found here: https://www.mql5.com/en/market/product/115567 The Contraction/Expansion Breakout Lines with Fair Value Gaps (FVGs) Indicator for MetaTrader 5 (MT5) is a powerful technical analysis tool designed to help traders identify and visualize breakouts at critical levels of contraction and expansion in financial markets. By incorporating Fair Value Gaps (FVGs), this indicator enhances traders' ability to gauge market sentiment and anticipate poten
FREE

Introducing the Fair Value Gap Indicator : A Simple and Effective Trading Tool The Fair Value Gap Indicator is designed to help traders easily identify and utilize Fair Value Gaps (FVGs) in their trading strategies. FVGs highlight price imbalances that the market often revisits, offering potential trade entry or exit opportunities. Whether you're a beginner or an experienced trader, this indicator simplifies the process of spotting these valuable zones, allowing you to trade with clarity and co
FREE

The currency strength momentum has a lot of similarities with currency strength meter presented in the previous page, but the difference are much more pronounced. You can try putting both in the same chart and see the difference in results. Currency strength momentum measures strength of a currency based on (you guess it) it's momentum relative to other currencies, while currency strength meter measures the strength of a currency based on pips it has moved in a certain direction.
FREE
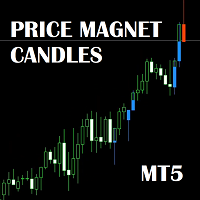
このインジケーターは、市場価格が到達する可能性のある注目すべきローソク足を表示します。 それらを観察することで、市場が次にどの方向に動くかを予測できます。 アイデアは完全にオリジナルで、**スマートマネー(Smart Money)**の概念に近いものです。 使い方:
アクティブなローソク足は色で強調表示されます。これらはマーケットメイカーにとって磁石のように機能し、まだ流動性を含んでいます。 現在の価格に対する位置に応じて、ローソク足は 赤 または 青 で表示され、視覚的にわかりやすくなります。 市場価格がアクティブなローソク足のレベルを通過すると、そのローソク足は徐々に色を失い、アクティブではなくなります。 市場が完全に通過したアクティブなローソク足はパッシブになり、通常のローソク足のように見えます。 パッシブなローソク足は価格を引き付けなくなります。 適用範囲:
このインジケーターは主要通貨ペアやマイナー通貨ペア、金、その他の資産、あらゆる時間足で使用でき、市場分析や価格の動きを捉えるのに役立ちます。 スキャルパー、デイトレーダー、D1などの長期時間足で取引するトレーダーに便利です

The ZigZag SMC/SMT Indicator for MT5 is the ideal tool for traders who want to accurately identify tops and bottoms based on the advanced concepts of Smart Money Concepts (SMC) and Smart Money Trap (SMT).
Main Benefits: Automatic identification of strategic tops and bottoms. Based on concepts used by institutional traders. Ideal for analyzing liquidity, market structure and manipulation. Simple to use: just add it to the chart and track the critical points.
️ Free Version: This ve
FREE
MetaTraderマーケットはトレーダーのための自動売買ロボットやテクニカル指標を備えており、 ターミナルから直接利用することができます。
MQL5.community支払いシステムはMetaTraderサービス上のトランザクションのためにMQL5.comサイトに登録したすべてのユーザーに利用可能です。WebMoney、PayPal または銀行カードを使っての入金や出金が可能です。
取引の機会を逃しています。
- 無料取引アプリ
- 8千を超えるシグナルをコピー
- 金融ニュースで金融マーケットを探索
新規登録
ログイン