Impulse Detector
- Indicadores
-
Flavio Javier Jarabeck
 We are a closed brotherhood of traders whose ultimate goal is to profit through well-studied, structured, and automated trades. As a result, we publish dozens of MT5 indicators (FREE and paid) to the global MQL5 community. 80% of our published products are high-quality free indicators so beginner
 - Versión: 1.5
- Actualizado: 14 julio 2023
- Activaciones: 20
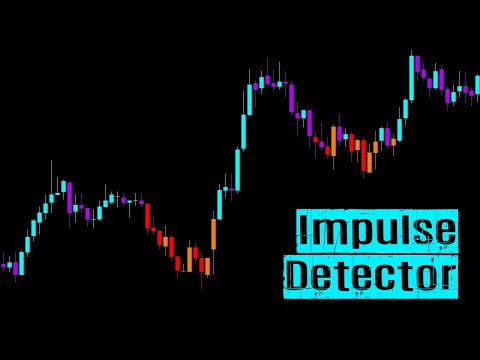
Imagine una herramienta de soporte que colorea las velas de su gráfico según el comportamiento del mercado, basado en Tendencia, Momento, Comportamiento del Precio y/o Volumen. ¡Usted elige qué utilizar!
Bien, ¡bienvenido a la creación de Minions Labs llamada Detector de Impulso!
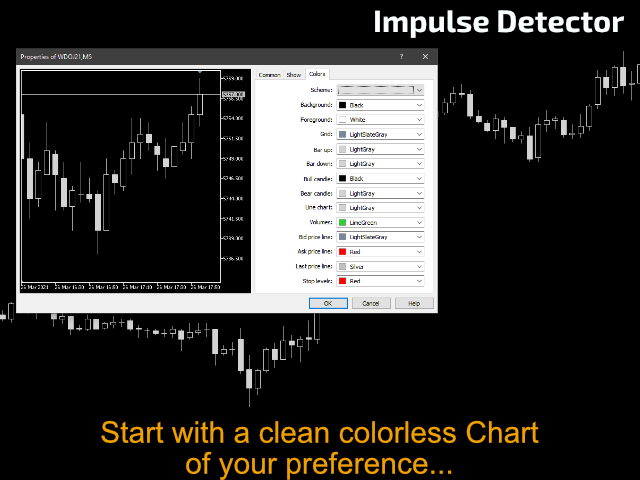
Este indicador flexible está diseñado para dar soporte visual en su gráfico usando sólo velas de colores, de modo que usted puede continuar dibujando sus estudios, usar cualquier otro indicador en sub-ventanas auxiliares sin afectar el estado real de su pantalla.
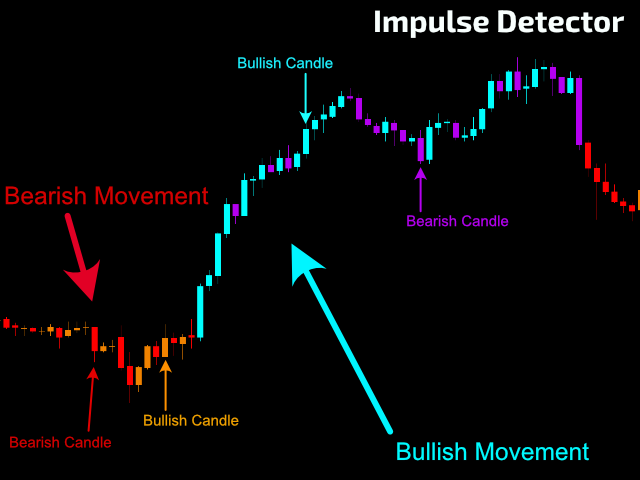
No importa si usted es un trader novato o intermedio, las ayudas visuales proporcionadas por el Detector de Impulso le ayudarán a determinar el estado y humor apropiado del mercado basado en sus calibraciones y necesidades personales. Este indicador es totalmente personalizable en todos los aspectos, por lo que puede obtener exactamente la lectura que usted espera del Mercado, del Marco de Tiempo y de la Estrategia con la que está operando.
¿QUÉ INFORMACIÓN OBTENDRÁ DE ESTE INDICADOR?
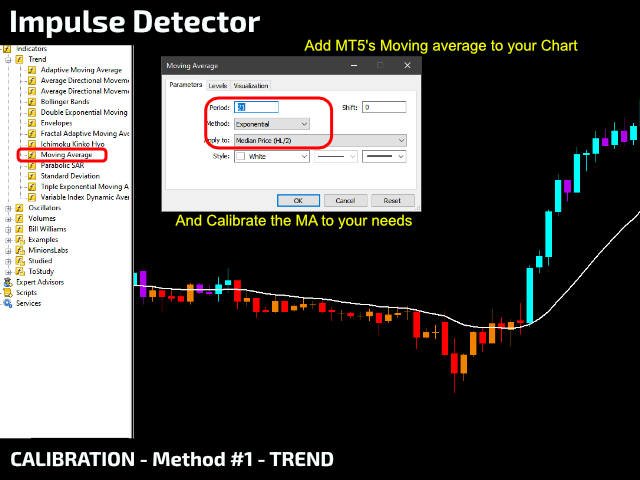
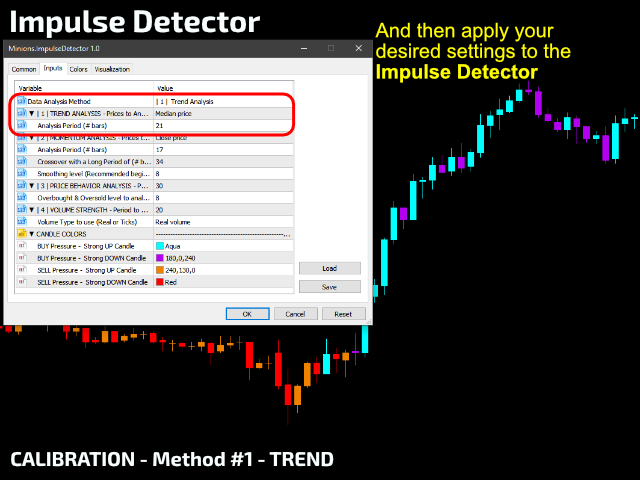
- Análisis #1 - TENDENCIA - Media Móvil Exponencial sobre el Precio. Monitoriza cuando la EMA está apuntando hacia arriba o hacia abajo, entonces sus velas se pintan en consecuencia.
- Análisis #2 - MOMENTO - Para este análisis, utilizamos el muy conocido indicador OSMA. Las velas se encenderán cuando el OSMA sea alcista/bajista y esté por encima/debajo de su Línea Cero.
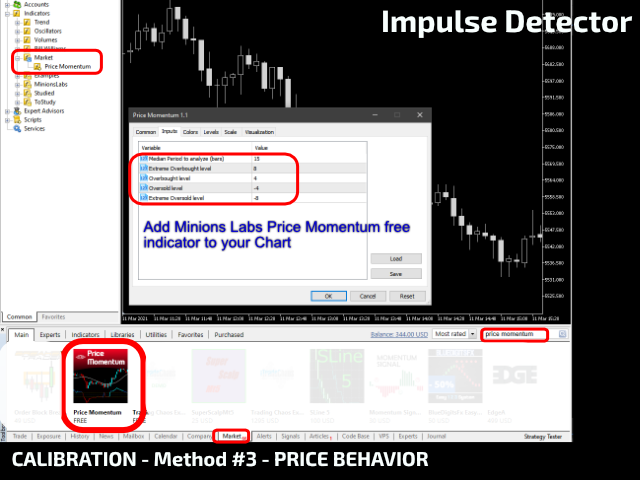
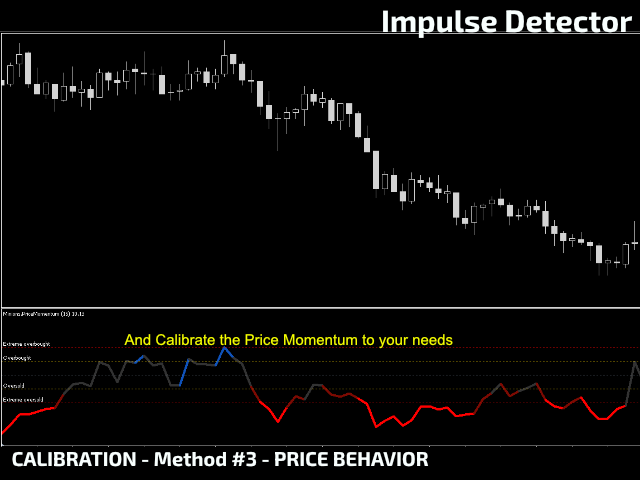
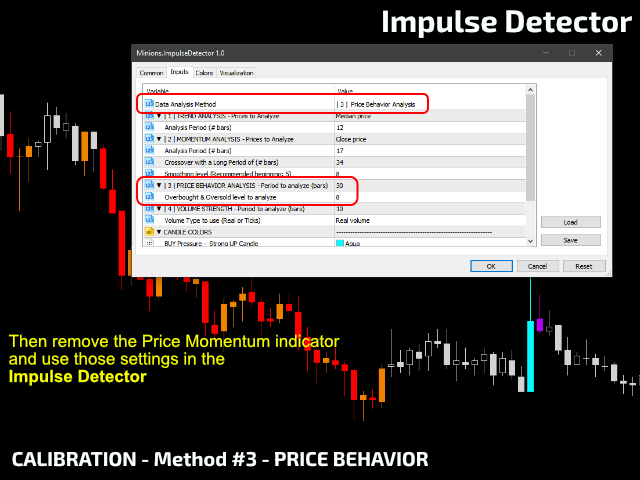
- Análisis #3 - COMPORTAMIENTO DEL PRECIO- Para este análisis, utilizamos otro indicador de Minions Labs (gratuito) llamado Momento del Precio. Así, cuando Price Momentum está por encima/por debajo de los umbrales configurados, las velas se iluminan.
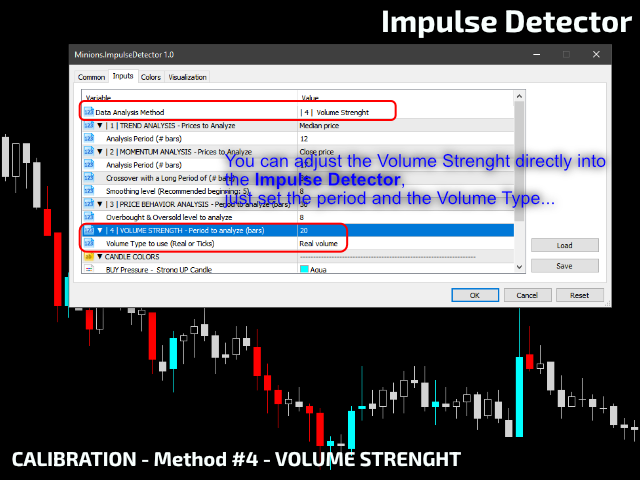
- Análisis #4 - FORTALEZA DEL VOLUMEN - Y por último, tiene la opción de utilizar el análisis del Volumen en su beneficio. Cuando el volumen de cada vela supere el umbral establecido, esa vela se iluminará.
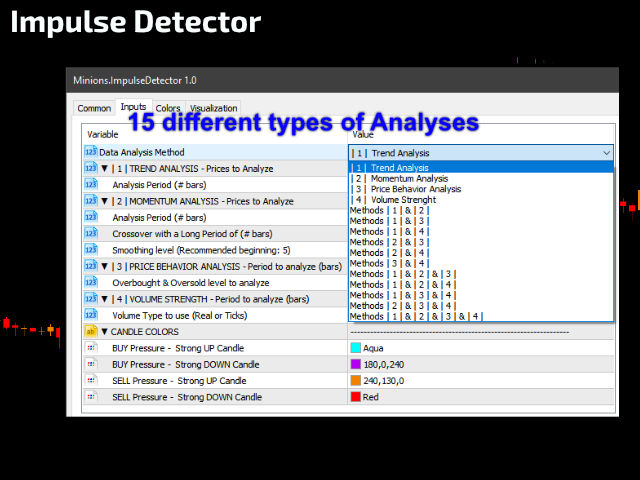
Puedes elegir cualquiera de los análisis anteriores, Y, también combinarlos de la forma que necesites, teniendo la opción de combinación de hasta 15 tipos de análisis. Con este arsenal de herramientas de análisis puedes construir una referencia visual muy potente para tus estrategias de trading sin necesidad de hinchar tu interfaz con toneladas de líneas e indicadores en pantalla.
Consulte los vídeos y capturas de pantalla adjuntos para ver el proceso de calibración y todos los detalles.
AJUSTES
- Método de Análisis de Datos a utilizar - Tendencia, Momento, Comportamiento del Precio, Volumen, O, cualquier combinación de estas técnicas (15 en Total).
- Análisis deTendencia - Tipo de Precio a utilizar en los cálculos + Periodo de análisis.
- Análisis deMomento - Tipo de precio a utilizar + Periodo de análisis + MA de largo periodo + Nivel de suavización.
- Análisis del Comportamiento del Precio - Periodo del análisis + Niveles de Sobrecompra y Sobreventa.
- Fuerza del Volumen - Periodo del análisis + Tipo de Volumen a utilizar: Volumen Real o Volumen de Ticks (Forex)
- Sistema de Coloración de Velas - Durante una tendencia alcista/bajista, qué colores se utilizarán para señalar velas alcistas y bajistas.
- *** NUEVA CARACTERÍSTICA v1.1 /v1.2/v1.3 ***
- Activar/desactivar alertas: En Pantalla, por Mail, por Móvil (MT5 app)
- Prefijo del mensaje a utilizar en las Alertas.
- Tiempo de espera entre repeticiones de alertas.
- Controla si quieres ver las alertas en tiempo real o sólo al Cierre de Vela.
¿Quieres probarlo por ti mismo, en directo en tus activos? Descarga la versión DEMO aquí: Detector de Impulsos DEMO
* Debido a la nueva política de MQL5 los desarrolladores ya no pueden proporcionar versiones DEMO al público en general aquí en este sitio web.
- #0 - Buffer BUY señal - ASK Precio, de lo contrario, cero (0).
- #1 - Buffer SELL Signal - BID Price, en caso contrario, cero (0).
¿No ha encontrado la función que necesita?
Ningún producto es perfecto para todos. Si crees que necesitas una función que falta en nuestro producto, envíanos un mensaje. Nos encantan los comentarios.


Incredible indicator with so many features and inputs for different strategies at same time. Then Flavio Jarabek has an huge technical experience and always ready in fast way to support and help you in everything you wish to complete and fulfill your needs.