VWAP Cloud
- Indicadores
-
Flavio Javier Jarabeck
 We are a closed brotherhood of traders whose ultimate goal is to profit through well-studied, structured, and automated trades. As a result, we publish dozens of MT5 indicators (FREE and paid) to the global MQL5 community. 80% of our published products are high-quality free indicators so beginner
 - Versión: 1.4
- Actualizado: 6 junio 2020
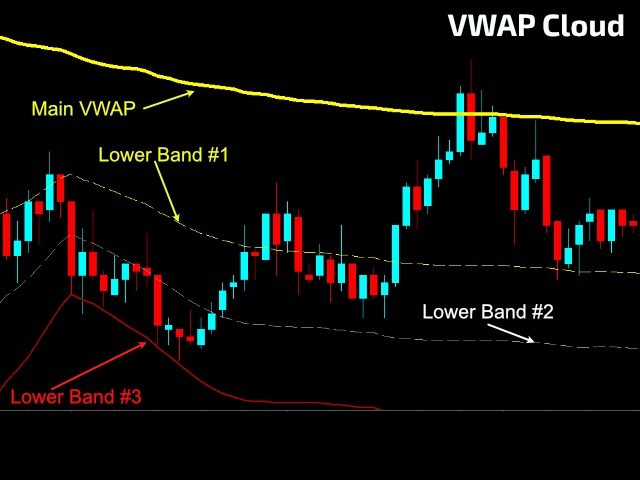
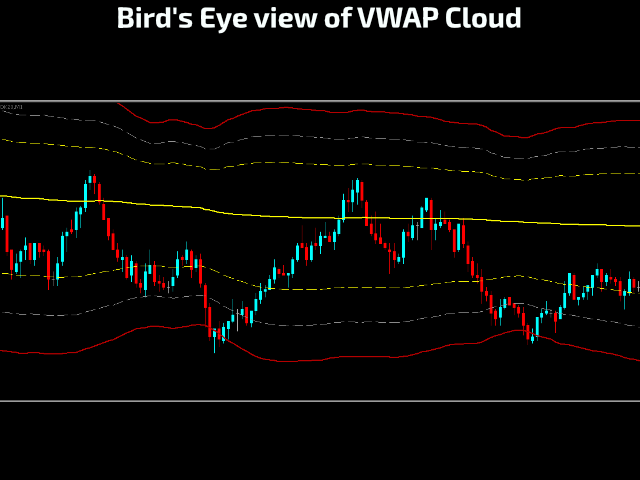
¿Le gusta el VWAP? Entonces te encantará la Nube VWAP. ¿En qué consiste? Es su muy conocido indicador VWAP más 3 niveles de Desviación Estándar trazados en su gráfico y totalmente configurables por usted. De esta manera puedes tener niveles reales de soporte y resistencia de precios. Para leer más sobre esto sólo tienes que buscar en la web "Bandas VWAP" "VWAP y Desviación Estándar".
CONFIGURACIÓN
- Plazo VWAP: Horario, Diario, Semanal o Mensual.
- Tipo de cálculo VWAP. El cálculo clásico es Típico: (H+L+C)/3
- Periodo Promedio a utilizar en el cálculo de las Bandas VWAP.
- Coeficiente de desviación estándar de las bandas #1, #2 y #3.
- Tipo de Volumen a utilizar en el cálculo del VWAP: Volumen Real o Ticks.
** Tenga en cuenta que este indicador para ser útil necesita calibración. Debe calibrarlo teniendo en cuenta el marco de tiempo del gráfico que está utilizando, el tipo de símbolo que se negocia y su rango de volatilidad, para que pueda cambiar los parámetros de desviación estándar en consecuencia.
Looking for more FREE VWAP-related indicators, here you go:
Si te gusta este indicador, lo único que te pido es una pequeña Revisión (no un Comentario, ¡sino una REVISIÓN!)...
Esto significará MUCHO para mí... Y de esta manera puedo seguir regalando cosas interesantes de forma gratuita ...
¡Sin ataduras! ¡Nunca!
¡Larga vida y prosperidad!
;)


muy bueno, pasar a tick si solo le aparece 1 linea