SuperCCI
- Indicadores
- Versión: 12.30
- Actualizado: 3 diciembre 2020
- Activaciones: 5

Descripción
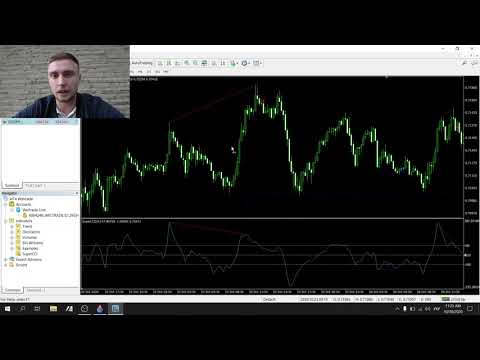
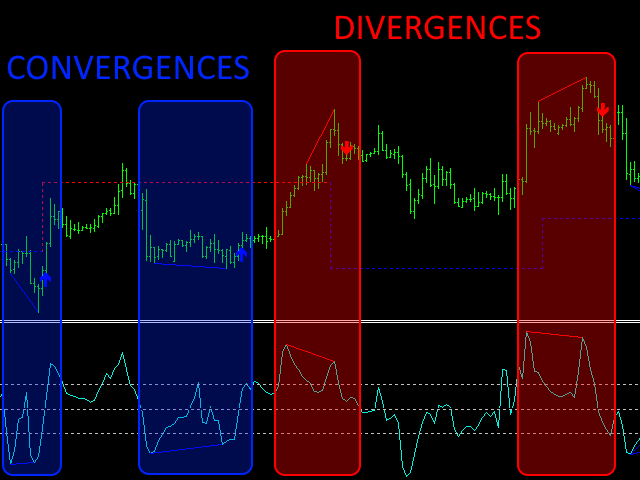
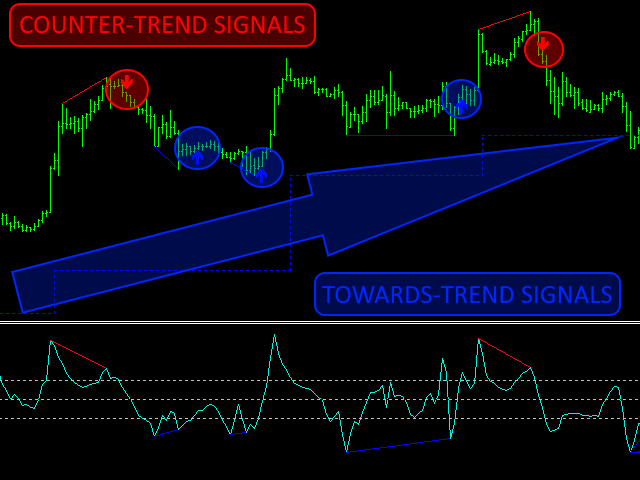
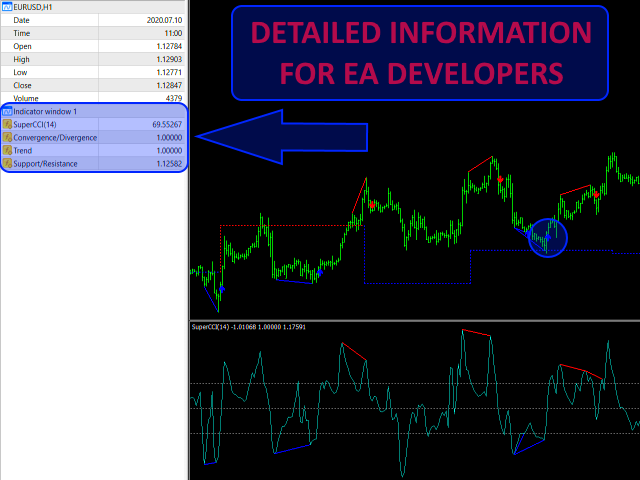
SuperCCI es un indicador basado en el indicador CCI estándar. Identifica y muestra convergencias/divergencias en el mercado y forma los puntos de entrada correspondientes. Además, utilizando el índice del canal de negociación, determina la dirección de la tendencia y muestra los niveles de soporte y resistencia.
Características
- No se repinta.
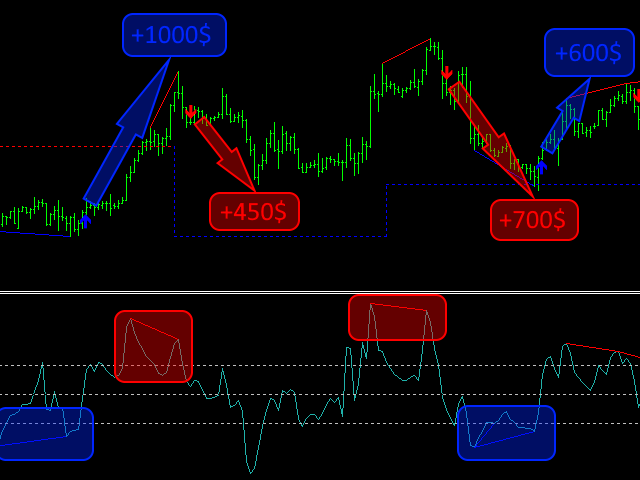
- Muestra los puntos de entrada.
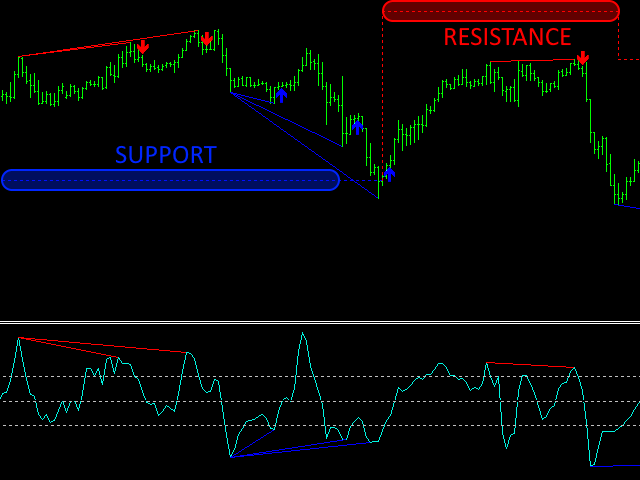
- Muestra la dirección de la tendencia actual y los niveles de soporte/resistencia.
- Tiene notificaciones.
Recomendaciones
Utilice la convergencia/divergencia para identificar los puntos de entrada al mercado y los niveles de soporte/resistencia para identificar la tendencia y los puntos de fijación de beneficios/pérdidas.
Parámetros
_INDICATOR_SETTINGS_ - ajustes del indicador. Maximum History Bars - conteo máximo de barras históricas a calcular.
CCI Period - periodo del indicador CCI.
CCI Convergence/Divergence +-Levels - niveles de convergencia/divergencia.
CCI Support/Resistance Level - nivel de soporte/resistencia.
CCI Impulse Level - nivel de impulso.
CCI Correction Level - nivel de corrección.
Ratio Imp ulso/Corrección - relación entre impulso y corrección.
_GRAPHICS_SETTINGS_ - configuración de los gráficos.
Convergence Lines Color - color de las líneas de convergencia.
Divergence Lines Color - color de las líneas de divergencia.
Ancho Líneas Convergencia/Divergencia - ancho de las líneas de convergencia/divergencia.
Estilo Líneas Convergencia/Divergencia - estilo de las líneas de convergencia/divergencia.
Líneas de soporte Color - color de las líneas de soporte.
Color de las líneas de resistencia - color de las líneas de resistencia.
Ancho Líneas Soporte/Resistencia - ancho de las líneas de soporte/resistencia.
Estilo de las líneas de soporte/resistencia - estilo de las líneas de soporte/resistencia.
_NOTIFICATIONS_SETTINGS_ - configuración de las notificaciones.
Alert Notification - permitir notificaciones de alerta.
Push Notification - permitir notificaciones push.
E-Mail Notification - permitir notificaciones por correo electrónico.