Anchored VWAP with Alert
- Indicadores
- Versión: 3.0
- Actualizado: 12 noviembre 2023
- Activaciones: 10

¿Qué es el precio medio ponderado por volumen (VWAP)?
El precio medio ponderado por volumen (VWAP) es una referencia de negociación utilizada por los operadores que indica el precio medio al que se ha negociado un instrumento a lo largo del día, basándose tanto en el volumen como en el precio.
Es importante porque proporciona a los operadores información sobre la tendencia y el valor del instrumento.
¿Cuál es la diferencia entre VWAP y AVWAP?
Mientras que el VWAP tiene como punto de partida el comienzo del día, semana, mes, etc., en el AVWAP puede colocarlo donde desee en su gráfico.
Descripción del indicador
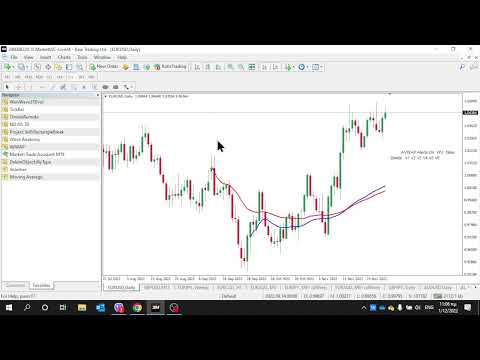
Este indicador proporciona 6 líneas AVWAP. Una vez cargado en el gráfico una etiqueta aparecerá en su pantalla "No Vertical Lines".
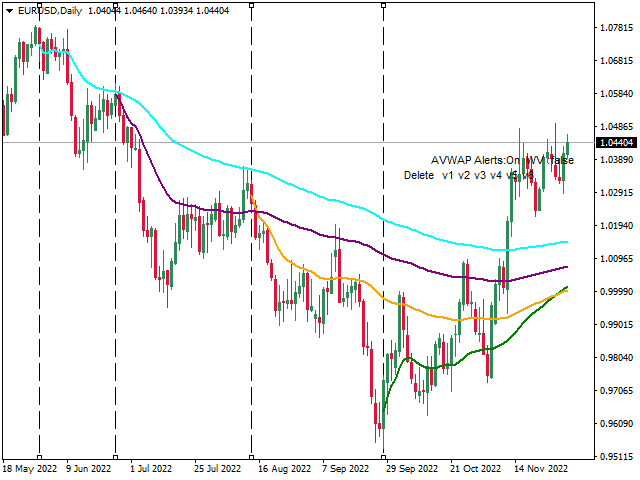
Haciendo click en la etiqueta "No Vertical Lines" el indicador crea 6 líneas verticales discontinuas al principio de su gráfico separadas por tres barras cada una y dibuja las líneas VWAP llamadas v1,v2,v3, v4, v5, v6 en seis colores diferentes. Al mover una línea vertical, la línea VWAP se actualiza automáticamente. Al hacer clic en "Eliminar" se eliminarán todas las líneas. Haciendo clic en "v1" se borrará sólo la línea v1, etc. También puede crear las líneas verticales una a una pulsando en la parte superior de su teclado los números 1, 2, 3, 4, 5 ó 6. Si pulsa el número 1 se creará la línea "v1". Pulsando el número 1 creará "v1", el número 2 creará "v2", etc. (las líneas verticales no se crearán si ya existen en su gráfico).
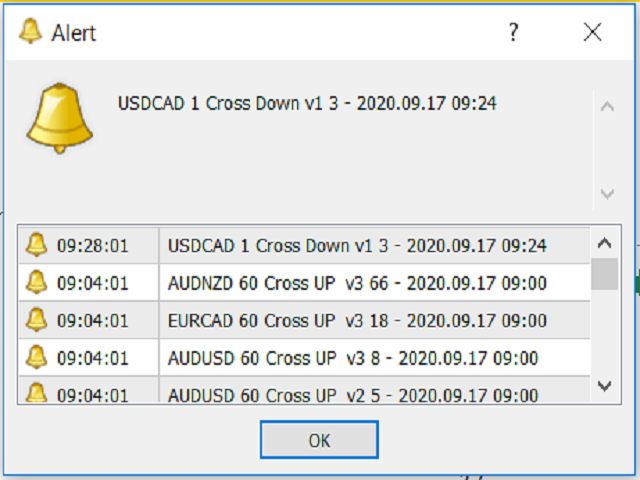
Además, el indicador proporciona cuatro tipos de Alertas cada vez que se cruza una línea AVWAP.
Cada vez que haga clic en la etiqueta, el indicador creará las 6 líneas verticales y/o las reposicionará al principio del gráfico si ya existen.
Que pasa si:
- No necesita 6 líneas VWAP: simplemente borre las líneas verticales que no necesita haciendo clic en el texto de v1 a v6
- Borra por accidente una línea vertical: simplemente créela manualmente pulsando las teclas superiores del teclado del 1 al 6
- Si desea ocultar las líneas AVWAP, haga clic en el texto "Ocultar AWVAP" y para volver a mostrarlas, haga clic en el texto "Mostrar".
Parámetros
Precio Cierre1-6: 0 Cierre, 1 Mediana. Puede decidir si el VWAP se calculará utilizando el precio de cierre o la mediana del precio (Máximo+Mínimo)/2.
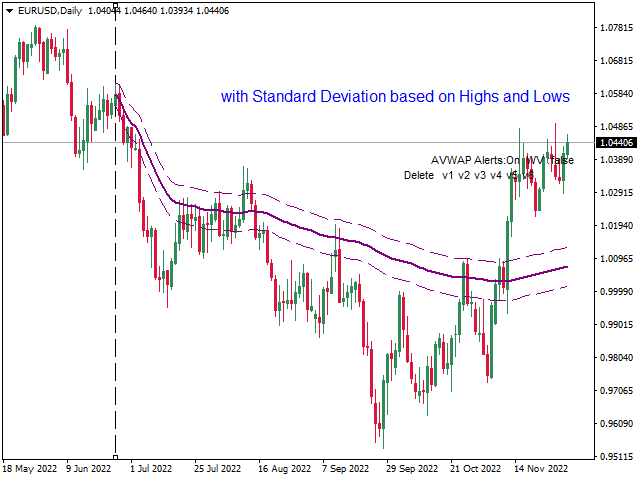
Show_HL1-6 : true/false Mostrar o no el Máximo y el Mínimo de cada línea AVWAP que actúa como una desviación estándar.
Nombre y formato de las líneas AVWAP
- Formatea cada línea AVWAP y sus Máximos y Mínimos en nombre, color, estilo y ancho.
Vertical y Formato
- Puede dar formato al color, estilo y anchura de las líneas verticales.
Alertas de cruce AVWAP
- Establece una Alerta sobre el cruce AWAP al alza o a la baja en cada una de las líneas AVWAP y sus Máximos y Mínimos.
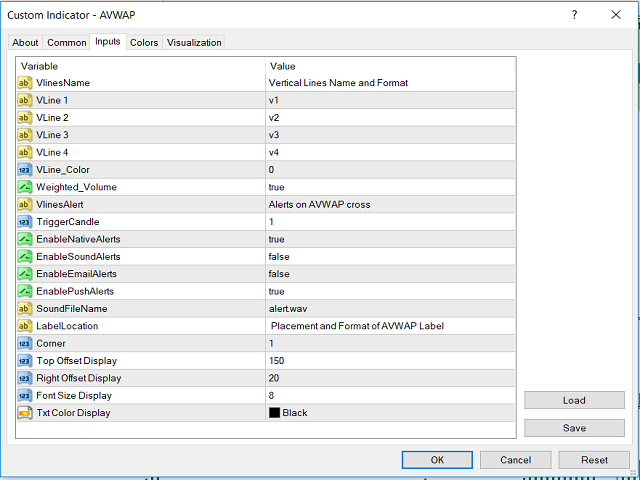
Tipo de Alerta
- TriggerCandle = 1: El número de vela en la que se activará la alerta (0 es la vela de formación, 1 es la anterior a la de formación-cierre)
- EnableNativeAlerts = true/false : Pop-up
- EnableSoundAlerts = true/false: Sonido
- EnableEmailAlerts = false: Correo electrónico
- EnablePushAlerts =true: Notificación Push
- SoundFileName = "alert.wav": Archivo de sonido
Colocación y formato de la etiqueta AVWAP
- Corner=1 : Se mostrará el nombre del indicador en la esquina de la ventana
- Top_Offset = 150; // Visualización del desplazamiento superior
- Right_Offset = 20;// Desplazamiento a la derecha
- Text_Font_Size = 8;// Tamaño de Fuente en Pantalla
- Text_Color = Negro;//Visualización del color del texto
¡Que lo disfrutes!

Coming from trading futures I came to learn the importance of vwap and espcially anchored vwap from Brian Shannon, a trader that I greatly admire and respect. This is a wonderful indicator that allows you to anchor vwap to significant price points and events. I like that you have multiple options for multiple vwaps. Wish there was an option for standard deviation bands as well but I'm quite happy with it as it is! It is very useful!