Euro Session Indicator

The EuroSession indicator combines filtering by a modified MACD and a trend based indicator.

It is an indicator that tries to capture the early market move of the European session.

This would mean that pending orders have to be placed way ahead of this move.

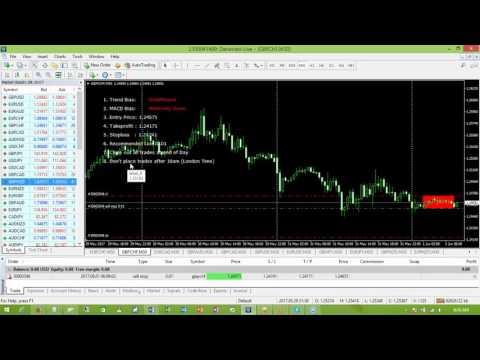
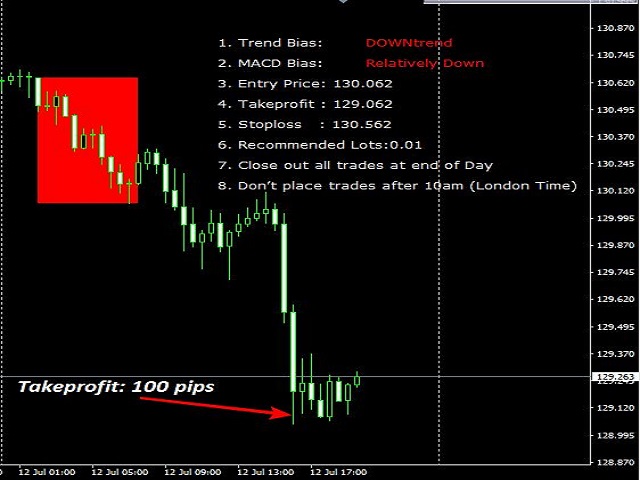
BUY Pending orders (Buystop) should be placed if:

  • Trend-Bias shows 'UP'
  • MACD Bias shows 'Relatively UP'

SELL Pending orders (Sellstop) should be placed if:

  • Trend-Bias shows 'DOWN'
  • MACD Bias shows 'Relatively DOWN'

The currency pairs are:

  • EURUSD, EURJPY, EURNZD, EURAUD, EURCHF,EURCAD, GBPUSD, GBPJPY, GBPNZD, GBPAUD, GBPCHF, GBPCAD
  • Timeframe is 30 minutes
  • Timeline
    • 6am (London Time): Attach indicator on charts and place all pending orders.
    • 10am (London Time): Close all pending orders that are yet to be triggered.
    • 10pm (London Time): Close all trades.
  • Steps to using EuroSession Indicator
    • Attach the indicator on the Recommended currency.
    • At 6am (London Time), place your pending order trades.
    • By 10am (London Time) close all trades and pending orders left.


Parameters

  • Takeprofit: 40
  • Risk: 2%
Recommended products
Robot scalper for M5 timeframe. Trades on the GBPUSD currency pair. This robot has been specially developed by a company of professional traders for trading in the pound sterling. The robot approximately opens 5 to 15 trades every day. It is best to trade with brokers that have a low spread on GBPUSD up to 10 pips. The recommended minimum deposit to start is $500 or more. Advantages: does not use martingale. not a net. every trade has a stop loss. professional bot specifically for the GBPUSD p
Currency Strength Table HYBRID v1.33   - Professional Multi-Timeframe Currency Strength Analyzer (PRO) BREAKTHROUGH CURRENCY ANALYSIS SOLUTION FOR SERIOUS FOREX TRADERS!  *Note: Most suitable for Professionals, Advanced & Intermediate traders!   * ADDITIONAL BONUS:   Rent for 3months and get a free ex.4 dual switch momentum (RSI+Prcie/Bid Ratio) Currency Bar Meter . See attached screenshot 6 .  Limited offer (first 50 purchases). The Ultimate All-In-One Currency Strength Dashboard EXPLAINED. St
Introducing our new indicator: [ON Trade Breakout Zone] Simple Yet Powerful Market Analysis Tool for All Traders! Suitable for Both Professionals and Beginner Traders Are you ready to supercharge your trading strategy? Our latest indicator is designed to simplify market analysis and empower traders of all levels. Whether you're a seasoned pro or just starting, [ ON Trade Breakout Zone ] is your key to unlocking potential profits in the market. How to Use [ ON Trade Breakout Zone ]:
Key level wedge pro
Presley Annais Tatenda Meck
5 (1)
We have combined all of our beloved indicators the likes of: Key level order block , Key level supply and demand , Key level liquidity grab and Key level wedge into one single indicator and dashboard. Whats new Dashboard : There is an easy access dashboard for all your needs. Multi-timeframe button : There is now a multi-timeframe option for Order Blocks and Supply and demand zones, making it easy to see higher timeframe zones easily on the current timeframe by just clicking the desired timefra
The indicator automatically builds Support/Resistance levels (Zones) from different timeframes on one chart. Support-resistance levels are horizontal lines. As a rule, the market does not respond to a specific price level, but to a price range around the level, because demand and supply of market participants are not formed clearly on the line, but are “spread out” at a certain distance from the level. This indicator determines and draws precisely such a price range within which strong positi
CRT Candle Range Theory HTF MT4.   Ultimate CRT Indicator: Advanced ICT Concepts and Malaysian SnR Trading System Discounted   Price   $50  !!     Secure your lifetime access   now   before it switches to   subscription-only ! Master the Market Maker's Footprints with the Most Advanced Candle Range Theory Indicator Unlock the true power of   Smart Money Concepts (SMC)   and trade precisely like the institutions with the   Ultimate CRT Indicator . Built exclusively for serious traders, this indic
Fx Levels Premium Indicator Support and Resistance are important concepts in trading. Fx Levels Premium was created to easily draw important levels of support and resistance for the active trader. The indicator will give you all important levels (support/resistance) to watch for a wide range of assets. Trading without these levels on your chart is like driving a car for a long journey without a roadmap. You would be confused and blind. Support and resistance levels should be used as guideline
Next level of trend trading here. Possibility 75%, the indicator analyzes the current market to determine short (small dot), middle (circle with a dot inside) and long (cross with a circle and a dot inside) trends.  Wingdings characters of  Aqua color represents the beginning of the UP trend. Wingdings characters of  Orange color represents the beginning of the DOWN trend. Possibility 75% Indicator will improve your trading in the world of forex, commodities, cryptocurrencies and indices.
KijunSen vs Price Ichimoku Strategy MM Description in English and Italian = This Indicator is based on one of the Strategies with Ichimoku Indicator, in particular is the cross of the KijunSen with the Current Price; it will give you of Buy and Sell when they Cross, with Arrows and Alerts. When you attach the indicator on the chart , a window will open where , in the INPUT section, you can also choose to change the main Ichimoku values. SIGNAL INPUT =    · BUY = when Price cross above the K
M W Pattern Pro
Noiros Tech
4.14 (7)
M & W Pattern Pro is an advanced scanner for M and W patters , it uses extra filters to ensure scanned patterns are profitable. The indicator can be used with all symbols and time frames. The indicator is a non repaint indicator with accurate statistics calculations. To use , simply scan the most profitable pair using the statistics dashboard accuracy , then enter trades on signal arrow and exit at the TP and SL levels. STATISTICS : Accuracy 1 : This is the percentage of the times price hits TP
Martingale Scanner: Smart Trade Analysis for Martingale Strategies The Martingale strategy is a high-risk, high-reward approach that requires precise execution and careful risk management. Without the right tools, traders may struggle to analyze market conditions and adjust trade sizes effectively. Martingale Scanner is designed to simplify and optimize this process, providing traders with a structured way to apply the strategy efficiently across different currency pairs. Why Use Martingale Scan
FREE
BTMM State Engine Pro is a MetaTrader 4 indicator for traders who use the Beat The Market Maker approach: Asian session context, kill zone timing, level progression, peak formation detection, and a multi-pair scanner from a single chart. It combines cycle state logic with a built-in scanner dashboard so you do not need the same tool on many charts at once. What it does Draws the Asian session range; session times can follow broker server offset or be set in inputs. Tracks level progression (L
Candle EA MT4
Mansour Babasafary
3.68 (19)
This expert is based on patterns The main patterns of this specialist are candlestick patterns Detects trends with candlestick patterns It has a profit limit and a loss limit, so it has a low risk The best time frame to use this expert is M30 time frame The best currency pairs to use with this expert is the EURUSD, GBPUSD, AUDUSD, USDCAD currency pairs Attributes: Can be used in the EURUSD, GBPUSD, AUDUSD, USDCAD  currency pairs Can be used in M30, H1, H4 time frames Has profit limit and loss
The Daily Trader   This indicator is part of the   RPTrade Pro Solutions  systems. The daily Trader  is a daily indicator using only statistics. It's designed to be used by anyone, even the absolute beginner in trading can use it. NEVER repaints . Indications are given  from close to close . Designed to  be used alone , no other indicators are required. Gives you Clear and simple indications How does it work The statistical system analyses the history to find redundancy in symbols behavior. T
Mechanism : The EA opening trade base on the standard " Japanese CandleSticks Technical Analysis " and confirming the signal by various reversal zone define by "Divergence, Support and Resistance, and some common Indicators like Sto, Bollinger Band, MACD etc" under the CONFIRMATION INPUTS SETTINGS (True/false option). Lot Method: The EA is Implemented with fixed lot size and Auto lot base on specified Risk Management System base on the available account balance by some percent risk of that's. Tr
! register Interactive Broker   https://ibkr.com/referral/zhenwei375 Hi! I will be happy if you subscibe to my youtube channel.  # youtube https://www.youtube.com/channel/UC4fZRTNdAcHJMDm71MyMkew?sub_confirmation=1 ! Current EA Works Until 2022.03.10 ! First Backtest By Your Self https://github.com/aizwellenstan/MQL4_Backtest_Results/blob/main/TraderAiz_btp_Pro_Backtest.ex4 Broker: ICMarkets Raw Spread Account Works On D1 H4 TimeFrame # Pairs ------------ EURUSD US500 JP225 USTEC AU
the first release of the new year's special promo price.normal price 150 USD. important user guide is here https://heyzine.com/flip-book/62a16c6955.html indicator to speed up finding support and resistance price.very easy to use very neat interface.doesn't display unnecessary confusing things.uses basic trading strategies for professional traders.....happy trading  if something is still not clear,please contact me personally,i will reply later
Mk R
Can Pei Pu
MK_R It is based on contrary patterns for EURUSD.  Basically, it will entry using the condition of 1 buy wave and 6 sell wave of Granville's law. The EA does not use indicators, grid, martingale, arbitrage.  The EA has been proven to be profitable in the six months of 2020 and is particularly suitable for the current EURUSD market since mid-December 2020. Monitoring: https://www.mql5.com/en/signals/789229 Timeframe is M5. EA needs M1 chart,M5 chart,M15 Chart,H1 chart,H4 chart. Maxium Spread
FxTDR
Miracle Obinna Okafor
FxTDR is a bespoke technical indicator tailored for analyzing asset prices. The primary objective of this indicator is to identify favorable entry points for trading on selected currency pairs. It employs a set of criteria to detect optimal trading opportunities within the chosen time frame. Key Features: 1. Entry Point Detection: Pinpoints favorable trade conditions. 2. Arrow Signals: Provides visual cues for identified opportunities. 3. Push Notifications: Real-time alerts for timely awarene
Trend Flasher Trend is your friend is the age old saying quote in trading arena, there are though many ways to gauge the trend and its direction, more scientific measure and logically meaningful will be an ATR break outs to identify and spot the trend and its acceleration, so we created this easy to use trend identification panel and optimized super trend based multi time frame panel entry system to aid and help the traders to make their trading decision. Unique Features of Trend Flasher 1. H
The indicator is designed to work on any trading platform. The program is based on proprietary algorithms and W.D.Ganna's mathematics, allowing you to calculate target levels of price movement based on three points with the highest degree of certainty. It is a great tool for stock trading. The indicator has three buttons: NEW - call up a triangle for calculation. DEL - delete the selected triangle. DELS - completely remove all constructions. The probability of achieving the goals is more than 80
The King of Forex Trend Cloud Indicator is a trend following indicator based on moving averages. The Indicator is meant to Capture both the beginning and the end of a trend. This indicator can be used to predict both short and long terms market trends.  The king of Forex Trend Cloud if paired together with the King of Forex Trend Indicator can give a broad picture in market analysis and forecasts. I have attached images for both the  The king of Forex Trend Cloud on its own and  The king of Fore
Forex Signal Generator is a cutting edge technology for Trend Trading, and filtering all inbuilt in one tool. The Signal Generator  analysis the market like a Pro  by using its smart algorithms to detect  the trend, filter out market noise  and display on  your chart with the : ENTRY, STOPLOSS AND TARGET PROFIT Advantages You Get     Access to the proven reliable trend indicator based     Easy and  effective trend detection.     Gives you the ability to filter  out  'NOISE' from the market  
Gold Crazy EA MT4
Nguyen Nghiem Duy
Gold Crazy EA   is an Expert Advisor designed specifically for trading Gold H1/ EU M15. It use some indicators to find the good Entry. And you can set SL or you can DCA if you want. It can be an Scalping or an Grid/ Martingale depend yours setting. This EA can Auto lot by Balance, set risk per trade. You also can set TP/ SL for earch trade or for basket of trade. - RSI_PERIOD - if = -1, then the default strategy works, if >0, then the RSI strategy works - MAX_ORDERS - to trade with only 1 order,
Mean Reversion Supply Demand Indicator Mean Reversion Supply Demand is the indicator to detect the important supply demand zone in your chart. The concept of supply demand trading relies on the quantity mismatching between buying and selling volumes in the financial market. Typically, supply demand zone serves to predict the turning point. The wave pattern, for any supply demand zone to work as an successful trade, looks like the price must touch the base zone, move away and then return to zone
Galactic Volume spread analysis (VSA), is an indicator designed for the visualization of the Volume, and the proportion in which it affects the volatility of the spread of the different pairs. The strategy consists of the following: Bull Trend: Always going in favor of the trend, open buying operations at the lows of the trend, provided that it coincides with a high volume shown by the Galactic VSA indicator. Downtrend: Always going in favor of the trend, open sales operations at the highs of
Swing Points 4
Usiola Oluwadamilol Olagundoye
Next Arrival : Flip or Die Trading Arena. Flip a trading account:  https://flipordie.com/chapter-1-thirteen-doublings-double-a-trading-account/ Swing Points Indicator for MetaTrader 4 The **Swing Points Indicator** is a custom-built technical tool designed for MetaTrader 5 (MT5), primarily used for identifying crucial reversal points in price action. By plotting swing highs and swing lows, it highlights potential trend reversals, making it a valuable tool for traders relying on price action an
FREE
This Indicator is use the ZigZag to calculate the Upper and  Lower Bound and the uptrend and the downtrned. Red for downtrend, Green for uptrend and Yellow is for the horizontal trend this horizontal trend also bookmarked the upper limited and the lower limited the the price swings.  Or in simple the Support and the Resistance level. However, You may use the Heikin Ashi to confirm the trend of the buy sell signal above. I cannot guarantee the win rate, Nevertheless, you must study well the timef
TPO Profile MT4
Kyra Nickaline Watson-gordon
5 (1)
Definition : TPO is a Time Price Opportunity. Instead of using bars or candles with an Open, High, Low, and Close price, each "bar" in a Market Profile is represented by horizontal bars against the price It is called Market Profile terminology. In other words time-price-opportunity (TPO) profiles are histograms of how much time was spent at each price within the span of the profile. By using a TPO chart, you are able to analyze the amount of trading activity, based on time, for each price level
Based on commonly used ZigZag indicators, in-depth mining was conducted on the indicators, with two main improvements: 1、 Annotate each ZZ price point; Annotate the distance points between adjacent ZZ points for a more convenient and intuitive view of price fluctuations. 2、 Draw a Fibonacci line for the current price direction of ZZ. The Fibonacci line includes two types: the Fibonacci retracement level and the Fibonacci expansion level. When the last four ZZ points comply with Dow's 123 rule,
Buyers of this product also purchase
The " Dynamic Scalper System " indicator is designed for the scalping method of trading within trend waves. Tested on major currency pairs and gold, compatibility with other trading instruments is possible. Provides signals for short-term opening of positions along the trend with additional price movement support. The principle of the indicator. Large arrows determine the trend direction. An algorithm for generating signals for scalping in the form of small arrows operates within trend waves.
KuKl
IGOR KIRIANEN
The indicator is built on a non-standard Zig Zag, it draws accumulations after which if the price leaves this zone and a test of this zone occurs, then a sound signal is given and an arrow appears - after the test candle closes.The indicator does not redraw its signals, it is very easy to use, there are only three settings 1- this is the zig zag parameter 2- this is the minimum price exit from the zone 3- this is the maximum price exit from the zone. The lower the parameter for Zig Zag, the more
Miraculous Indicator – 100% Non-Repaint Forex and Binary Tool Based on Gann Square of Nine This video introduces the Miraculous Indicator , a highly accurate and powerful trading tool specifically developed for Forex and Binary Options traders. What makes this indicator unique is its foundation on the legendary Gann Square of Nine and Gann's Law of Vibration , making it one of the most precise forecasting tools available in modern trading. The Miraculous Indicator is fully non-repaint, meaning t
Precautions for subscribing to indicator This indicator only supports the computer version of MT4 Does not support MT5, mobile phones, tablets The indicator only shows the day's entry arrow The previous history arrow will not be displayed (Live broadcast is for demonstration) The indicator is a trading aid Is not a EA automatic trading No copy trading function The indicator only indicates the entry position No exit (target profit)  The entry stop loss point is set at 30-50 PIPS Or the front hi
Pulse Scalping Line - an indicator for identifying potential pivot points. Based on this indicator, you can build an effective Martingale system. According to our statistics, the indicator gives a maximum of 4 erroneous pivot points in a series. On average, these are 2 pivot points. That is, the indicator shows a reversal, it is erroneous. This means that the second signal of the indicator will be highly accurate. Based on this information, you can build a trading system based on the Martingale
El indicador "MR BEAST ALERTAS DE LIQUIDEZ" es una herramienta avanzada diseñada para proporcionar señales y alertas sobre la liquidez del mercado basándose en una serie de indicadores técnicos y análisis de tendencias. Ideal para traders que buscan oportunidades de trading en función de la dinámica de precios y los niveles de volatilidad, este indicador ofrece una visualización clara y detallada en la ventana del gráfico de MetaTrader. Características Principales: Canal ATR Adaptativo: Calcula
Meravith
Ivan Stefanov
5 (3)
Market makers' tool. Meravith will: Analyze all timeframes and display the current trend in force. Highlight liquidity zones (volume equilibrium) where bullish and bearish volumes are equal. Display all liquidity levels across different timeframes directly on your chart. Generate and present text-based market analysis for your reference. Calculate targets, support levels, and stop-loss points based on the current trend. Compute the risk/reward ratio for your trades. Determine position size accor
SYSTEM INTRODUCTION:   The Binary Options Channels System Is Specifically Designed For Binary Options Trading. Unlike Other Systems And Indicators That Were Adopted From Other Trading Environments For Binary Options. Little Wonder Why Many Of Such Systems Fail To Make Money . Many End Up Loosing Money For Their Users.  A Very Important Fact That Must Be Noted Is The Fact That Application Of Martingale Is not Required. Thus Making It Safer For Traders Usage And Profitability. A Trader Can Use Fi
Product Name:   Quantum Regime Indicator Short Description:   A multi-engine structural regime and volatility filter. Description: Quantum Regime Indicator (QRI) is a sophisticated technical analysis algorithm designed to identify market structure shifts and volatility regimes. Unlike standard indicators that rely on immediate price action, QRI utilizes a hierarchical logic architecture to filter market noise and identify statistical extremes. The indicator is built on the philosophy of "Market
Fxland Price Reversal Zones (MT4) FXLAND Smart Reversal Indicator is a professional technical analysis tool designed to help traders identify potential price reversal zones and key market turning points with clarity and precision. The best reversal indicator and price return by choosing only one ceiling or floor in each time frame A masterpiece of combining mathematics and Gann, fractal matrix, Fibonacci, movement angle and time. Completely intelligent Key Features Detects potential pr
PairMaster Buy Sell Arrow Indicator for MT4 Trade Reversals Like a Pro — Catch Every Swing Point with Precision The PairMaster Buy Sell Arrow Indicator is a powerful MetaTrader 4 tool built to identify high-probability swing trading opportunities . Designed for traders who value accuracy, clarity, and simplicity, PairMaster detects key market turning points and plots intuitive buy and sell arrows directly on your chart. Key Features Accurate Swing Point Detection – Automatically identifies ma
VTrende Pro mt4
Andrii Diachenko
3 (2)
VTrende Pro MT4 - MTF indicator for trend trading with a display panel for MT5 *** Videos can be translated into any language using subtitles (video language - Russian) Although the signals of the VTrende Pro indicator can be used as signals of a full-fledged trading system, it is recommended to use them in conjunction with the Bill Williams TS. VTrende Pro  MT4 is an extended version of the VTrende indicator. Difference between Pro version and VTrende: - Time zones - Signal V - signal 1-2 wave
Bomb Bank Signal
Igor Pereira Calil
5 (1)
Bomb Bank Signal: Your Trusted Indicator for MetaTrader 4 The Bomb Bank Signal is a powerful indicator for MetaTrader 4, designed to identify the most relevant trends in the financial market. If you are looking for a tool that accurately anticipates movements, Bomb Bank is the ally you need. How it Works: This indicator combines three distinct methods – volume analysis, candle closes and symmetrical trend – to detect and signal buying and selling opportunities. Bomb Bank is like a "bomb" whe
Rtc ML Ai Predictor MT4
Muhammad Faisal Sagala
Rtc ML Ai | Predictor CORE MACHINE LEARNING ENGINE Adaptive ML Market Predictor – Multi-Bar Trend & Candle Forecast What This Indicator Does This indicator is a  real-time market prediction engine  designed to analyze price behavior and estimate  future market tendencies . Unlike conventional indicators, this system  does not rely on static parameters or historical curve-fitting , but adapts its internal state dynamically during live market operation. Instead of using static rules, the indic
First time on MetaTrader, introducing IQ Star Lines - an original Vedic Astrology based indicator. "Millionaires don't use astrology, billionaires do" . - J.P. Morgan, Legendary American financier and banker. Welcome to  the new and updated  IQ Star Lines , the ultimate fusion of ancient planetary harmonic cycles and modern quantitative trading. published for the   first time on Metatrader. This is an indicator built by the developer, who has spent almost 2 decades trading while studying Vedic
OrderFlow Absorption – Professional Delta & Absorption Signal Indicator for MT4 Unlock the power of true order flow analysis with   OrderFlow Absorption   – the ultimate delta histogram and absorption signal indicator for MetaTrader 4. Designed for traders who want to see what’s really happening behind every price move, this tool reveals hidden buy/sell pressure and absorption events that drive the market. Features Delta Histogram Visualization:   Instantly see buy and sell pressure with clear,
The Hurricane Indicator
Paul Nicholas Clevett
5 (1)
Currently switched to the 4 hour chart - but use other time frames for confirmation. :-)  I change my main time frame based on the market movement at the time. The Hurricane Forex Indicator is a multi time frame indicator that includes such things as Trade Notifications, Trade Calculator, Momentum Indicator, risk reward and much more. We have a free Trade room for our users as well. Please check out the video for full details of how this indicator works as it has over 15 years worth of developme
ConfluencePro v2.0 – Ultimate Confluence Indicator for Binary Options & Forex Professional Multi-Filter Signal System with Dashboard, News Filter & Real-Time Statistics ConfluencePro v2.0 is the most advanced confluence-based indicator ever released on the MQL5 Market. It combines 17+ professional filters (Trend, Smart Money Concepts, Market Structure, Divergence, MTF Confirmation, News Events, Volume, Regime Detection and more) into a single, easy-to-read confluence score (0–100%). Only the hi
[Trend Line Pro 3]  Trend Line Pro 3 is a discretionary analysis indicator that visualizes swing structure based on Dow Theory / ZigZag concepts and organizes key lines (support/resistance and trendlines) as well as potential break/structure-change points (BreakEdge) directly on the chart. * This product is NOT an EA. It does not place trades or send orders. It helps you organize market structure with the same rules and align your decision criteria more consistently.
FFx Engulfing Setup Alerter gives trade suggestions with Entry, Target 1, Target 2 and StopLoss. Below are the different options available: Entry suggestion - pips to be added over the break for the entry 3 different options to calculate the SL - by pips, by ATR multiplier or at the pattern High/Low 3 different options to calculate the 2 TPs - by pips, by ATR multiplier or at Risk/Reward Offset the dashboard - any place on the chart Remove the suggestion once the price reached the SL line Lines
FFx InsideBar Setup Alerter gives trade suggestions with Entry, Target 1, Target 2 and StopLoss. Below are the different options available: Entry suggestion - pips to be added over the break for the entry Minimum candle size - to avoid too close buy/sell entry suggestions 3 different options to calculate the SL - by pips, by ATR multiplier or at the pattern High/Low 3 different options to calculate the 2 TPs - by pips, by ATR multiplier or at Risk/Reward Offset the dashboard - any place on the c
FFx OutsideBar Setup Alerter gives trade suggestions with Entry, Target 1, Target 2 and StopLoss. Below are the different options available: Entry suggestion - pips to be added over the break for the entry. 3 different options to calculate the SL - by pips, by ATR multiplier or at the pattern High/Low. 3 different options to calculate the 2 TPs - by pips, by ATR multiplier or at Risk/Reward. Offset the dashboard - any place on the chart. Remove the suggestion once the price reached the SL line.
FFx PinBar Setup Alerter gives trade suggestions with Entry, Target 1, Target 2 and StopLoss. Below are the different options available: Entry suggestion - pips to be added over the break for the entry Minimum candle size - to avoid too small candles 3 different options to calculate the SL - by pips, by ATR multiplier or at the pattern High/Low 3 different options to calculate the 2 TPs - by pips, by ATR multiplier or at Risk/Reward Offset the dashboard - any place on the chart Remove the sugges
Automatic, live & interactive picture of all trendlines. Assign push, email and sound alerts to the lines of your choice and be informed about price rollback, breakout, rollback after breakout, number of rollbacks, line expiration by double breakout. Correct, drag or delete the lines and interactively tune the line system. https://youtu.be/EJUo9pYiHFA . Chart examples https: //www.mql5.com/en/users/efficientforex Price Interaction Events All events are effective immediately and only after one
The purpose of this new version of the MT4 standard indicator provided in your platform is to display in a sub-window multiple timeframes of the same indicator with its divergences. See the example shown in the picture below. But the display isn't like a simple MTF indicator. This is the real display of the indicator on its timeframe. Here's the options available in the FFx divergences indicator: Select the timeframes to be displayed (M1 to Monthly) Define the width (number of bars) for each tim
The purpose of this new version of the MT4 standard indicator provided in your platform is to display in a sub-window multiple timeframes of the same indicator with its divergences. See the example shown in the picture below. But the display isn't like a simple MTF indicator. This is the real display of the indicator on its timeframe. Here's the options available in the FFx divergences indicator: Select the timeframes to be displayed (M1 to Monthly). Define the width (number of bars) for each ti
The FFx Dashboard MTF alerter will show you on a single chart all the timeframes (M1 to Monthly) with their own status for the indicator. 2 Alert Options: Single timeframe: each selected timeframe alert separately when a signal occurs Multi timeframes: all selected timeframes must agree for an alert to be triggered Both options have an input to select the timeframes to be used for the alert(s). How to Understand the Status: Green/Red square: histogram above/below 0 line Green square + Red bord
Filter:
No reviews
Reply to review