Confluence Level Map
- Indicators
-
Kazuma Uezono
 MQL5 / MQL4 / Pine Script v6 developer and active trader.
Seller on the MQL5 Market (indicators for MT4/MT5).
Services:
- TradingView Pine Script to MT5/MT4 conversion (bar-by-bar matching, with tester report)
- MT4 to MT5 migration - Version: 1.2
- Activations: 5
Confluence Level Map finds the price areas where several commonly watched levels sit close together, merges them into zones and gives each zone a score. The levels are volume profile POC / VAH / VAL of the previous day and week, daily / weekly / monthly pivot points, the previous day, week and month high, low and close, Fibonacci levels of the recent swing, and round numbers.
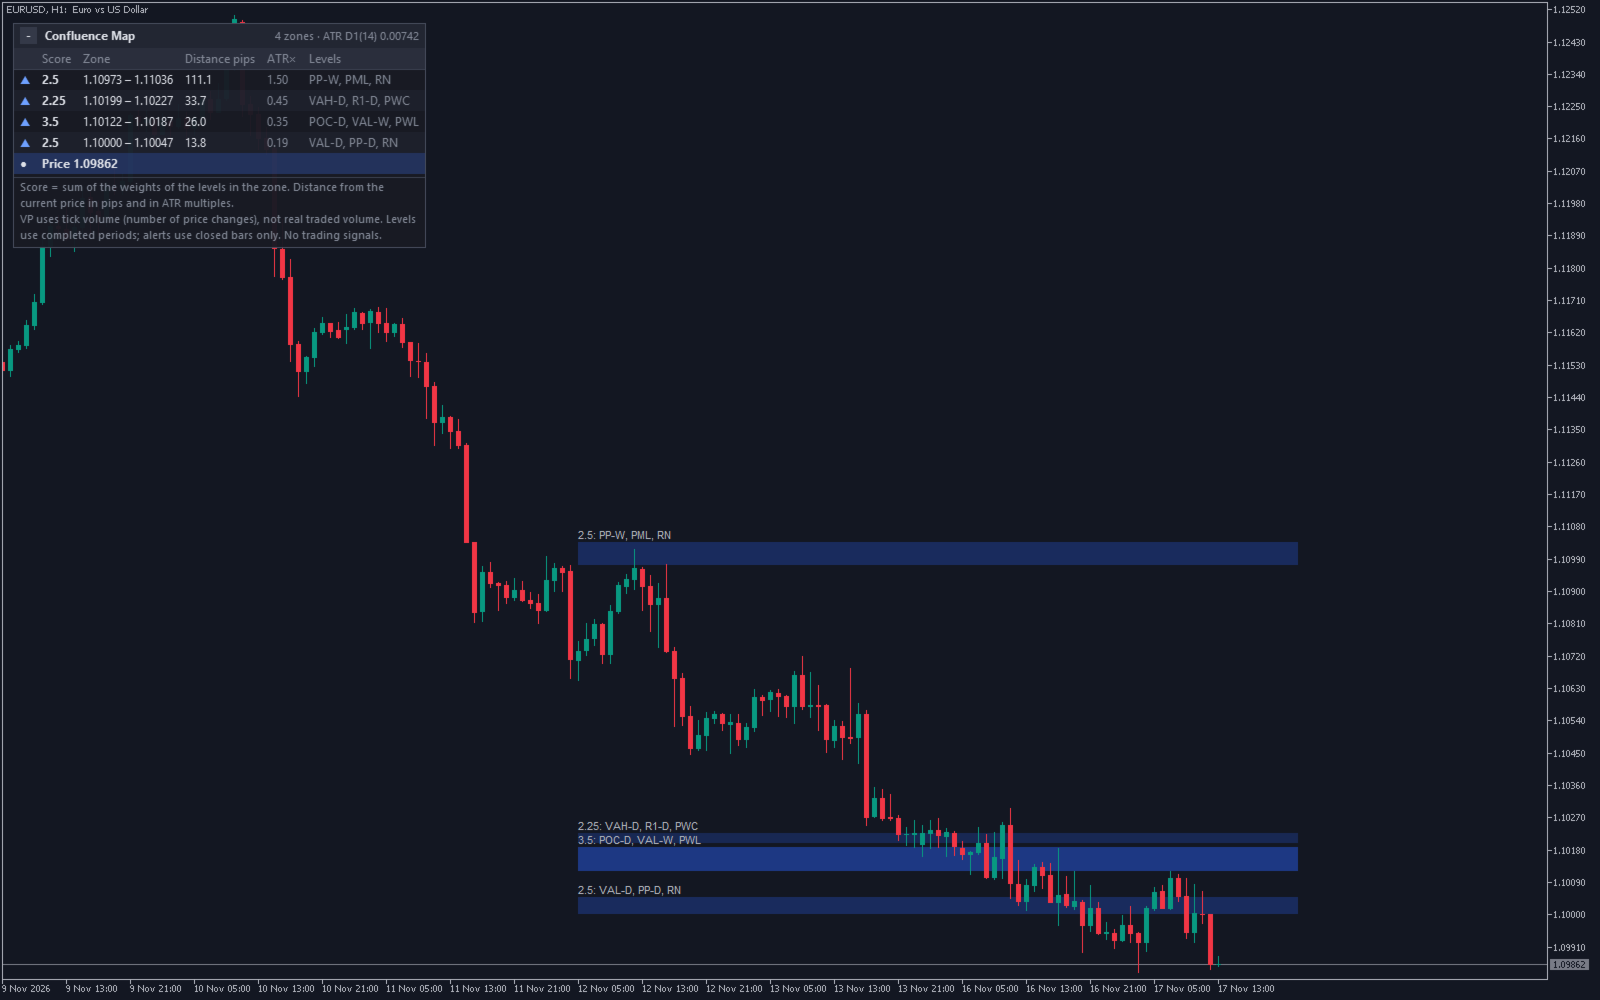
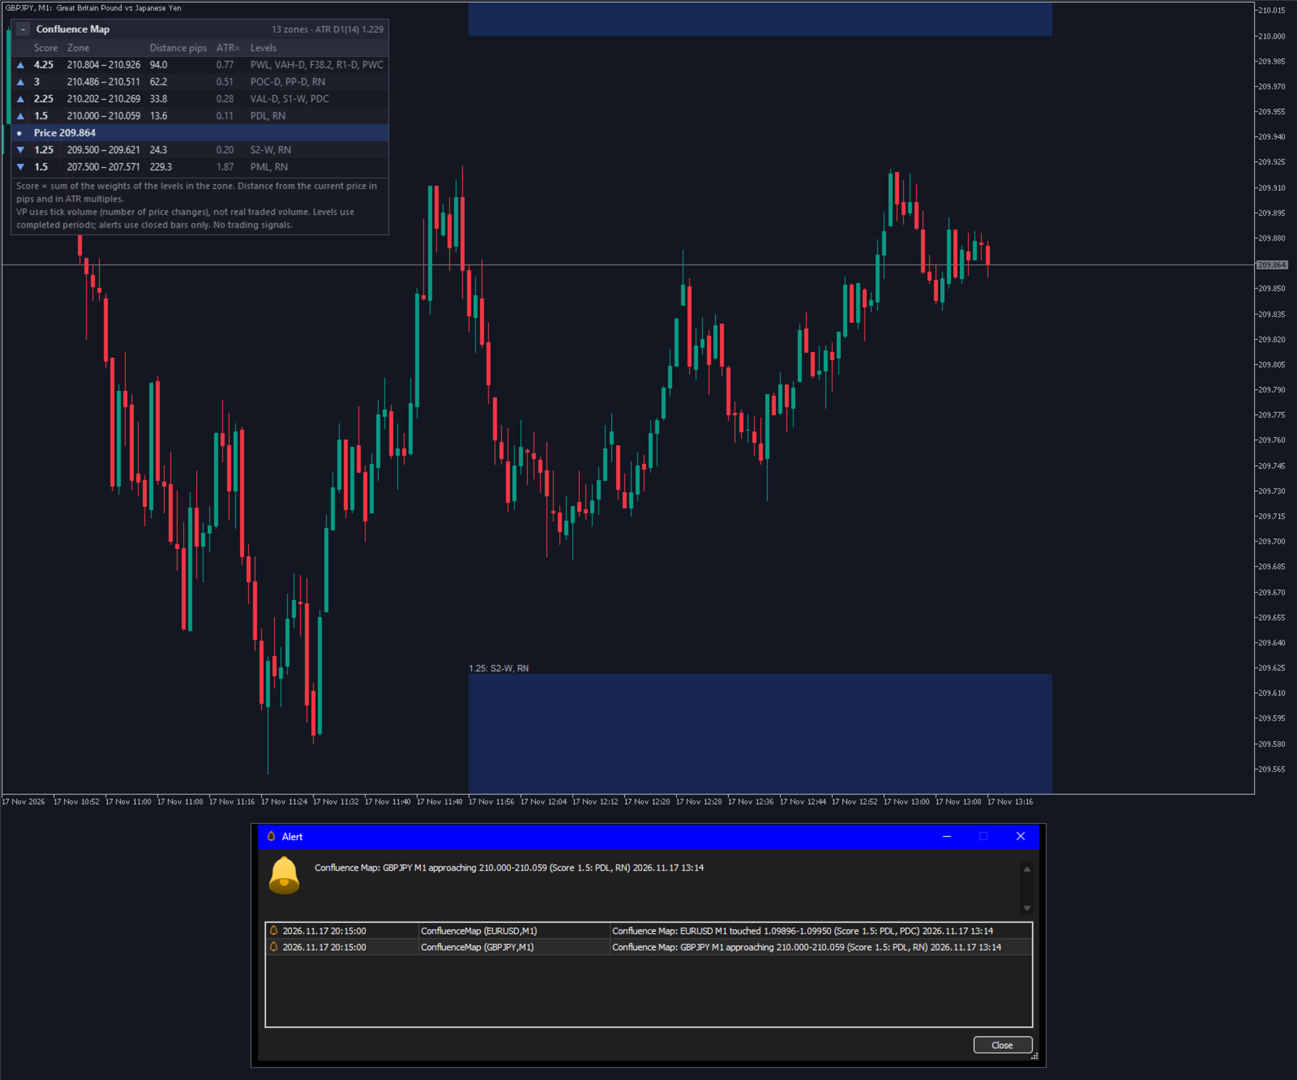
Every zone shows which levels it contains, so you can see why it is there. A panel lists the nearest zones above and below the price with their distance. The indicator is a map of levels for your own analysis. It does not give trading signals, does not predict whether price will react at a zone and never places orders.
Features
- Five level groups, each can be switched on or off and has its own weight: volume profile (previous day and previous week), pivot points (Traditional, Classic, Fibonacci, Woodie, Camarilla; 1-3 support and resistance levels per side), previous day / week / month high, low and close, Fibonacci of the recent swing, round numbers.
- Zones: levels that lie within the merge width are combined into one zone. The merge width is an ATR multiple (default 0.10 x ATR(14) of D1) or a number of pips.
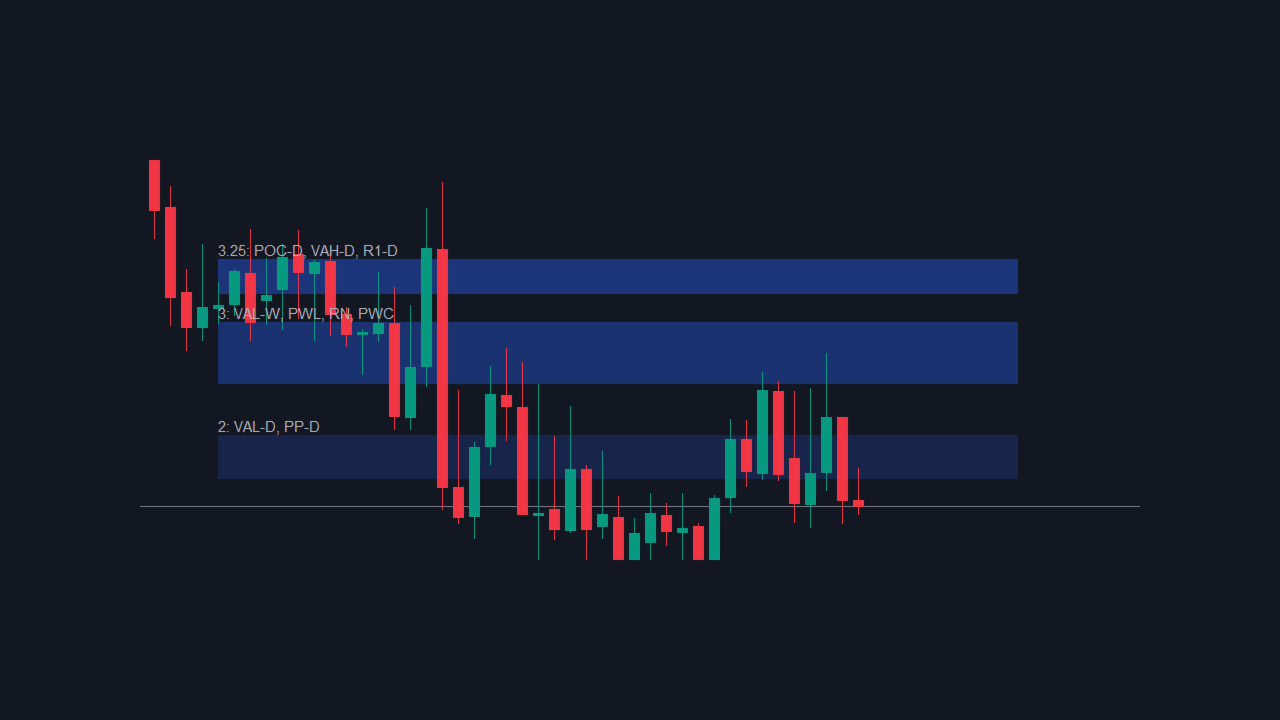
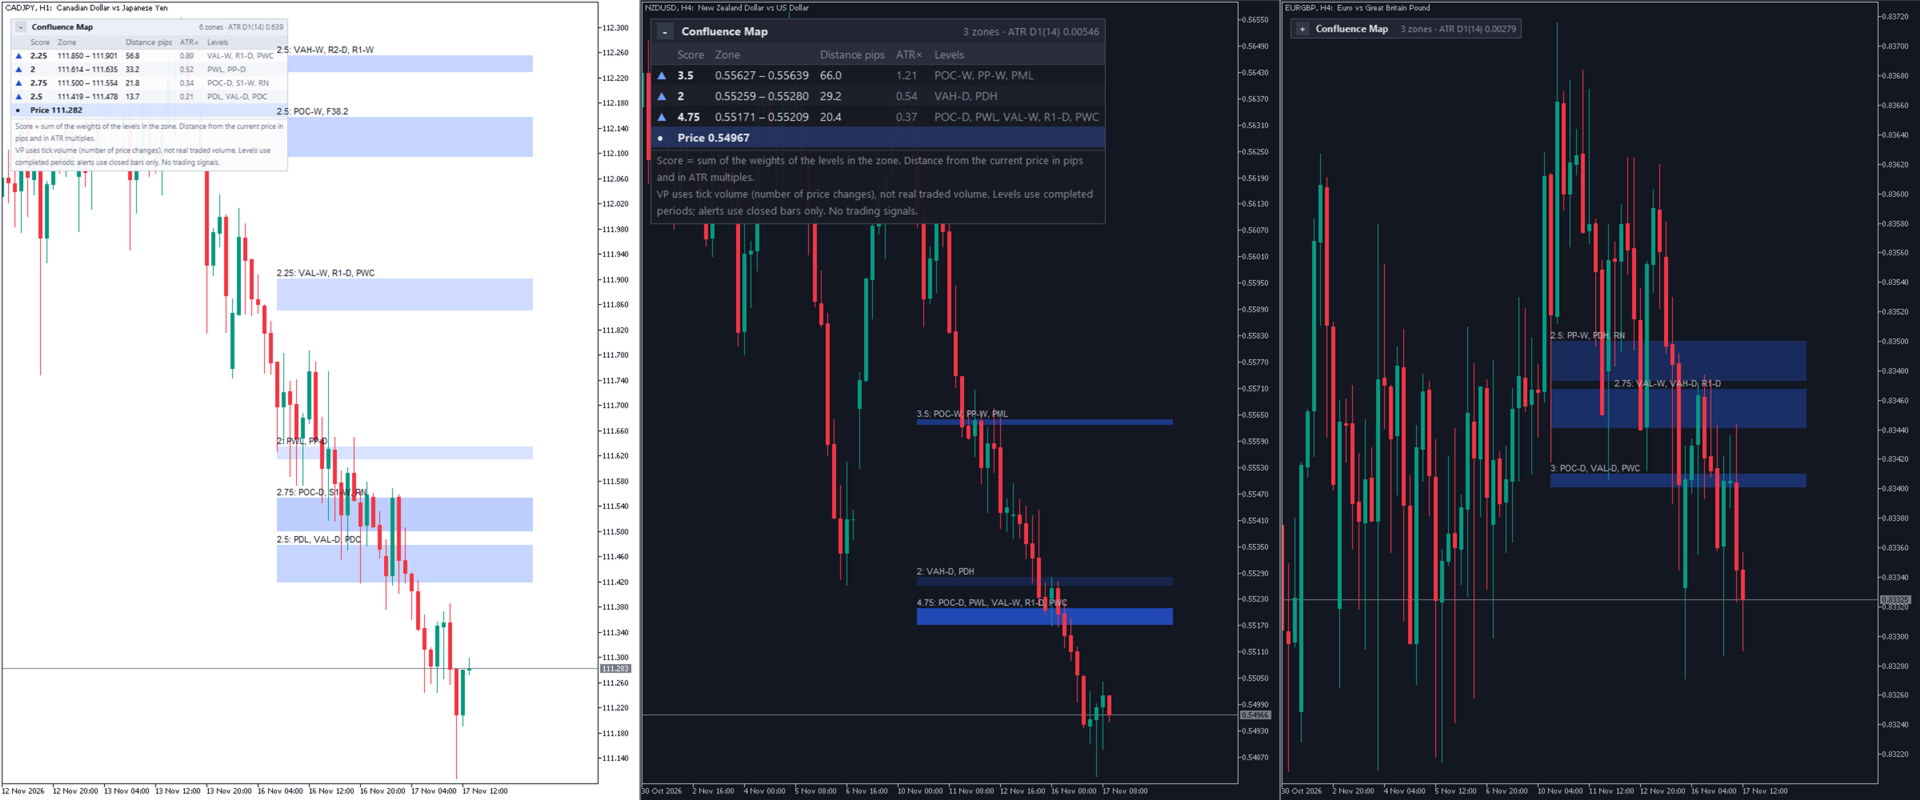
- Score = sum of the weights of the levels in the zone. Zones below the minimum score are hidden; the color gets stronger as the score rises.
- Each zone is drawn as a band with a label such as "3.5: POC-W, PDH, R1-D, RN". Hover over a band to see all its levels and its price range.
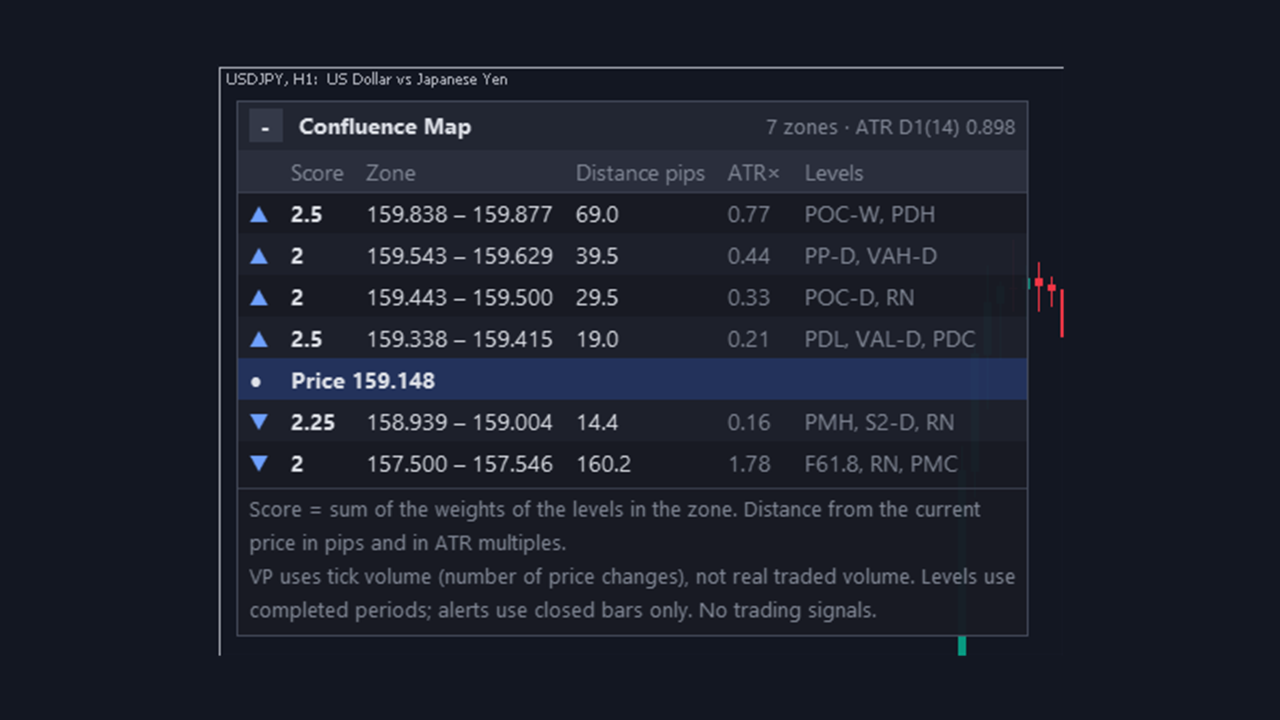
- Panel: nearest zones above and below the price (1-10 each side, default 4) with score, price range, distance in pips (or as a price difference on non-FX symbols), distance in ATR multiples and the level names.
- Alerts on closed bars: when a bar touches a zone, and optionally when a bar closes near a zone. Pop-up, sound, push notification and e-mail. No repeated alert for the same bar, also after a terminal restart.
- 11 panel languages (Auto follows the terminal), three sizes, automatic light or dark colors, collapse button, four corners. Up to 8 copies on one chart with different settings.
Main Inputs
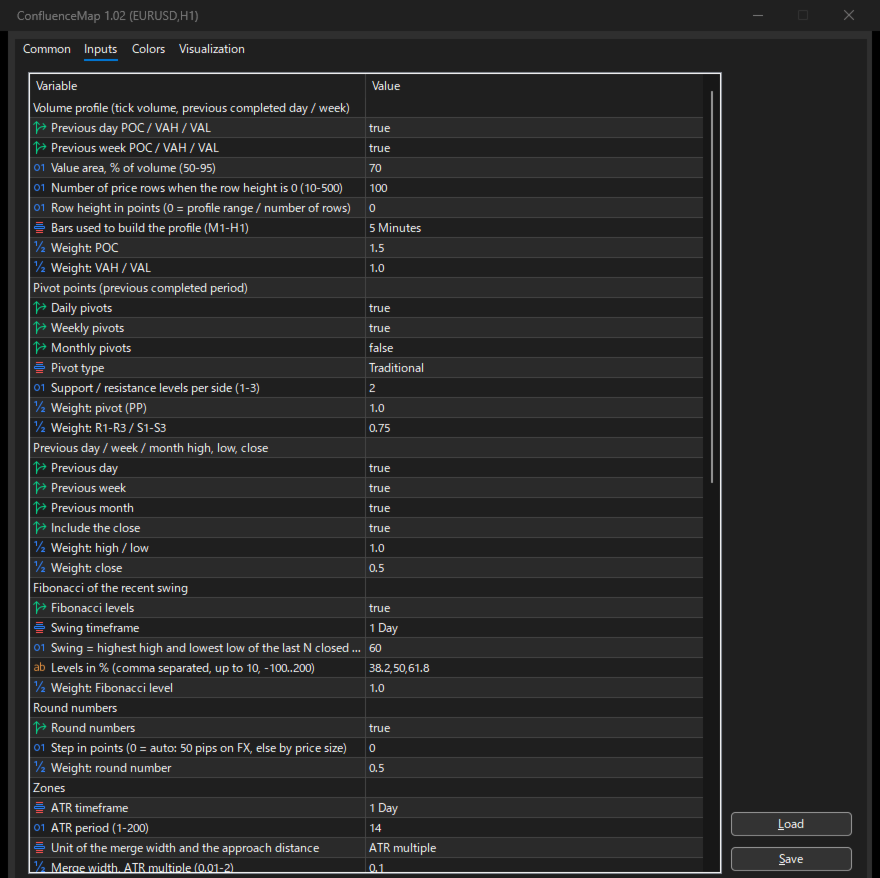
- Volume profile: previous day / previous week on or off, value area % (default 70), number of rows (default 100) or row height in points, bars used to build the profile (M1-H1, default M5), weights for POC and VAH / VAL.
- Pivot points: daily / weekly / monthly, pivot type, levels per side, weights.
- Previous day / week / month: on or off, include the close, weights.
- Fibonacci: swing timeframe (default D1), number of closed bars for the swing (default 60), levels in % (default 38.2, 50, 61.8; up to 10), weight.
- Round numbers: step in points (0 = automatic), weight.
- Zones: ATR timeframe and period, unit (ATR multiple or pips), merge width, range of levels used (default 3 ATR from the price), minimum score (default 2), score drawn at full color (default 5), skip Saturday / Sunday daily bars.
- Chart, panel and alert settings.
How It Is Calculated
- All levels come from completed periods only. The current day, week and month are not used.
- Volume profile: the tick volume of each bar of the chosen source timeframe is spread evenly over that bar's low-high range. POC = middle of the row with the most volume. The value area grows from the POC toward the larger neighbouring row until it holds the chosen percentage.
- Fibonacci: highest high and lowest low of the last N closed bars of the swing timeframe. If the high is the newer of the two, the levels are measured down from the high; otherwise up from the low.
- Levels are sorted by price. A level joins a zone when it is within the merge width of the zone's lowest level, so a zone is never taller than the merge width.
- Only levels within the chosen ATR range of the last closed bar's close are used. The zones are rebuilt on every new closed bar.
- Touch = the closed bar's high-low range overlaps the zone and the bar before did not. Near = the closed bar closes within the approach distance of the zone and the bar before was neither touching nor near.
Notes and Limits
- A zone is a place where several levels meet. It is not a prediction, and the score is not a win rate or a probability. Price can move straight through a zone with a high score. Trade decisions are your own.
- The bands are the current zones drawn back to the left of the chart for easy reading. They are not the levels that were valid on those past bars, so past price reactions to a band cannot be used as a test of the indicator. Where two widened bands would overlap, both are cut at the midpoint between them.
- Volume profile uses tick volume (the number of price changes), not real traded volume. The weekly profile needs the previous week's history of the source timeframe (M5 by default).
- Day, week and month follow the broker's server time. The weekly bar starts on Sunday. For symbols that trade on weekends (for example crypto), set "Skip Saturday / Sunday" to false.
- Pips are used on FX symbols with 3 or 5 digits. Other symbols show distances as a price difference. The automatic round-number step is 50 pips on such FX symbols and depends on the price size on other symbols; it is widened when too many lines would fall in the range. Set the step in points if you prefer your own.
- Alerts use closed bars only and are not sent in the Strategy Tester. After a restart only the latest closed bar is checked; bars that closed while the terminal was off are not alerted. No alerts are sent while the chart history is more than 4 days old (still loading).
- While history is loading, the panel shows "Loading history" with the reason. If the data are still incomplete after 30 seconds, the zones are built from the history available. After a timeframe change the previous zones can stay on screen for a short time.
- Labels use up to 3 columns. A long label can be cut off at the right edge of the chart.
- Push notifications and e-mail need the terminal's own settings.
Compatibility and Support
- MetaTrader 5 only. The MetaTrader 4 version is a separate product.
- No DLLs, no internet access (no WebRequest), no orders.
- A PDF user guide (English or Japanese) is sent on request through MQL5 messages after purchase.
- Support through MQL5 messages, reply within 3 business days, for installation, settings and bug reports. We cannot answer questions about market views, which zone to trade or trade decisions.