Adaptive Stochastic Bands

# Adaptive Stochastic Bands - Soglie che si muovono

*Categoria: Oscillatori | Difficolta: intermedio | Finestra: finestra separata sotto il grafico | Mercati: Universale (Forex, indici, materie prime, crypto, azioni) | Timeframe consigliati: M15, M30, H1, H4, D1*

## Descrizione breve

> Oscillatore con bande calcolate sulla propria distribuzione recente invece che con soglie fisse. In un trend forte le bande si alzano e i falsi segnali contrari spariscono.

## Descrizione lunga

### Panoramica

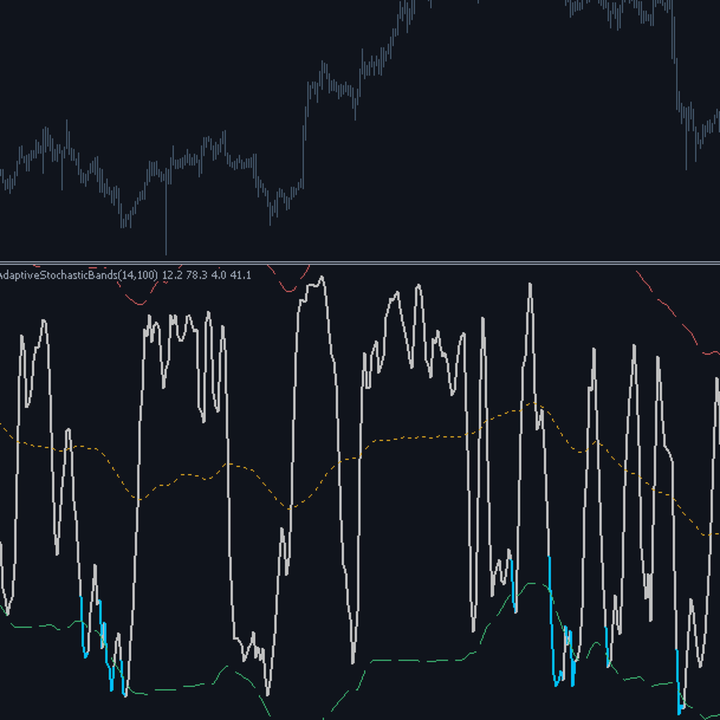
Le soglie fisse di ipercomprato e ipervenduto sono il difetto piu noto degli oscillatori a scala limitata: in un trend forte l'oscillatore resta appiccicato alla soglia per decine di barre e ogni segnale contrario e una perdita. La soluzione abituale, alzare manualmente le soglie, funziona solo finche il trend dura e va rifatta a ogni cambio di regime. Questo indicatore sostituisce le soglie fisse con bande calcolate sulla distribuzione recente dell'oscillatore stesso: la banda superiore e la media piu un multiplo della deviazione standard, quella inferiore la media meno lo stesso multiplo. In un trend forte le bande si alzano insieme all'oscillatore e i falsi segnali contrari spariscono da soli; nelle fasi laterali si restringono attorno al centro e la sensibilita aumenta esattamente quando serve.

### Come funziona il calcolo

1. L'oscillatore grezzo e la posizione della chiusura dentro l'escursione massima delle ultime InpKPeriod barre.
2. Un'escursione nulla, possibile su strumenti fermi, restituisce il valore centrale invece di causare una divisione per zero.
3. L'oscillatore viene lisciato su InpSmooth barre.
4. Su una finestra di InpBandWin barre si calcolano media e deviazione standard dell'oscillatore lisciato.
5. Le bande sono la media piu e meno InpBandMult volte la deviazione standard, con una distanza minima garantita.
6. La distanza minima e indispensabile: in una fase estremamente stabile la deviazione standard tenderebbe a zero e le bande collasserebbero sulla linea centrale.

### Come si usa

- Considerare estremo solo il superamento della banda, non un valore assoluto: e questa la differenza rispetto a un oscillatore ordinario.
- Bande larghe indicano un oscillatore che ha percorso molta scala di recente, tipico delle fasi laterali ampie.
- Bande strette e alte descrivono un trend: l'oscillatore vive stabilmente in alto e le bande lo seguono.
- La linea centrale e la media recente dell'oscillatore e funziona come riferimento di equilibrio dinamico.
- Aumentare InpBandMult per un indicatore piu selettivo, che segnala solo gli scostamenti davvero eccezionali.

### A chi e rivolto e su quali timeframe

E adatto a chi usa oscillatori e ha sperimentato il problema dei falsi segnali nei trend, cioe praticamente chiunque abbia provato a vendere un ipercomprato in un mercato direzionale. Funziona su tutti i timeframe da M15 in su. Non richiede preparazione statistica per essere usato, anche se capire cosa sia una deviazione standard aiuta a scegliere il moltiplicatore. E utile anche come componente dentro sistemi piu complessi, al posto di un oscillatore a soglie fisse.

### Esempio pratico di lettura del segnale

Su XAUUSD H4 il mercato entra in un trend rialzista forte. Un oscillatore classico raggiunge 80 e vi resta per venti barre: chi vende a ogni tocco della soglia accumula venti perdite. Qui la banda superiore, che all'inizio era a 78, sale progressivamente fino a 91 seguendo la distribuzione dell'oscillatore: l'oscillatore a 80 e ora dentro le bande e non produce alcun segnale. Solo quando raggiunge 94, cioe un valore eccezionale anche per un trend in corso, supera la banda e viene colorato. Nel frattempo la linea centrale si e alzata da 50 a 72, mostrando visivamente che l'equilibrio del mercato si e spostato.

## Elenco parametri di input

| Parametro | Default | Descrizione |
|---|---|---|
| `InpKPeriod` | 14 | Periodo dell'escursione su cui si calcola l'oscillatore. |
| `InpSmooth` | 3 | Lisciatura dell'oscillatore grezzo, che senza di essa risulterebbe molto nervoso. |
| `InpBandWin` | 100 | Finestra su cui si calcolano le bande adattive. Determina quanto rapidamente le soglie si adeguano a un nuovo regime. |
| `InpBandMult` | 1.60 | Ampiezza delle bande in deviazioni standard. Valori alti rendono l'indicatore piu selettivo. |
| `InpMinSpread` | 8.0 | Distanza minima garantita fra centro e banda. Impedisce che le bande collassino sulla linea centrale in fasi eccezionalmente stabili. |

## Vantaggi / punti di forza

- Elimina il difetto piu costoso degli oscillatori a soglia fissa senza richiedere alcuna ritaratura manuale.
- Le bande sono visibili sul grafico, quindi si vede sempre quanto manchi al prossimo segnale.
- La linea centrale mostra lo spostamento dell'equilibrio del mercato, informazione che un oscillatore ordinario non fornisce.
- La distanza minima garantita evita la degenerazione geometrica nelle fasi eccezionalmente stabili.

## Limitazioni e avvertenze

- Le bande si adattano con ritardo: all'inizio di un trend forte producono ancora qualche falso segnale prima di alzarsi.
- In un trend molto prolungato le bande possono alzarsi cosi tanto da rendere l'indicatore quasi silenzioso.
- Il valore assoluto dell'oscillatore perde il significato abituale: chi e abituato a leggere 70 come ipercomprato deve cambiare abitudine.
- Cinque linee nella stessa sottofinestra richiedono un minimo di abitudine per essere lette rapidamente.

**Nessun repaint:** i valori pubblicati su una barra chiusa non vengono piu modificati.

**Disclaimer.** Questo prodotto e uno strumento di analisi tecnica, non un sistema di trading automatico, e non fornisce alcuna garanzia di profitto. I mercati finanziari comportano il rischio di perdita totale del capitale investito. Le performance passate non sono indicative dei risultati futuri. Ogni segnale prodotto va sempre confermato con la propria analisi, un piano di money management e un test preventivo su conto demo. L'autore non e responsabile di decisioni operative prese sulla base di questo indicatore.

## Tag / parole chiave suggerite per MQL5

`oscillator`, `stochastic`, `adaptive`, `bands`, `overbought`, `trend filter`, `no repaint`, `dynamic threshold`
More from author
# Adaptive Slope Ribbon - ATR-normalised regression slope ribbon *Category: Trend | Difficulty: intermediate | Window: separate window below the chart | Markets: Universal (Forex, indices, commodities, crypto, stocks) | Suggested timeframes: M15, M30, H1, H4, D1* ## Short description > Five linear regression slopes over growing horizons, normalised in ATR units and comparable across instruments. The histogram shows the mean slope coloured by the level of agreement between time scales. ## Fu
# Fractal Trend Channel - Structural channel from confirmed swings *Category: Trend | Difficulty: beginner | Window: chart window (overlaid on price) | Markets: Universal (Forex, indices, commodities, crypto, stocks) | Suggested timeframes: M15, M30, H1, H4, D1* ## Short description > Step channel built from the last confirmed fractal swings, with a midline coloured by market structure: higher highs and lows, lower highs and lows, or mixed structure. ### Overview Reading structure through
# Volatility Adaptive MA - Variable speed moving average *Category: Trend | Difficulty: intermediate | Window: chart window (overlaid on price) | Markets: Universal (Forex, indices, commodities, crypto, stocks) | Suggested timeframes: M5, M15, M30, H1, H4* ## Short description > A moving average whose smoothing factor is driven by the ratio between short and long term volatility: it accelerates during breakouts and slows down in compressed phases, cutting false crossovers. ### Overview Eve
# Trend Persistence Index - Persistence versus randomness *Category: Trend | Difficulty: advanced | Window: separate window below the chart | Markets: Universal (Forex, indices, commodities, crypto, stocks) | Suggested timeframes: M30, H1, H4, D1* ## Short description > Compares the direction changes actually observed with those expected from a purely random series. Above zero the market persists in one direction, below zero it keeps flipping. ### Overview In a random walk the sign of the
# Kalman Trend Filter - Level and velocity Kalman filter *Category: Trend | Difficulty: advanced | Window: chart window (overlaid on price) | Markets: Universal (Forex, indices, commodities, crypto, stocks) | Suggested timeframes: M15, M30, H1, H4, D1* ## Short description > A two state Kalman filter that simultaneously estimates price level and velocity. The gain self-adjusts: it trusts the model when data are consistent and re-adapts immediately to shocks. ### Overview The Kalman filter
# Multi Scale Trend Agreement - Consensus across eight horizons *Category: Trend | Difficulty: beginner | Window: separate window below the chart | Markets: Universal (Forex, indices, commodities, crypto, stocks) | Suggested timeframes: M5, M15, M30, H1, H4, D1* ## Short description > Checks price position against its own average on eight geometrically spaced scales and condenses the result into a single score from -100 to +100. ### Overview A trend worth the name is recognised from whatev
# Directional Efficiency - Net path versus gross path *Category: Trend | Difficulty: intermediate | Window: separate window below the chart | Markets: Universal (Forex, indices, commodities, crypto, stocks) | Suggested timeframes: M15, M30, H1, H4, D1* ## Short description > Signed ratio between the net distance travelled by price and the gross path actually covered. It separates straight trends from disorderly advances that burn capital. ### Overview Two markets can rise by the same amoun
# Trend Age Counter - Regime age versus typical duration *Category: Trend | Difficulty: intermediate | Window: separate window below the chart | Markets: Universal (Forex, indices, commodities, crypto, stocks) | Suggested timeframes: M30, H1, H4, D1* ## Short description > Counts how many bars the current regime has lasted and compares it with the average duration of all past regimes on the same instrument. It measures trend maturity, not strength. ### Overview Every trend indicator answer
# Regression Confidence Baseline - Bands on residual error *Category: Trend | Difficulty: intermediate | Window: chart window (overlaid on price) | Markets: Universal (Forex, indices, commodities, crypto, stocks) | Suggested timeframes: M15, M30, H1, H4, D1* ## Short description > Linear regression baseline with bands built on the residual standard error instead of the price standard deviation. Bands widen when the move loses order, not when price runs. ### Overview Classic volatility band
# Trend Exhaustion Meter - Composite exhaustion score *Category: Trend | Difficulty: advanced | Window: separate window below the chart | Markets: Universal (Forex, indices, commodities, crypto, stocks) | Suggested timeframes: M30, H1, H4, D1* ## Short description > A 0 to 100 score combining stretch from the mean, directional saturation and momentum fade. It measures the continuation risk of a move, not its reversal. ### Overview No single symptom says a trend is about to end, but when se
# Normalized Momentum Z - Momentum in standard scores *Category: Momentum | Difficulty: intermediate | Window: separate window below the chart | Markets: Universal (Forex, indices, commodities, crypto, stocks) | Suggested timeframes: M15, M30, H1, H4, D1* ## Short description > Standardises momentum against its own recent historical distribution and returns a z score. A value of +2 marks a thrust stronger than roughly 97 per cent of the instrument recent moves. ### Overview Raw momentum ha
# Momentum Curvature - Acceleration versus velocity *Category: Momentum | Difficulty: intermediate | Window: separate window below the chart | Markets: Universal (Forex, indices, commodities, crypto, stocks) | Suggested timeframes: M15, M30, H1, H4, D1* ## Short description > Measures price acceleration, the second derivative of the smoothed series, and compares it with velocity. It detects loss of thrust before direction changes. ### Overview Anyone who drives knows the brake pedal acts o
# Rate Of Change Spectrum - Which horizon is driving *Category: Momentum | Difficulty: advanced | Window: separate window below the chart | Markets: Universal (Forex, indices, commodities, crypto, stocks) | Suggested timeframes: M30, H1, H4, D1* ## Short description > Standardises the rate of change over six horizons and identifies which one is driving the move. It shows the dominant scale score and its rank. ### Overview Knowing the market is rising tells you little. Knowing whether it ri
# Impulse Strength Gauge - Movement weighted by volume *Category: Momentum | Difficulty: intermediate | Window: separate window below the chart | Markets: Universal (Forex, indices, commodities, crypto, stocks) | Suggested timeframes: M5, M15, M30, H1, H4* ## Short description > Weights every bar by combining body size in ATR units with volume relative to its average, then accumulates the contributions. It separates wide but empty bars from genuinely supported impulses. ### Overview A wide
# Dual Horizon Momentum Delta - Short versus long, time corrected *Category: Momentum | Difficulty: advanced | Window: separate window below the chart | Markets: Universal (Forex, indices, commodities, crypto, stocks) | Suggested timeframes: M15, M30, H1, H4, D1* ## Short description > Compares momentum on two horizons after normalising them by the square root of time, a correction without which the long horizon would always look larger by pure construction. ### Overview Directly comparing
# Impulse Retrace Ratio - Impulse size versus retracement size *Category: Momentum | Difficulty: intermediate | Window: separate window below the chart | Markets: Universal (Forex, indices, commodities, crypto, stocks) | Suggested timeframes: M15, M30, H1, H4, D1* ## Short description > Groups consecutive same sign changes into runs and compares the average size of bullish runs with that of bearish ones. It measures whether impulses are larger, not more numerous. ### Overview A healthy upt
# Momentum Thrust Counter - Counting thrusts beyond threshold *Category: Momentum | Difficulty: beginner | Window: separate window below the chart | Markets: Universal (Forex, indices, commodities, crypto, stocks) | Suggested timeframes: M15, M30, H1, H4, D1* ## Short description > Counts bars moving beyond an ATR multiple and reports the net balance. The total line separates calm from battle, both of which show a balance near zero. ### Overview Most bars on a chart carry no information: t
# Momentum Divergence Scanner - Divergences without repaint *Category: Momentum | Difficulty: intermediate | Window: chart window (overlaid on price) | Markets: Universal (Forex, indices, commodities, crypto, stocks) | Suggested timeframes: M15, M30, H1, H4, D1* ## Short description > Flags price to momentum divergences using confirmed swings only. The arrow appears on confirmation and is never withdrawn, unlike almost every other divergence indicator. ### Overview Almost every divergence
# Elastic Momentum Band - Momentum driven asymmetric channel *Category: Momentum | Difficulty: intermediate | Window: chart window (overlaid on price) | Markets: Universal (Forex, indices, commodities, crypto, stocks) | Suggested timeframes: M15, M30, H1, H4* ## Short description > A channel deforming with momentum: the band favouring the move draws closer to the average, the opposite one moves away. It makes breaks in direction easier and counter breaks more selective. ### Overview A symm
# Momentum Entropy Filter - Order versus randomness in thrusts *Category: Momentum | Difficulty: advanced | Window: separate window below the chart | Markets: Universal (Forex, indices, commodities, crypto, stocks) | Suggested timeframes: M30, H1, H4, D1* ## Short description > Computes the Shannon entropy of the recent momentum distribution and converts it into an order score from 0 to 100. It separates markets with recurring structure from those without regularity. ### Overview Shannon e
# Realized Volatility Cone - Historical volatility percentiles *Category: Volatility | Difficulty: intermediate | Window: separate window below the chart | Markets: Universal (Forex, indices, commodities, crypto, stocks) | Suggested timeframes: M30, H1, H4, D1* ## Short description > Draws realized volatility together with the percentiles of its own historical distribution. It tells whether the current level is high or low for that specific instrument. ### Overview Knowing that realized vo
# Volatility Forecast EWMA - Forecasting the next bar *Category: Volatility | Difficulty: advanced | Window: separate window below the chart | Markets: Universal (Forex, indices, commodities, crypto, stocks) | Suggested timeframes: M15, M30, H1, H4, D1* ## Short description > Estimates next bar volatility with an EWMA model on variance, the same scheme used in portfolio risk management, alongside the volatility actually observed. ### Overview Every volatility indicator looks backwards and
# Volatility Regime Classifier - Classification with hysteresis *Category: Volatility | Difficulty: intermediate | Window: separate window below the chart | Markets: Universal (Forex, indices, commodities, crypto, stocks) | Suggested timeframes: M15, M30, H1, H4, D1* ## Short description > Classifies volatility into four regimes using a hysteresis state machine, eliminating the constant flipping typical of fixed thresholds. The active threshold is drawn. ### Overview Classifying volatility
# Garman Klass Volatility - An estimator using the whole OHLC *Category: Volatility | Difficulty: advanced | Window: separate window below the chart | Markets: Universal (Forex, indices, commodities, crypto, stocks) | Suggested timeframes: M15, M30, H1, H4, D1* ## Short description > A volatility estimator using open, high, low and close instead of closes only. Its ratio to the classic estimate separates intra-bar movement from close-to-close movement. ### Overview The standard deviation o
# Overnight Gap Risk - The risk stops cannot cover *Category: Volatility | Difficulty: intermediate | Window: separate window below the chart | Markets: Stocks | Suggested timeframes: H1, H4, D1* ## Short description > Splits each bar change into gap and intra-bar movement, and reports the share of risk attributable to gaps, the part no stop can protect against. ### Overview The risk of a position held past the close is not the same as that of the same position closed intraday, and the dif
# Volatility Breakout Projection - Levels projected from the open *Category: Volatility | Difficulty: beginner | Window: chart window (overlaid on price) | Markets: Universal (Forex, indices, commodities, crypto, stocks) | Suggested timeframes: M5, M15, M30, H1* ## Short description > Anchors a reference to each session open and projects two pairs of levels computed as fractions of the average daily range. Levels stay fixed for the whole session. ### Overview If an instrument covers on ave
# Compression Expansion Detector - Squeeze and release *Category: Volatility | Difficulty: intermediate | Window: separate window below the chart | Markets: Universal (Forex, indices, commodities, crypto, stocks) | Suggested timeframes: M15, M30, H1, H4, D1* ## Short description > Measures how far short term volatility has narrowed relative to the reference, counts how many bars the compression has lasted and highlights the bars following the release. ### Overview Volatility is not stable:
# Intraday Volatility Seasonality - Hourly volatility profile *Category: Volatility | Difficulty: intermediate | Window: separate window below the chart | Markets: Universal (Forex, indices, commodities, crypto, stocks) | Suggested timeframes: M5, M15, M30, H1* ## Short description > Builds the instrument average hourly volatility profile and compares it with the actual range of the current bar. It separates normally quiet hours from genuine anomalies. ### Overview Intraday volatility is n
# Downside Upside Vol Ratio - Risk asymmetry *Category: Volatility | Difficulty: intermediate | Window: separate window below the chart | Markets: Universal (Forex, indices, commodities, crypto, stocks) | Suggested timeframes: H1, H4, D1* ## Short description > Computes two separate semi-deviations, one on negative returns only and one on positive ones, and reports their proportion. It measures an asymmetry standard deviation conceals. ### Overview Standard deviation treats an upward and a
# Volatility Shock Decay - Half-life of post-shock recovery *Category: Volatility | Difficulty: advanced | Window: separate window below the chart | Markets: Universal (Forex, indices, commodities, crypto, stocks) | Suggested timeframes: H1, H4, D1* ## Short description > Estimates the persistence coefficient of volatility and derives its half-life, how many bars a deviation from normal needs to halve. It also shows the size of the current shock. ### Overview When volatility explodes, the
Filter:
No reviews
Reply to review