GC Figures MT5
- Indicators
- Version: 1.0
- Activations: 15

SYSTEM INITIALIZATION SEQUENCE...
MARKET STRUCTURE SCANNER... OK
TRIANGLES AND WEDGES... OK
FLAGS AND PENNANTS... OK
CHANNELS AND RANGES... OK
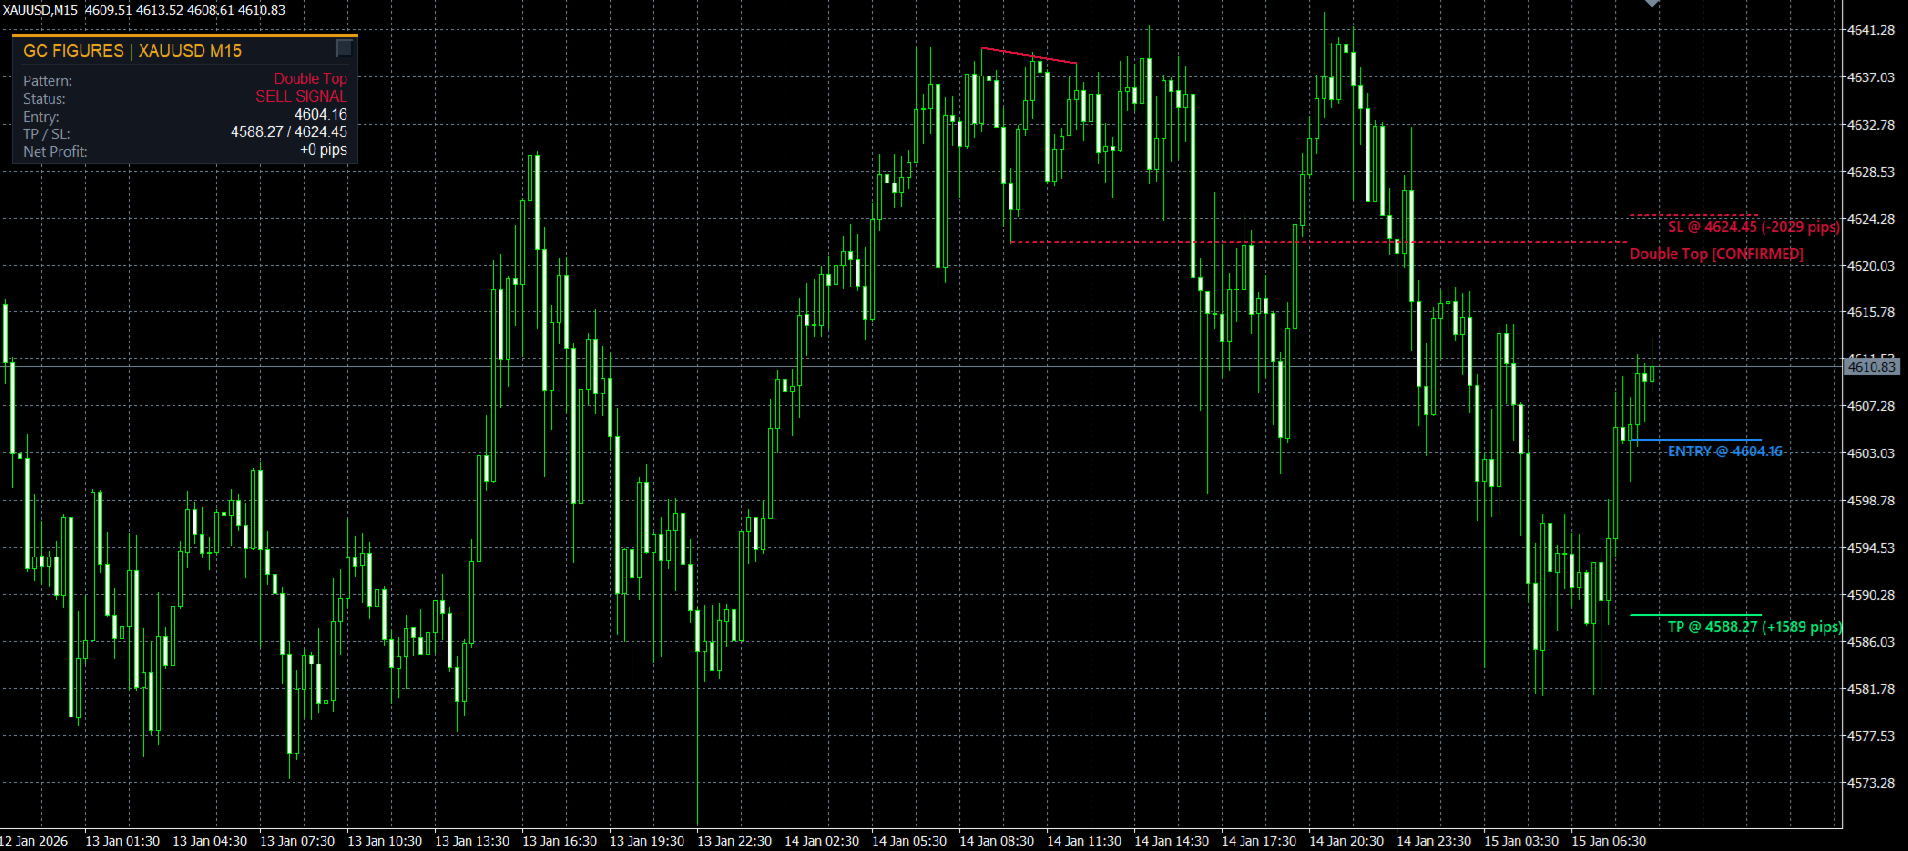
DOUBLE AND TRIPLE TOPS/BOTTOMS... OK
BREAKOUT CONFIRMATION FILTERS... OK
ENTRY / TP / SL CALCULATION... OK
INTERACTIVE INFORMATION PANEL... OK
STATUS: READY FOR DEPLOYMENT.
“Greetings, Operator. I am GC Figures.
My mission is to detect chart patterns on Gold, confirm breakouts, and provide calculated Entry, Take Profit and Stop Loss levels.”
HOW THE INDICATOR WORKS
GC Figures is a chart-pattern indicator for MetaTrader 5, developed specifically for XAUUSD analysis on M15 and M30.
The system analyzes confirmed swing highs and lows, evaluates pattern geometry, tracks the current formation state and waits for a confirmed breakout.
The indicator does not open, close or manage trades. The final trading decision always remains with the trader.
SUPPORTED CHART PATTERNS
- Symmetrical, ascending and descending triangles;
- Bullish falling and bearish rising wedges;
- Bullish and bearish flags;
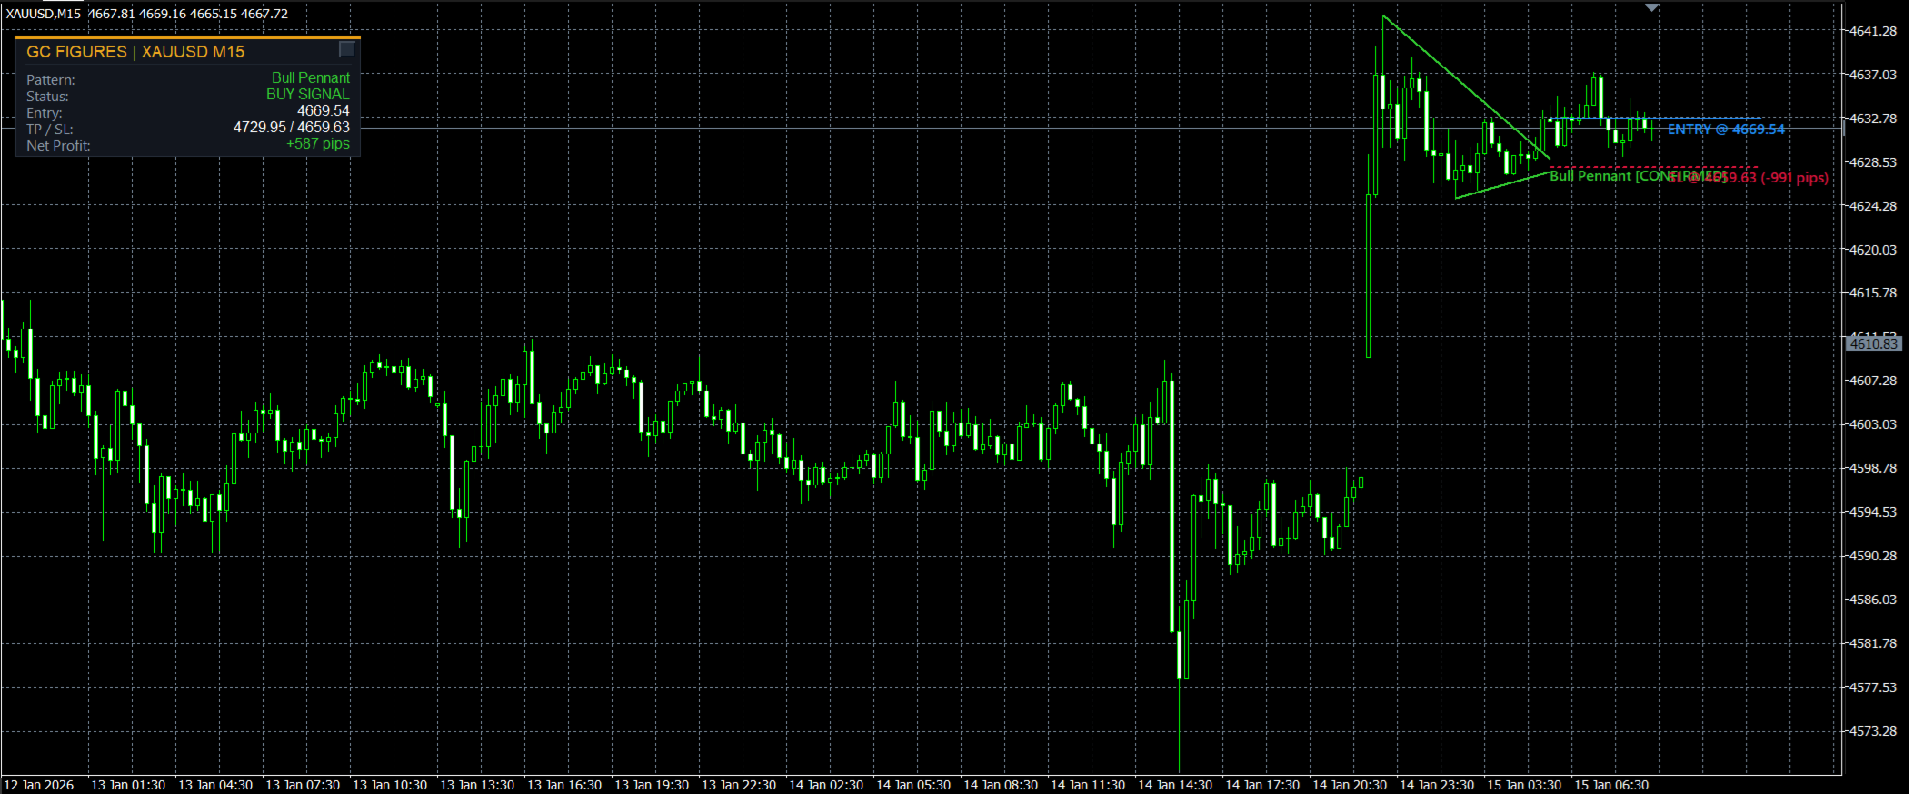
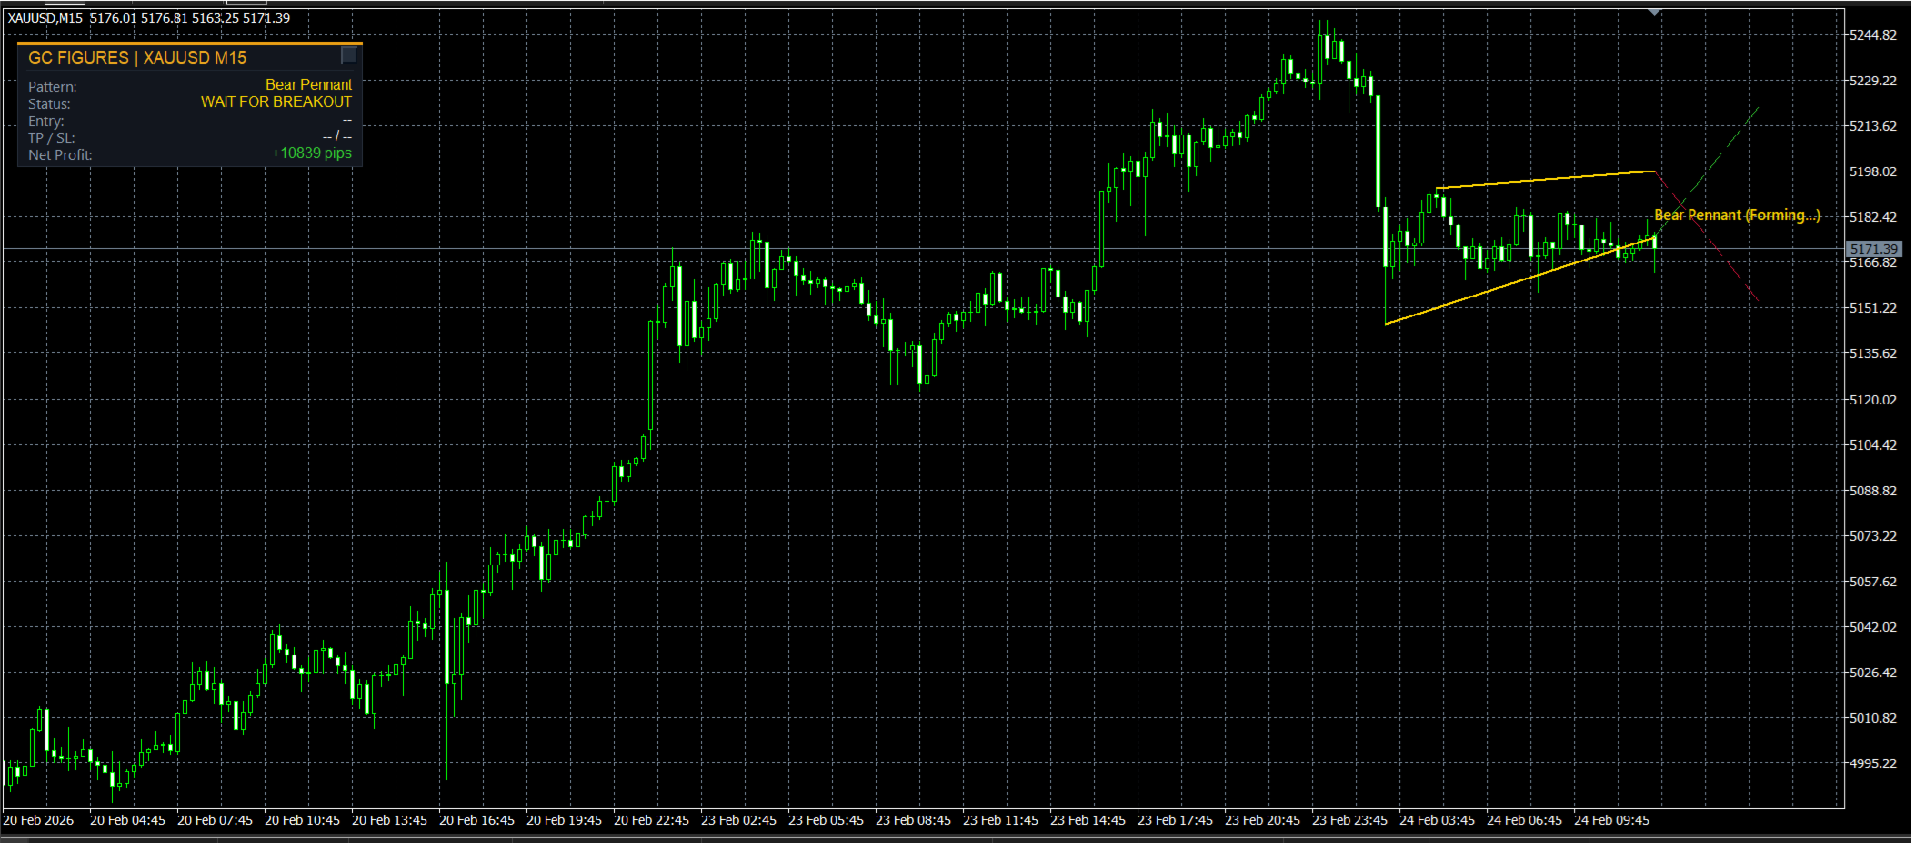
- Bullish and bearish pennants;
- Ascending and descending channels;
- Rectangle and range formations;
- Double and triple tops;
- Double and triple bottoms.
SIGNAL LOGIC
- Scanning: the indicator analyzes confirmed market swing points.
- Formation: a detected structure is displayed with the FORMING status. Its geometry may change while the pattern is incomplete.
- Confirmation: the system waits for a candle to close beyond the pattern boundary and checks the built-in filters.
- Signal: after confirmation, the indicator displays BUY or SELL, Entry, one TP and one SL.
- Result: when TP or SL is reached, the result is added to the session statistics in pips.
After confirmation, Entry, TP and SL remain fixed. There is no trailing stop, Break-Even or hidden trade management.
INFORMATION PANEL
- Pattern — currently detected chart pattern;
- Status — scanning, waiting for breakout or confirmed BUY/SELL signal;
- Entry — calculated entry price;
- TP / SL — target and protective levels;
- Net Profit — cumulative result of completed signals in pips for the current session.
The panel can be moved and minimized. Net Profit can be hidden with the ShowProfitPips setting.
QUICK START
- Open an XAUUSD chart.
- Select M15 or M30. M15 is the primary timeframe.
- Attach the indicator to the chart. The recommended signal profile is already built into its core.
INPUT PARAMETERS
- EnableTriangles — triangles and wedges;
- EnableFlagsPennants — bullish and bearish flags and pennants;
- EnableRawChannels — channels and rectangle formations;
- EnableDoubleTops — double and triple tops and bottoms;
- ShowProjections — pattern and target projections;
- ShowHUDPanel — information panel;
- ShowProfitPips — signal result in pips;
- ShowHistoricalSignals — saved BUY/SELL arrows from the current session;
- ShowHistoricalLevels — saved TP/SL markers from the current session;
- ColorBullish / ColorBearish / ColorForming — chart-pattern colors;
- AlertOnBreakout — breakout notifications;
- EnablePopUpAlert / EnablePushAlert / EnableSoundAlert — notification types.
IMPORTANT INFORMATION
Net Profit is the internal result of model signals in pips, not trading-account profit. It does not include lot size, spread, commission, swap or broker slippage. Session statistics may restart when the indicator or terminal is restarted.
RISK WARNING
Trading Gold and other financial instruments involves significant risk. No indicator can guarantee profit. Historical and demonstration results do not guarantee similar future performance. Test the system on historical data and a demo account before using its signals in live trading.
Contact the author:
Golden Commander developer profile on MQL5