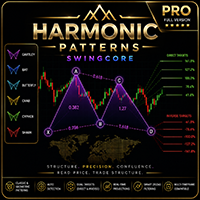
Harmonic Patterns SwingCore Pro
- Indicators
-
Nestor Jose Mendez Boza
 Quantitative Trading Systems Designer and Time Series Analysis Researcher
 - Version: 1.0
- Activations: 10
Harmonic Patterns SwingCore Pro | For MetaTrader 5 (MT5)
Technical analysis indicator for detecting and visualizing harmonic patterns on the chart, with Fibonacci level projection and configurable alert system.
================================================================================
WHAT THIS INDICATOR IS
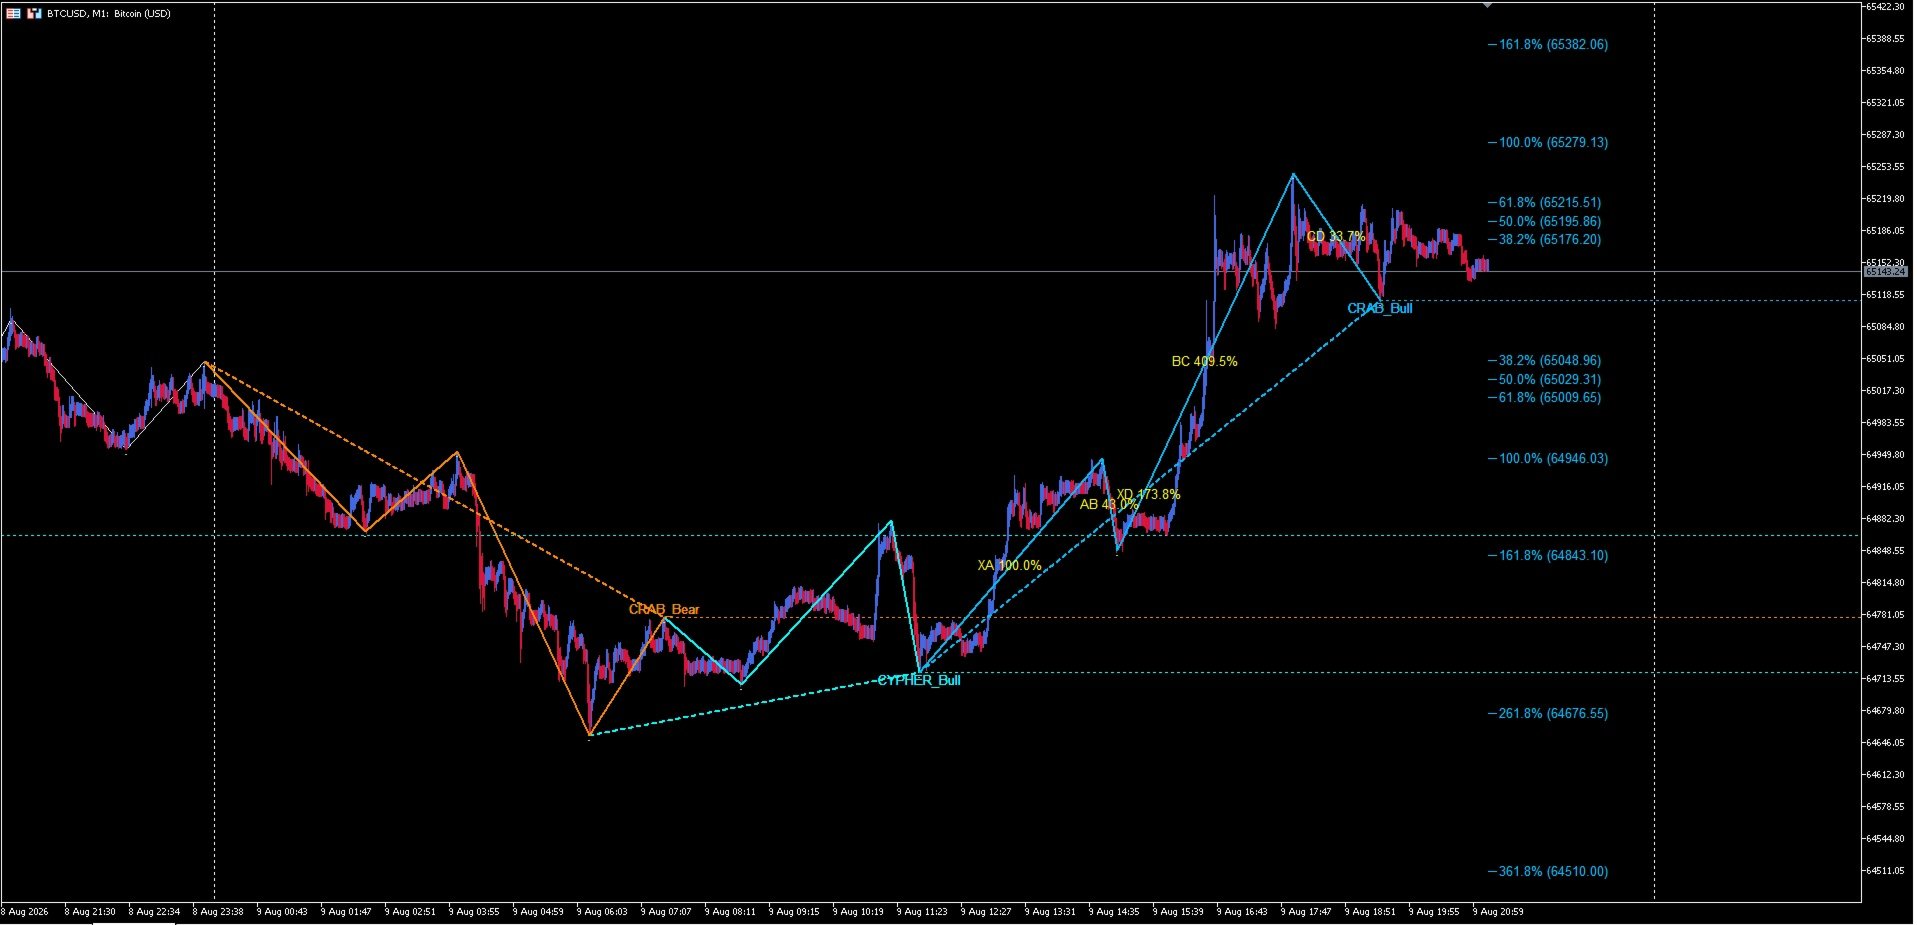
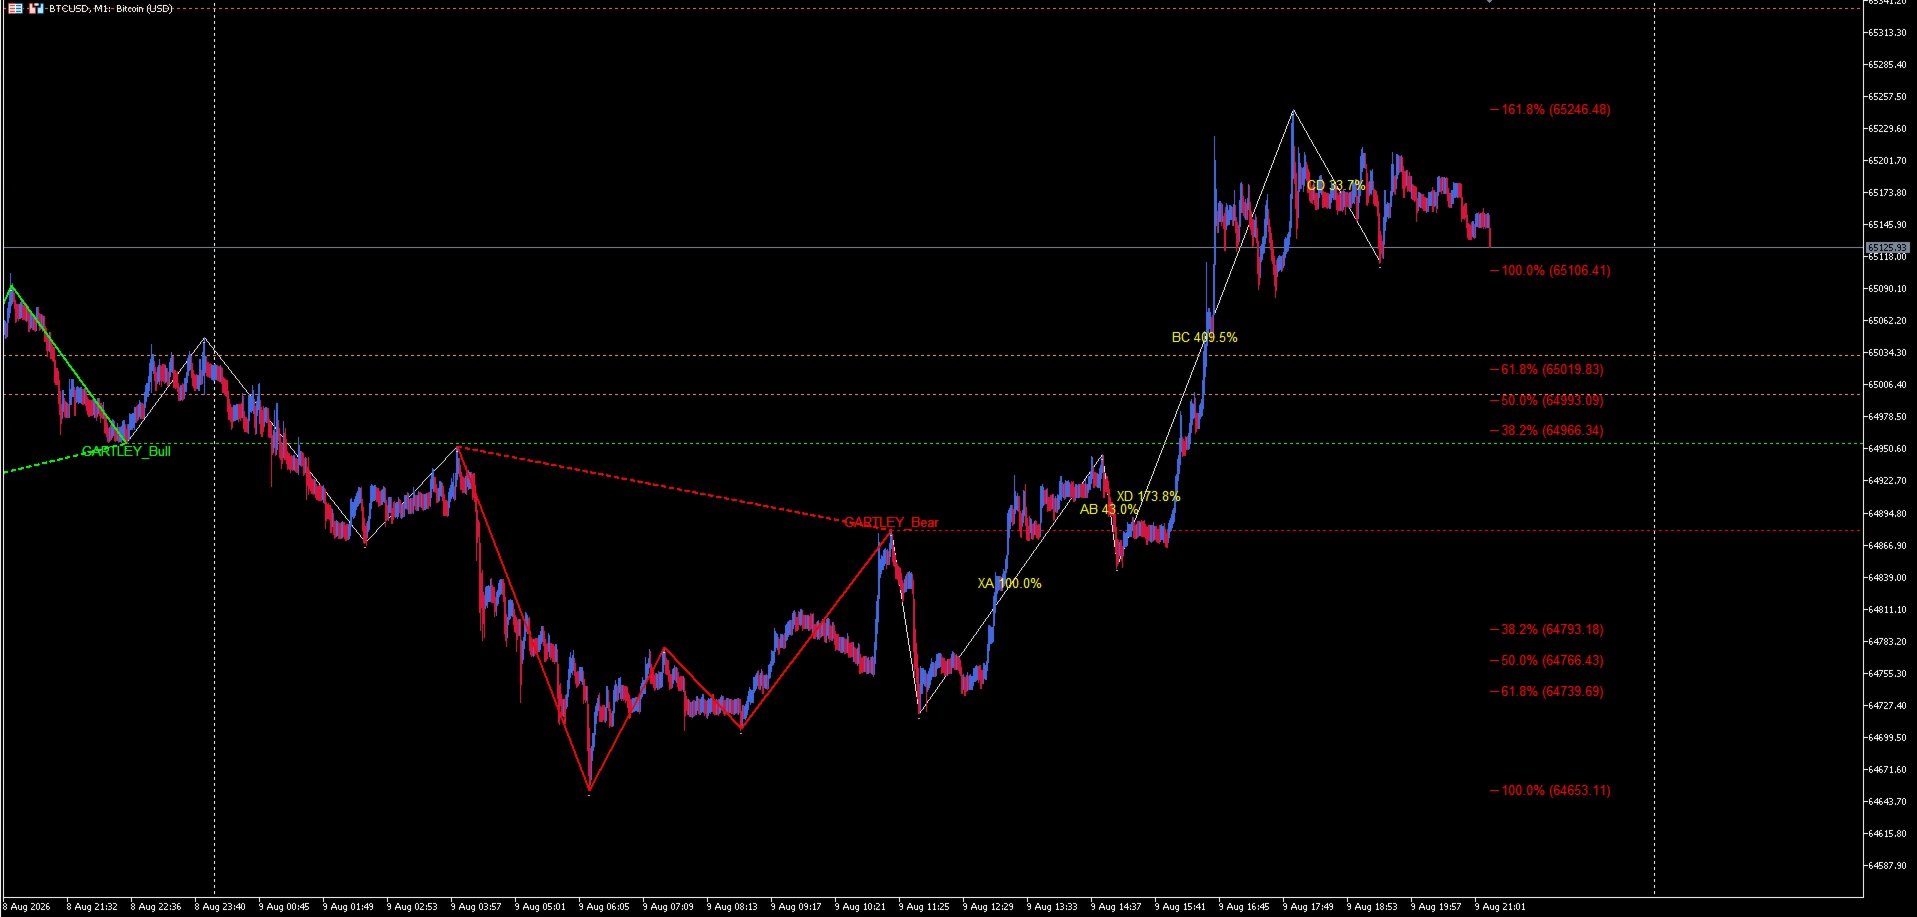
It is a visual analysis tool. Its function is to identify structures on the chart that satisfy the geometric relationships of six classic harmonic patterns: Gartley, Bat, Butterfly, Crab, Cypher, and Shark, in both bullish and bearish variants, and to display them clearly along with their projection levels.
The indicator draws the pattern legs, labels the completion point, projects Fibonacci retracement and extension levels from the most recent pattern, and can raise an alert when a new one is detected.
================================================================================
WHAT THIS INDICATOR IS "NOT"
- Not an automated trading system. Does not open, close, or manage positions.
- Not a buy/sell signal generator. Displays geometric structures; interpretation and any decision rest entirely with the user.
- Not a price predictor. Fibonacci levels are geometric projection references, not forecasts.
- Not a guarantee of any particular outcome. A harmonic pattern is a technical-analysis figure, and its appearance does not imply a result.
================================================================================
THE REAL PROBLEM: DETECTING STRUCTURE, NOT MEASURING THE PATTERN
It is worth being transparent about where the real technical difficulty of this kind of indicator lies.
Measuring a harmonic pattern — checking whether the proportions between its legs are close to the Fibonacci ratios — is, at bottom, straightforward arithmetic. That is NOT the hard part.
The hard part, and where most detectors fail, is the step before it: identifying what is a genuinely relevant peak and valley in real time, especially on low timeframes such as M1, where price noise is considerable.
Here there is no single, objective answer. Detecting significant highs and lows depends on several parameters (sensitivity, observation window, minimum prominence, separation between extremes) and can be approached with different mathematical models, each with its own trade-offs:
- If the detector is too sensitive, it marks noise as if it were real turning points and produces spurious patterns.
- If it is too coarse, it misses valid structures.
The central question — how much smoothing is adequate and how much is excessive — has no universally correct solution. It is an inherently subjective problem, and any honest detector is, in reality, a position taken on that balance.
================================================================================
THE APPROACH BEHIND THIS INDICATOR
This indicator addresses that difficulty with an empirical and alternative method of identifying price structure: empirical because its configuration is derived from observation on real data, and alternative because it is one of several possible paths to solve a problem that, as explained, admits no single solution.
Building it required integrating several disciplines:
- Signal processing, to treat the price series before searching for extremes and reduce the impact of noise.
- Analytic geometry, since each pattern is a set of spatial relationships between five points.
- Proportions and metric relationships (the Fibonacci ratios) as the validation criterion between legs.
- Combinatorial validation logic: strict peak-valley alternation, and verification of the geometric inequalities specific to each pattern.
The result is a pipeline that first resolves the swing structure and only then applies pattern measurement on that already-refined structure.
================================================================================
BRIEF HISTORICAL CONTEXT
Harmonic patterns have a long tradition in technical analysis. Their origin is usually traced to the work of H. M. Gartley (1935), and they were later formalized with Fibonacci proportions by subsequent authors, among them Scott Carney, who systematized several of the patterns now considered standard (such as the Bat, Crab, and Shark). The technique, therefore, has decades of history.
What has changed in recent years is the attempt to automate this reading on low timeframes, where — as described above — reliable detection of price structure becomes the true bottleneck.
================================================================================
PRO VERSION DETAILS:
Harmonic Patterns SwingCore PRO is the complete version of the indicator. It includes all advanced functionalities for traders who require more detailed analysis and multiple simultaneous patterns.
Exclusive features of the PRO version:
- Simultaneous detection of all 6 harmonic patterns: Gartley, Bat, Butterfly, Crab, Cypher, and Shark.
- Two selectable detection methods: Classic (Fibonacci ratios) and Geometric (price structure).
- Complete pattern and zigzag visualization on the chart.
- Percentage labels on each segment of the pattern.
- Projection of direct and inverse Fibonacci targets at 7 levels: 38.2%, 50.0%, 61.8%, 100.0%, 161.8%, 261.8%, and 361.8%.
- Advanced alert system: Visual, Sound, and Log.
- Analysis for the M1 timeframe (you can experiment with higher timeframes).
- History of detected patterns on the chart (Arrow System).
================================================================================
COMPARISON: CLASSIC VS GEOMETRIC
Aspect | Classic Method | Geometric Method
------------------------|--------------------------|-------------------
Base | Fibonacci Ratios | Order Relationships
Validation | Numerical Proportions | Order Conditions
Tolerance | Adjustable Parameter | Geometric Conditions
================================================================================
TECHNICAL FEATURES
- Data source: Heiken Ashi candles (price smoothing).
- Structure detection: minimum prominence + minimum distance + forced peak-valley alternation.
- Validation: classic ratios or geometric rules, depending on the selected method.
- Identification system: time-based signature (datetime).
- Fibonacci projection: up to 7 levels, in both directions (retracement and extension).
================================================================================
MAIN PARAMETERS
General:
- Timeframe (Detection): PERIOD_CURRENT (recommended)
- Classic:true / Geometric:false: Selects the detection method
- Ratio Tolerance: Adjustable (0.15 by default)
- Scan Window: 1440 bars (recommended)
Structure:
- Minimum Prominence: Controls sensitivity (2.0 by default)
Visualization:
- Show Percentages: Displays percentage labels per segment
- Show Horizontal Line: Horizontal line from point D
- Show Fibonacci Targets: Fibonacci projection levels
Alerts:
- Enable Alerts: Master switch
- Sound Alert: WAV file playback (alert.wav by default)
- Alert Repeats: Number of repetitions (5 by default)
================================================================================
ALERT SYSTEM
Channel Description Configuration
----------- ------------------------------------ -------------------------------
1. Visual Pop-up in MT5 terminal Alert_Visual = true
2. Sound WAV file playback Alert_Sonido = true
3. Log Registration in Experts tab Alert_Log = true
================================================================================
INSTALLATION AND USER MANUALS
You can download the complete installation and user manual in the following languages:
- English: Manual_SwingCore_EN.pdf
- Español: Manual_SwingCore_ES.pdf
- Русский: Manual_SwingCore_RU.pdf
================================================================================
DISCLAIMER
This indicator is provided exclusively for informational and demonstrative purposes, as a technical-analysis support tool.
It does not constitute financial, investment advice, or any trading recommendation. Pattern detection is the result of a geometric calculation and does not represent a prediction of future market behavior.
Past performance does not guarantee future results. Trading in financial markets carries a high risk of loss.
You assume the entire risk of any decision you make based on this indicator. The author is not responsible for any losses, damages, or harm of any kind resulting from its use.
================================================================================
RECOMMENDED USE
Pairs and markets:
EURUSD, AUDUSD, NZDUSD, XAUUSD and other liquid forex pairs or metals.
Recommended timeframes:
M1 (primary), M5, M15, and M30 (optional).