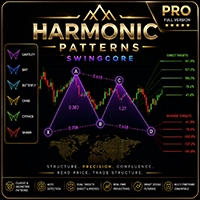
Harmonic Patterns SwingCore Pro

  • 지표
  • Nestor Jose Mendez Boza
    Nestor Jose Mendez Boza
    퀀트 트레이딩 시스템 디자이너 및 시계열 분석 연구원
    저는 알고리즘 트레이딩 시스템의 연구와 개발에 지난 7년간 헌신해온 다학제적 개인입니다. 고급 수학, 데이터 과학, 그리고 혁신적인 시장 분석 접근법을 융합하여 국제적인 경쟁 환경에서 구체적인 성과를 달성해왔습니다.
    주요 성과:
    Robotrader 2023 (Interactive Brokers): Python 전략으로 3위 수상
    Robotrader 2025 (Darwinex): MQL5 및 적응형 위험 관리 기술로 3위 수상
  • 버전: 1.0
  • 활성화: 10
Harmonic Patterns SwingCore Pro | For MetaTrader 5 (MT5)

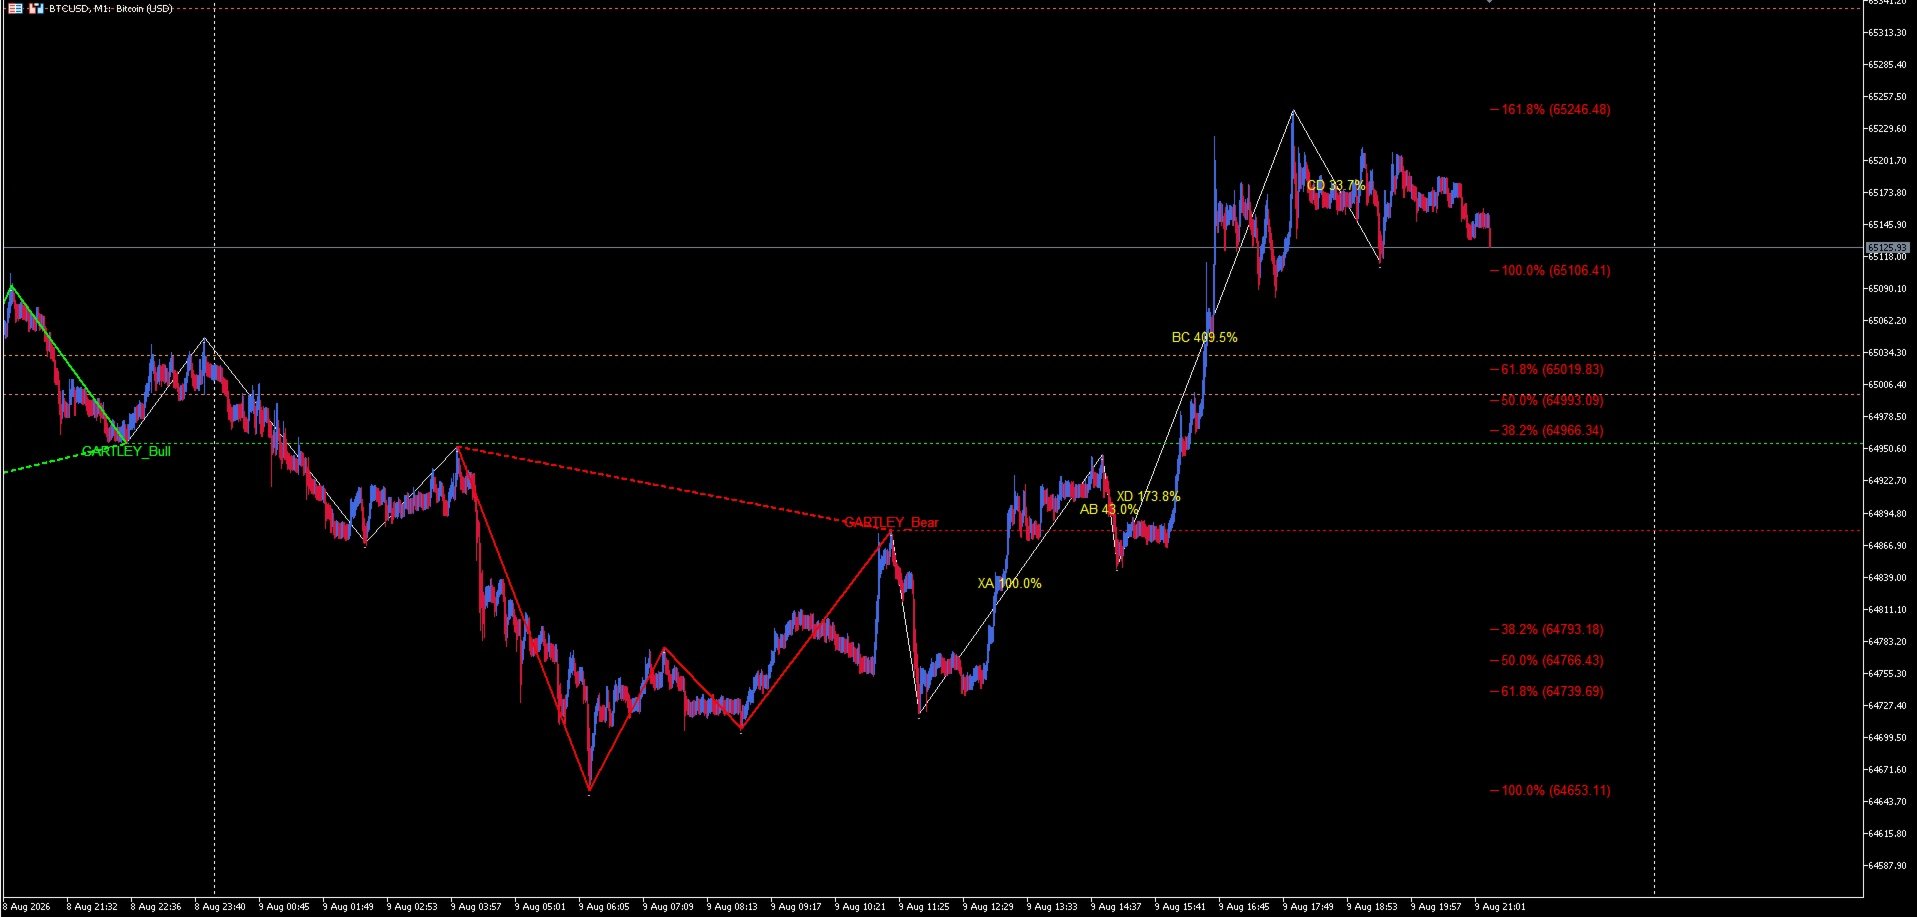
Technical analysis indicator for detecting and visualizing harmonic patterns on the chart, with Fibonacci level projection and configurable alert system.

================================================================================

WHAT THIS INDICATOR IS

It is a visual analysis tool. Its function is to identify structures on the chart that satisfy the geometric relationships of six classic harmonic patterns: Gartley, Bat, Butterfly, Crab, Cypher, and Shark, in both bullish and bearish variants, and to display them clearly along with their projection levels.

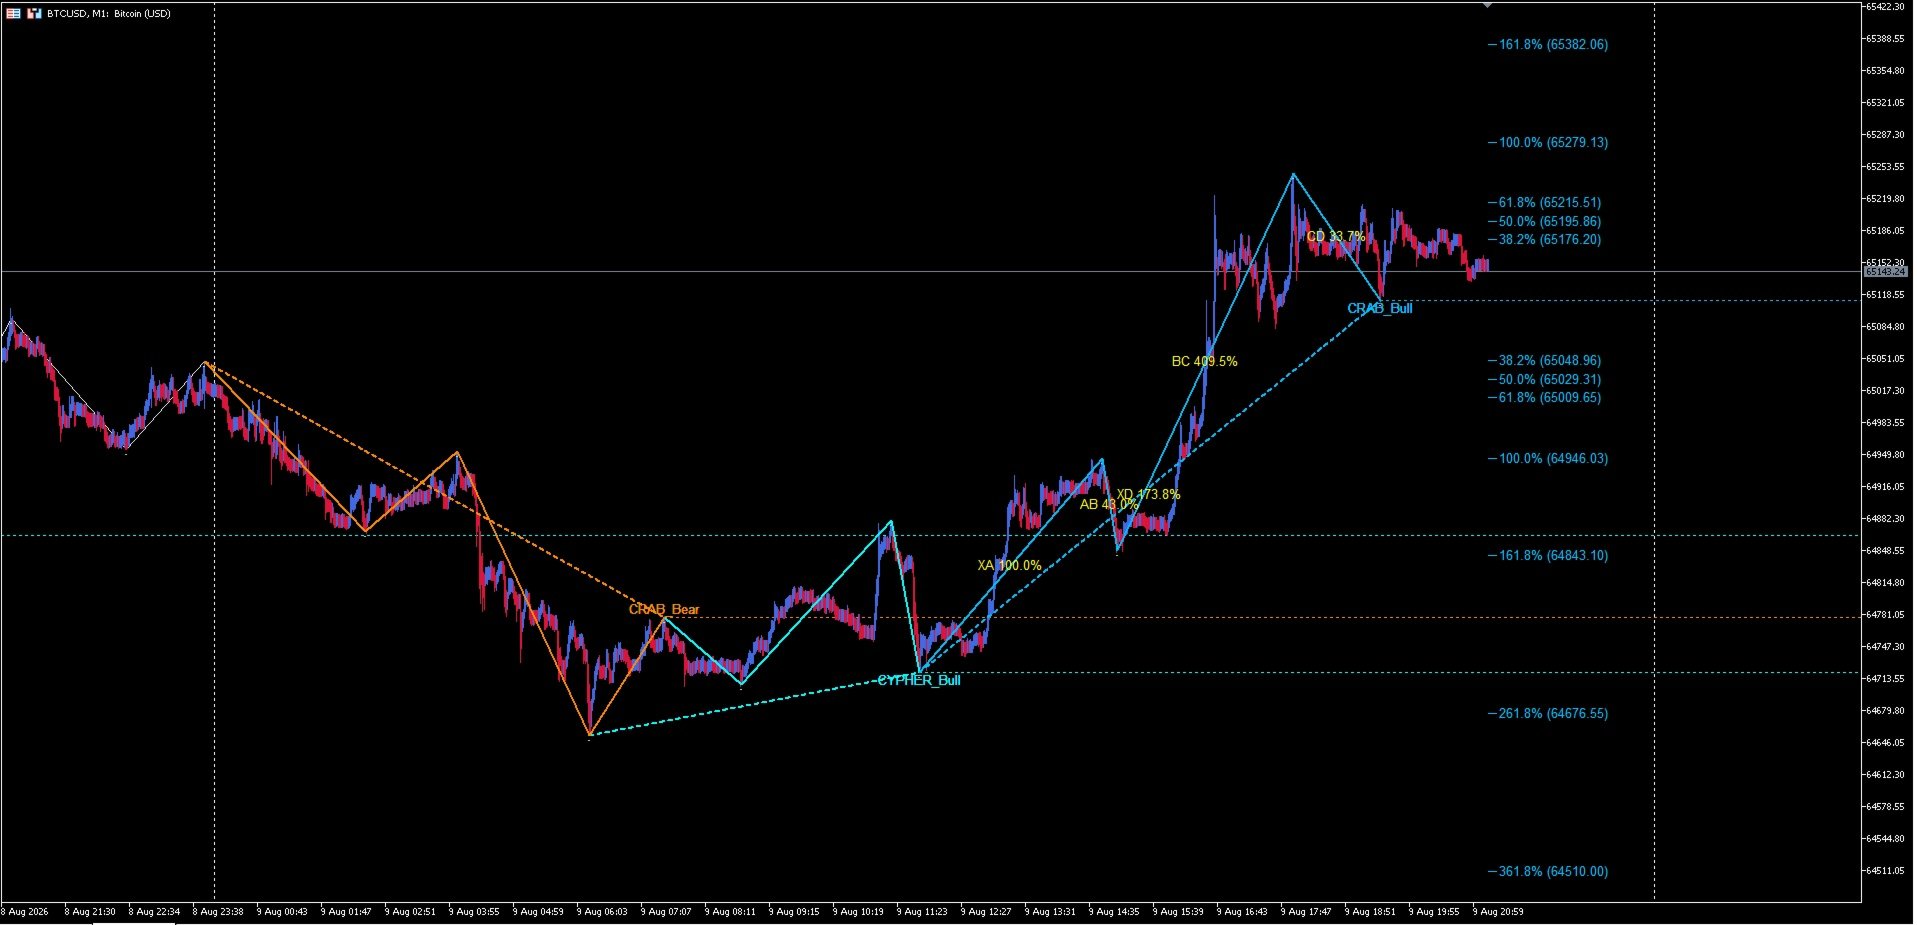
The indicator draws the pattern legs, labels the completion point, projects Fibonacci retracement and extension levels from the most recent pattern, and can raise an alert when a new one is detected.

================================================================================

WHAT THIS INDICATOR IS "NOT"

- Not an automated trading system. Does not open, close, or manage positions.
- Not a buy/sell signal generator. Displays geometric structures; interpretation and any decision rest entirely with the user.
- Not a price predictor. Fibonacci levels are geometric projection references, not forecasts.
- Not a guarantee of any particular outcome. A harmonic pattern is a technical-analysis figure, and its appearance does not imply a result.

================================================================================

THE REAL PROBLEM: DETECTING STRUCTURE, NOT MEASURING THE PATTERN

It is worth being transparent about where the real technical difficulty of this kind of indicator lies.

Measuring a harmonic pattern — checking whether the proportions between its legs are close to the Fibonacci ratios — is, at bottom, straightforward arithmetic. That is NOT the hard part.

The hard part, and where most detectors fail, is the step before it: identifying what is a genuinely relevant peak and valley in real time, especially on low timeframes such as M1, where price noise is considerable.

Here there is no single, objective answer. Detecting significant highs and lows depends on several parameters (sensitivity, observation window, minimum prominence, separation between extremes) and can be approached with different mathematical models, each with its own trade-offs:

- If the detector is too sensitive, it marks noise as if it were real turning points and produces spurious patterns.
- If it is too coarse, it misses valid structures.

The central question — how much smoothing is adequate and how much is excessive — has no universally correct solution. It is an inherently subjective problem, and any honest detector is, in reality, a position taken on that balance.

================================================================================

THE APPROACH BEHIND THIS INDICATOR

This indicator addresses that difficulty with an empirical and alternative method of identifying price structure: empirical because its configuration is derived from observation on real data, and alternative because it is one of several possible paths to solve a problem that, as explained, admits no single solution.

Building it required integrating several disciplines:

- Signal processing, to treat the price series before searching for extremes and reduce the impact of noise.
- Analytic geometry, since each pattern is a set of spatial relationships between five points.
- Proportions and metric relationships (the Fibonacci ratios) as the validation criterion between legs.
- Combinatorial validation logic: strict peak-valley alternation, and verification of the geometric inequalities specific to each pattern.

The result is a pipeline that first resolves the swing structure and only then applies pattern measurement on that already-refined structure.

================================================================================

BRIEF HISTORICAL CONTEXT

Harmonic patterns have a long tradition in technical analysis. Their origin is usually traced to the work of H. M. Gartley (1935), and they were later formalized with Fibonacci proportions by subsequent authors, among them Scott Carney, who systematized several of the patterns now considered standard (such as the Bat, Crab, and Shark). The technique, therefore, has decades of history.

What has changed in recent years is the attempt to automate this reading on low timeframes, where — as described above — reliable detection of price structure becomes the true bottleneck.

================================================================================

PRO VERSION DETAILS:

Harmonic Patterns SwingCore PRO is the complete version of the indicator. It includes all advanced functionalities for traders who require more detailed analysis and multiple simultaneous patterns.

Exclusive features of the PRO version:

- Simultaneous detection of all 6 harmonic patterns: Gartley, Bat, Butterfly, Crab, Cypher, and Shark.

- Two selectable detection methods: Classic (Fibonacci ratios) and Geometric (price structure).

- Complete pattern and zigzag visualization on the chart.

- Percentage labels on each segment of the pattern.

- Projection of direct and inverse Fibonacci targets at 7 levels: 38.2%, 50.0%, 61.8%, 100.0%, 161.8%, 261.8%, and 361.8%.

- Advanced alert system: Visual, Sound, and Log.

- Analysis for the M1 timeframe (you can experiment with higher timeframes).

- History of detected patterns on the chart (Arrow System).

================================================================================

COMPARISON: CLASSIC VS GEOMETRIC

Aspect                  | Classic Method           | Geometric Method
------------------------|--------------------------|-------------------
Base                    | Fibonacci Ratios         | Order Relationships
Validation              | Numerical Proportions    | Order Conditions
Tolerance               | Adjustable Parameter     | Geometric Conditions

================================================================================

TECHNICAL FEATURES

- Data source: Heiken Ashi candles (price smoothing).
- Structure detection: minimum prominence + minimum distance + forced peak-valley alternation.
- Validation: classic ratios or geometric rules, depending on the selected method.
- Identification system: time-based signature (datetime).
- Fibonacci projection: up to 7 levels, in both directions (retracement and extension).

================================================================================

MAIN PARAMETERS

General:
- Timeframe (Detection): PERIOD_CURRENT (recommended)
- Classic:true / Geometric:false: Selects the detection method
- Ratio Tolerance: Adjustable (0.15 by default)
- Scan Window: 1440 bars (recommended)

Structure:
- Minimum Prominence: Controls sensitivity (2.0 by default)

Visualization:
- Show Percentages: Displays percentage labels per segment
- Show Horizontal Line: Horizontal line from point D
- Show Fibonacci Targets: Fibonacci projection levels

Alerts:
- Enable Alerts: Master switch
- Sound Alert: WAV file playback (alert.wav by default)
- Alert Repeats: Number of repetitions (5 by default)

================================================================================

ALERT SYSTEM

Channel     Description                          Configuration
----------- ------------------------------------ -------------------------------
1. Visual   Pop-up in MT5 terminal               Alert_Visual = true
2. Sound    WAV file playback                    Alert_Sonido = true
3. Log      Registration in Experts tab          Alert_Log = true

================================================================================

INSTALLATION AND USER MANUALS

You can download the complete installation and user manual in the following languages:

- English: Manual_SwingCore_EN.pdf
- Español: Manual_SwingCore_ES.pdf
- Русский: Manual_SwingCore_RU.pdf


================================================================================

DISCLAIMER

This indicator is provided exclusively for informational and demonstrative purposes, as a technical-analysis support tool.

It does not constitute financial, investment advice, or any trading recommendation. Pattern detection is the result of a geometric calculation and does not represent a prediction of future market behavior.

Past performance does not guarantee future results. Trading in financial markets carries a high risk of loss.

You assume the entire risk of any decision you make based on this indicator. The author is not responsible for any losses, damages, or harm of any kind resulting from its use.

================================================================================

RECOMMENDED USE

Pairs and markets:
EURUSD, AUDUSD, NZDUSD, XAUUSD and other liquid forex pairs or metals.

Recommended timeframes:
M1 (primary), M5, M15, and M30 (optional).
추천 제품
Market Profile TPO Market Profile TPO is a multi-period Time-Price-Opportunity (TPO) indicator for MetaTrader 5. It builds price profiles from time data and displays the Point of Control (POC), the Value Area (VAH and VAL), the Initial Balance (IB), Single Prints, a volume overlay and profile merging on the chart. It is written entirely in MQL4 and does not use DLLs or external files. What the indicator draws TPO profile: each price level is tagged with the time slice in which it traded. Display
# SunflowerEA (해바라기 EA) ### ONNX 신경망 기반 BTCUSD 자동매매 시스템 학습된 딥러닝 모델을 단일 파일 EA에 직접 컴파일했습니다. 완전 로컬 추론, 외부 의존성 제로, 멀티 레그 리스크 관리를 내장. M15 타임프레임에서 BTCUSD 추세 스윙에 특화되어 있습니다. ## 주요 특징 - **완전 로컬 AI 추론.** 모델이 바이너리 리소스로 ex5 내부에 내장되어 실행 시 파일 자체에서 로드됩니다. `MQL5\Files` 불필요, DLL 없음, 네트워크 요청 없음. 단일 파일 업로드만으로 Market 검증에 아무런 장애가 없습니다. - **6레그 콤보 전략.** 5개의 롱 레그(서로 다른 신뢰도 단계)와 1개의 전용 숏 레그를 동일한 신경망이 서로 다른 임계값으로 발동합니다. 진입 시점을 분산시켜 자금 곡선을 완만하게 만듭니다. - **내장 리스크 관리.** 각 거래는 ATR 기반 동적 손절/익절(ATR 배수 지정)과 시간 청산(보유 기한 도달 시 자
FREE
VWAP Wave
Rizwan Akram
VWAP WAVE [Riz] - MT5 Indicator               Advanced VWAP Divergence Detection System VWAP Wave is a professional-grade Volume Weighted Average Price indicator with built-in divergence detection system. It identifies high-probability reversal and continuation signals by analyzing price-VWAP relationships across multiple timeframes.
FREE
Elliott Wave Pro
Timothy Chuma Ifiora
Elliot Wave Pro is an MT5 indicator that automatically detects Elliott Wave structures (impulse and corrective behavior) and calculates key Fibonacci-based retracement/limit levels from the most recent completed wave. It helps turn wave structure into a tradable setup: enter on the pullback, target Wave 1 , and place your stop beyond the wave high / invalidation level . That gives you a clear risk-to-reward model where a single valid setup can outweigh multiple small losses. In short, it shows w
Momentum Ninja Advanced MT5
Mohammed Maher Al-sayed Mohammed Ahmed Saleh
Momentum Ninja Advanced MT5 This indicator is an enhanced version of the classic Momentum indicator.  Main features: - Based on NinjaTrader-style momentum logic. - Uses EMA-based smoothing for cleaner and more stable readings. - Displays dynamic color changes to highlight bullish and bearish strength. - Sends alerts when the momentum crosses above or below zero. - Fully customizable and completely non-repainting. - Lightweight and optimized for all symbols and timeframes. How it differs from t
BALOGUN SMC ELITE — Professional Smart Money Concepts Indicator KEY FEATURES: Strict BUY/SELL Alternation — Only 1 BUY followed by 1 SELL (no signal spam) Non-Repainting Signals — Signals confirmed on closed bars only Zone-Limited NO TRADE Markers — Clear visual zones showing when NOT to trade Multi-Factor Confluence Scoring — 0-100% quality score per setup Professional Dashboard — Real-time trend, confluence, and signal status Multi-Channel Alerts — Popup, Push, Email, and S
Auto Fib Alert
Dushshantha Rajkumar Jayaraman
AutoFibAlert — Automatic Fibonacci Levels Alerts with Multi-Channel Alerts AutoFibAlert is an MT5 indicator that removes the manual work of drawing Fibonacci retracements. It automatically detects the most recent significant swing high and swing low on your chart, plots a full retracement grid from that swing, and notifies you the moment price reaches any level — on your desktop, with sound, and on your phone. Key Features Automatic Swing Detection Continuously scans a configurable lookback win
Cobalt Predictive Channel: 미래를 예측하는 동적 회귀 어시스턴트 수동으로 채널을 그리고, 휩쏘(가짜 돌파, fakeout)에 돈을 잃고, 항상 트렌드의 막바지에 진입하는 일은 이제 그만두세요. Cobalt Predictive Channel은 XAUUSD(금), 비트코인, 주요 외환 통화쌍과 같이 변동성이 큰 시장을 위해 특별히 설계된 기관 수준의 "조기 경보 및 회귀" 어시스턴트입니다. 과거만을 그리는 기존 지표들과 달리, 이제 막 싹트기 시작하는 트렌드를 예측하여 시장보다 한 발 앞서 나갈 수 있게 해줍니다. 왜 Cobalt Predictive Channel을 사용해야 할까요? 대부분의 트레이더는 시장에 명확한 채널이 형성된 후에야 진입하려고 시도하며, 이는 종종 "트렌드의 끝자락"을 잡아 손실로 이어집니다. 게다가 금이나 암호화폐 같은 시장에서는 "유동성 사냥(liquidity hunts)"이라고 불리는 길고 날카로운 꼬리(wick) 때문에 수동으로
FREE
FibExtender
Syed Oarasul Islam
This Indicator draws Fibonacci Extension levels in two different ways. You can select whether to draw Fibonacci Extension levels based on your favourite ZigZag settings or you can let the indicator to draw Fibonacci Extension  level based on given number of Bars or Candles.  You can also set Mobile and Email notification for your favourite Extension  levels individually. With this indicator you will not have to feel lonely as the it can generate Voice alerts, which will keep you focused on your
Volume Trade Levels
Mahmoud Sabry Mohamed Youssef
The idea behind this indicator is very simple , First it contains 2 mechanisms to place your trades: 1- Enter the Pips you want to duplicate to price levels. 2- Automatically let the indicator specify the largest Buy / Sell Volume Candle and place duplicated levels based on the candle itself. How it works: 1- Enter the Pips you want to duplicate to price levels:    1- once the indicator is loaded you will need first to Specify the number of pips in the indicator Configuration window ,you can g
Opulence Order Block
Tokunbo Greatpath Adebowale
Opulence OB is a precision-engineered, non-repainting Order Block indicator that identifies high-probability institutional supply and demand zones directly on your MetaTrader 5 chart. Unlike generic OB tools, Opulence OB is fully context-aware — it reads live market structure before drawing anything. A bullish order block only appears when bullish structure is valid. A bearish order block only appears when bearish structure is valid. No noise. No contradiction. Just the zone that actually matter
Fibonacci MT5
Konstantin Chechnev
Fibonacci EA MT5 is an Expert Advisor for automating trading based on Fibonacci levels. It determines the minimum and maximum prices over a specified number of bars, builds Fibonacci levels, and opens trades when the current price reaches the selected levels. The EA can trade with the trend or against it, depending on the given parameters. It also allows you to configure levels for closing trades, risk management, and time filters. Features Automatic detection of local extremes and the construct
VIEW THE LIVE TRACKING SIGNAL HERE REGISTER AN ACCOUNT WITH THE BROKER HERE ACCESS THE OFFICIAL COPYTRADING INVESTMENT OFFER HERE Fx Vol 20 Titan -- Professional Expert Advisor for Weltrade (H1) Fx Vol 20 Titan is a high-precision automated algorithmic trading system designed exclusively for the Weltrade broker, natively optimized for the Fx Vol 20 synthetic index on the one-hour (H1) timeframe. The algorithm utilizes an advanced mathematical engine based on the recognition of volatility patte
ArcTracer
Syed Oarasul Islam
This Indicator draws Fibonacci Arc levels in two different ways. You can select whether to draw Fibonacci Arc levels based on your favourite ZigZag settings or you can let the indicator to draw Arc levels based on given number of bars or candles.  You can also set Mobile and Email notification for your favourite Arc levels individually. With this indicator you will not have to feel lonely as the it can generate Voice alerts, which will keep you focused on your trading and remove boredom.  Produc
Auto Order Block with break of structure based on ICT and Smart Money Concepts (SMC) Futures Break of Structure ( BoS )             Order block ( OB )            Higher time frame Order block / Point of Interest ( POI )    shown on current chart           Fair value Gap ( FVG ) / Imbalance   -  MTF      ( Multi Time Frame )    HH/LL/HL/LH  -  MTF      ( Multi Time Frame )  Choch  MTF      ( Multi Time Frame )  Volume Imbalance     ,  MTF          vIMB Gap’s Power of 3 Equal High / Low’s  
PatternGuard VWAP Trader — A uthor's  Smart Trading Advisor for VWAP Breakout and Pattern-Based Entries PatternGuard VWAP Trader is a professional Expert Advisor for MetaTrader 5 designed to identify trading opportunities after price exits a dynamic NO TRADE zone based on VWAP and volatility bands. The main idea of the system is simple and effective: avoid trading inside uncertain, low-quality market zones and look for entries only when price breaks out of consolidation, confirms direction with
ZnalgoAiTrend
Zamin Mujtaba Zaidi
Here is a professional and compelling product description you can use directly for the MQL5 Market. It highlights the advanced mathematical logic under the hood while keeping it accessible for everyday traders. Znalgo Ai Trend: Advanced Dynamic Trend Tracker Znalgo Ai Trend is a professional-grade trend-following indicator engineered to track market momentum using a highly responsive, recursive ATR-stepping algorithm. Originally adapted from advanced quantitative TradingView models, this indica
Eazy RSI Divergence
Gawain Athur Stephan Cloete
Eazy Divergence is a non-repainting MT5 indicator designed to automatically detect and plot Regular and Hidden divergence signals in real time Key Features Dual-Window Plotting: Displays divergence trendlines and text badges directly on both the main price chart and the RSI subwindow. 100% Non-Repainting: Uses left/right pivot strength confirmation so signals stay fixed once drawn. Full Multi-Timeframe Support: Adapts instantly to whatever chart timeframe you are viewing. Fully Customizable: Eas
Chart Patterns Builder Premium
Florea E. Sorin-Mihai Persoana Fizica Autorizata
The Chart Patterns Builder Premium expert advisor is an extension of the freely available Chart Patterns Builder Basic :         it provides 1 new chart pattern: the rectangle breakout (besides the double top & bottom pattern already provided in the basic edition);         in most configurations, backtesting usually shows more than double (2x) average yearly return rate;         the account growth curve is also smoother, due to approximately double number of trades,  compared to the free version
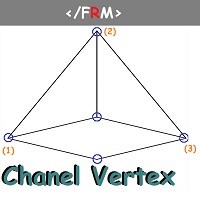
Channel Vertex is a price action pattern formed by price Chanel and a triangle pattern . Price channels basically indicates possible support and resistance zones around a price movement and retracement    or breakout at these levels can indicate possible trend continuation or reversal .  Majority of the times price fluctuations forms triangle patterns defined by 3 vertexes , these triangle patterns most times defines a trend continuation.  A triangle pattern is a trend continuation pattern that
Dear traders and investors, Introducing   Vikopo Value Gaps MT5 , Developed by a team of experienced traders with trading experience of over 15 years. MT4 Version : https://www.mql5.com/en/market/product/114438 products List : https://www.mql5.com/en/users/vikopoadvise/seller Strategy Introduction : When utilizing this robot, we have harnessed the power of cutting-edge neural plugins to enhance its capabilities. By integrating these neural plugins, our trading robot is equipped with a for
Candle EA MT5
Mansour Babasafary
4.14 (22)
This expert is based on patterns The main patterns of this specialist are candlestick patterns Detects trends with candlestick patterns It has a profit limit and a loss limit, so it has a low risk The best time frame to use this expert is M30 time frame The best currency pairs to use with this expert is the EURUSD, GBPUSD, AUDUSD, USDCAD currency pairs Attributes: Can be used in the EURUSD, GBPUSD, AUDUSD, USDCAD  currency pairs Can be used in M30, H1, H4 time frames Has profit limit and loss
Babel Assistant
Iurii Bazhanov
4.33 (9)
Babel assistant 1 MT5 넷팅(netting) 로봇 "Babel_assistant_1"은 ZigZag 지표를 사용하여 M1, M5, M15, H1, H4, D1 및 W1 타임프레임 전반에 걸쳐 피보나치 수준을 생성하고, 매수 및 매도 트렌드의 강도를 계산합니다. 지정된 트렌드 수준 4.925를 초과하면 "Lot for open a position" 설정을 사용하여 포지션을 엽니다. 그런 다음, Babel은 특정 피보나치 수준에 대기 주문(pending orders)을 배치하고 지정된 손절매(Stop Loss) 및 이익실현(Take Profit) 라인을 설정합니다. 화면에는 포지션, 거래 및 트렌드의 현재 결과가 표시됩니다. 0.02랏 이상의 수동 포지션 증가는 로봇에 의해 자체 대기 주문의 트리거로 인식됩니다. 0.01랏의 대기 주문 또는 시장가 주문은 체결 시 단순히 포지션 볼륨을 변경합니다. 면책 조항: 아래에 제시된 자료는 정보 제공 및 교육 목적으로만 제공됩니다
FREE
Live Renko
Jefferson Judge Metha
Perfectly designed for traders who value clarity, precision, and ease of use, this cutting-edge Renko chart indicator provides everything you need to enhance your trading strategy. Unlike traditional generators that create offline charts, this indicator delivers real-time Renko charts directly on your live trading platform. The Live Renko Indicator also works seamlessly on Synthetic Indices such as Volatility 75, Step Index, Boom and Crash.
Projection of Phi
Nestor Jose Mendez Boza
Projection of Phi   Is a technical indicator that calculates dynamic support and resistance levels. It uses angular geometric projections and mathematical ratios to identify market expansion ranges. Features: Dynamic Fibonacci Expansion: Extension level projection Geometric Calculation: Angular analysis and mathematical ratios Visualization: Graphical objects with informative labels Compatibility: M1 to H4 timeframes Applications: Identification of zones for trade management Analysis of volatil
FREE
High/Low Daily Levels is a robust, lightweight indicator for MetaTrader 5 that plots the High and Low of the trading day as clean horizontal lines directly on your chart. Levels are read from the D1 series, so they are identical on every chart timeframe, from M1 to D1. Whether you trade breakouts, trend continuations or mean reversion around key session boundaries, the indicator gives you precise visual references without cluttering your workspace. Key Features: * Three display modes: Current
FREE
The indicator determines a special pattern of Joe Dinapoli. It gives very high probability buy and sell signals. Indicator does not repaint. Indicator Usage Buy Signal ''B'' Entry : Market buy order at signal bar close Stop : Low of signal bar Take Profit : First swing high Sell Signal ''S'' Entry : Market sell order at signal bar close Stop : High of signal bar Take Profit : First swing low Indicator Parameters Fast EMA : External Parameter (should be kept as default) Slow EMA: External Param
Golden Vector
Marius Ovidiu Sunzuiana
Golden Vector — Precision Market Geometry for the Modern Trader Golden Vector is a cutting‑edge trading indicator that fuses advanced Fibonacci analytics with high‑level mathematical modeling to reveal the hidden vectors driving market movement. Engineered for traders who demand more than basic retracement lines, it transforms raw price data into a geometrically structured roadmap for strategic entries and exits. Core Advantages Next‑Gen Fibonacci Engine — Goes beyond standard ratios, dynamical
TheCubeTheory - Seu Indicador de Análise de Mercado em Cubos Descrição Completa  O Que é o TheCubeTheory? O   TheCubeTheory   é um indicador exclusivo para MetaTrader 5 que   mapeia os níveis de suporte e resistência   usando uma abordagem inovadora baseada em   cubos de tempo e Fibonacci . Desenvolvido pela   Ethernal , ele combina: Análise de Máximas e Mínimas   em períodos personalizáveis Níveis Automáticos   (8 níveis ajustáveis) Visualização em Tempo Real   com retângulos e linhas col
Precision Spike Detector
Francisco Mandomo Simbine
5 (2)
Precision Spike Detector V3 – Institutional-Grade AI Trading System Attention: The price increases by US$50 for every 10 purchases.  Final price: US$599 Precision Spike Detector V3   is a   state-of-the-art, institutional-grade market analysis system   for   MetaTrader 5 , designed to detect   high-probability market movements   in synthetic indices such as   Boom, Crash, GainX, and PainX . After purchase, send me a private message to receive the optimized configuration files,  the installation
이 제품의 구매자들이 또한 구매함
Trend Sniper X
Sarvarbek Abduvoxobov
4.86 (44)
Trend Sniper X 는 트레이더가 추세 방향과 잠재적 반전 지점을 명확하고 정확하게 포착할 수 있도록 도와주는 MetaTrader 5용 멀티 타임프레임 추세 추종 지표입니다. MT4용: https://www.mql5.com/en/market/product/193245 가격 정보: 현재 가격은 프로모션 할인가이며, 향후 업데이트 및 새로운 기능이 출시됨에 따라 변동될 수 있습니다. 보너스 혜택: 본 지표 전용 무료 자동매매 Assistant EA를 받으시려면 구매 후 작성자에게 메시지를 보내주시기 바랍니다. Code2Profit 채널 멀티 타임프레임 분석으로 시장을 마스터하세요! Trend Sniper X로 승률을 극대화하는 방법: 핵심 규칙 및 세션 팁 기술 사양 플랫폼 MetaTrader 5 지표 유형 멀티 타임프레임 추세 지표 운용 타임프레임 모든 차트 타임프레임 지원, 독립적으로 선택 가능한 상위 타임프레임(M1–MN1) 주요 상품 외환, 금(XAUUSD) 및 기타 C
새로운 왕의 등장 - 인디케이터 + 주문 관리 표시(TP1 + TP2 + TP3) + 선택형 텔레그램 시그널 전송 기능 포함 (무료) (완전한 트레이딩 및 시그널 시스템) 골드를 위한 최고의 EA: Gold Slayer 이 인디케이터는 고급 전략, 사용자 지정 가능한 주문 관리 시스템, 그리고 엔벨로프 확장을 결합한 평균 회귀(mean reversion) 시스템을 포함하고 있습니다. 또한 RSI와 같은 여러 지능형 확인 필터를 통해 높은 확률의 반전 진입 구간을 포착하여 BUY 및 SELL 시그널을 제공합니다. 단순히 거래 방법만 배우는 것이 아니라, 여러 포지션을 효과적으로 관리하고 이전에 수익 중인 오픈 포지션으로 손실 거래를 커버하는 방법까지 익힐 수 있습니다. M5 전용으로 설계 및 최적화되었으며, 유동성이 풍부해 시그널이 더 깔끔하고 신뢰도 높은 BTCUSD와 XAUUSD에서 뛰어난 성능을 발휘합니다. 이 인디케이터는 ATR 기반으로 자동 계산된 진입가, 손절가, 익절가와
Smart Trend Trading System — MetaTrader 5 구매 후 MQL5에서 저에게 메시지를 보내시면 Smart Universal Expert Advisor를 무료로 받으실 수 있으며, 온라인 강좌, PDF 매뉴얼 및 비공개 그룹 이용 권한도 함께 제공됩니다. STTS는 추세 방향, 진입·청산 신호, 반전 구간, 주요 가격 수준을 차트에 모아 보여줍니다. 시스템을 참고해 수동으로 거래하거나, 별도의 호환 EA를 연결하여 선택한 설정에 따라 자동으로 거래를 실행할 수 있습니다. 하나의 시스템, 네 가지 트레이딩 접근법 STTS의 트레이딩 접근법은 크게 네 가지로 나뉩니다. • 스캘핑 — 단기 신호와 시장 움직임을 살펴봅니다. • 추세 매매 — 방향을 평가하고 추세 안에서 기회를 찾습니다. • 반전 매매 — 잠재적인 전환 구간과 방향 변화를 파악합니다. • 거래량 매매 — 거래량 기반 정보로 시장 활동을 평가합니다. 진입·청산 화살표, 추세 정보, 지지·저항 수
Entry Points Pro for MT5
Yury Orlov
4.52 (152)
Entry Points Pro는 주문을 넣기 전에 어디에서 진입하고, 스탑을 어디에 두고, 어떤 랏으로 거래할지 보여 줍니다. 가격 지금 149 USD이며, 이 가격으로는 마지막 1카피입니다. 이후 가격은 199 USD로 오르고, 최종 가격은 349 USD입니다. 저는 시장에서 트레이딩으로 돈을 벌고 그것을 보여 드립니다. 그래서 이 인디케이터를 모두에게 팔 필요가 없습니다. 스스로 생각하는 트레이더를 위한 도구이지, 마법 버튼이 아닙니다. 화살표는 캔들이 마감될 때 나타나며 리페인팅되지 않습니다. 설정은 두 가지: 예치금과 거래당 리스크. 결제 전에 확인하세요: 무료 데모는 MT5 전략 테스터에서 작동하며 2분이면 됩니다. 구매 후에는 제가 직접 설정을 도와 드리겠습니다. 2019년, 저는 이 지표가 무엇을 할 수 있는지 전 세계에 보여 주었습니다. 실계좌에서 지표의 시그널에 따라 수동으로, 모두가 볼 수 있게 공개적으로 거래했습니다 — 계좌는 Myfxbook에서 모니터링되었고,
SuperScalp Pro
Van Minh Nguyen
4.54 (37)
SuperScalp Pro - Professional Multi-Layer Confluence Scalping System SuperScalp Pro는 기존 Supertrend에 여러 지능형 확인 필터를 추가하여 기능을 강화한 고급 스캘핑 지표입니다. 잘못된 신호를 크게 줄이면서 성공 가능성이 더 높은 Buy/Sell 거래 기회를 식별하는 데 도움을 줍니다. 명확한 Buy 및 Sell 화살표가 차트에 직접 표시되며, ATR 기반 Stop Loss 및 Take Profit 레벨도 실시간으로 자동 계산됩니다. 구매 후 MQL5 메시지로 저에게 연락하시면 SuperScalp Pro Auto Trader EA를 무료로 받으실 수 있으며, 사용자 가이드와 비공개 그룹 이용 권한도 제공됩니다. 권장 설정 파일 다운로드: [Set File] 전체 문서는 제품 블로그에서 확인할 수 있습니다: [User Guide] 업데이트를 받으려면 공식 채널에 참여하세요: [Official Channel]
Gann Made Easy MT5
Oleg Rodin
5 (13)
Gann Made Easy 는 mr.의 이론을 사용하여 최고의 거래 원칙을 기반으로 하는 전문적이고 사용하기 쉬운 Forex 거래 시스템입니다. W.D. 간. 이 표시기는 Stop Loss 및 Take Profit Levels를 포함하여 정확한 BUY 및 SELL 신호를 제공합니다. PUSH 알림을 사용하여 이동 중에도 거래할 수 있습니다. 구매 후 거래 방법 안내 및 유용한 추가 지표를 무료로 받으시려면 저에게 연락주세요! 아마도 Gann 거래 방법에 대해 이미 여러 번 들었을 것입니다. 일반적으로 Gann의 이론은 초보자 거래자뿐만 아니라 이미 거래 경험이 있는 사람들에게도 매우 복잡한 것입니다. Gann의 거래 방식은 이론적으로 적용하기 쉽지 않기 때문입니다. 나는 그 지식을 연마하고 Forex 지표에 최고의 원칙을 적용하기 위해 몇 년을 보냈습니다. 표시기는 적용하기가 매우 쉽습니다. 차트에 첨부하고 간단한 거래 권장 사항을 따르기만 하면 됩니다. 지표는 지속적으로 시장 분석
Ultra Indicator
Ihor Otkydach
5 (1)
ULTRA는 “올인원” 방식으로 작동하는 기술적 지표로, 시장을 독자적으로 분석하고, 매매 신호를 생성하며, 손절매 주문 설정 수준을 표시하고, 이익을 실현하거나 손실을 최소화하기 위해 포지션을 청산해야 할 시점을 제안합니다. 다시 말해, 시장을 분석하는 법을 모르거나, 가격 수준(손절매를 어디에 설정할지)을 파악하지 못하거나, 자금 관리에 어려움을 겪더라도 상관없습니다. ULTRA가 그 모든 것을 대신 해줄 테니까요! 구매자 특전 : ULTRA 지표를 구매하신 후, 저에게 비공개 메시지를 보내주시면 “ULTRA BOT”을 무료 선물로 드립니다. 이 도구는 해당 지표의 신호를 바탕으로 개설한 거래를 관리하는 데 도움을 주는 특별한 도구입니다(각 거래에 대해 손절매를 설정하고, 최상의 결과를 얻을 수 있도록 전략의 규칙에 따라 거래를 자동으로 청산해 줍니다).  또한 구매자분들께 다양한 자산에 바로 적용할 수 있는 설정값을 제공해 드리고 있으며, 이를 통해 지표가 최대 효율로 작동할
Boba Analysis Suite
Trade Ready Solutions LLC
5 (2)
Boba Analysis Suite Boba Analysis Suite는 MetaTrader 5용 분석 지표입니다. 시장 구조, 주요 가격 영역, 전반적인 시장 상황을 하나의 차트 화면에 통합하여 표시합니다. 트레이더이자 트레이딩 코치로서의 실무 경험을 바탕으로 개발되었으며, 시장 방향 평가, 주요 가격 수준 식별, 여러 시간대의 종합적인 분석 등 체계적인 분석 과정을 지원합니다. 시장 맥락을 고려한 분석 개별 신호의 의미는 시장 상황에 따라 달라집니다. Boba Analysis Suite는 현재 차트 상황을 더 넓은 시장 구조와 연결하고, 사전에 정한 규칙에 따라 매매 아이디어를 검토할 수 있도록 돕습니다. 주요 분석 기능은 다음과 같습니다. 추세 및 시장 구조: 시장 방향과 관련 구조적 맥락을 평가합니다. 주요 가격 영역 및 수준: 추가 분석이 필요한 중요한 영역을 차트에 시각적으로 표시합니다. 여러 시간대: 서로 다른 시간대의 정보를 통합하여 전반적인 시장 상황을 평가합니다.
다음 업데이트 — 버전 2.52 곧 출시! [신규] 시장 분석 및 트레이딩 워크플로를 향상시키기 위해 설계된 4가지 주요 신규 기능을 기대해 주세요. 트레이딩 요구 사항을 충족하도록 설계된 4가지 새로운 기능으로 시장 분석을 한 단계 더 발전시킵니다. 다음 기능을 소개합니다: 1. TRADE OVERVIEW DASHBOARD 2. CONFLUENCE AT ZONE 3. STRONG & WEAK HIGH/LOW 4. OTE 1. TRADE OVERVIEW DASHBOARD 시장 전체 상황을 더 쉽게 파악할 수 있도록 도와주는 대시보드입니다. 트레이딩 의사결정을 지원하는 가이드를 제공하며, 하나의 화면에서 시장을 분석하고 체계적으로 트레이딩을 계획할 수 있도록 도와줍니다. 멀티 타임프레임 시장 개요 (Multi-Timeframe Market Overview) 시장 방향과 가격 구조를 더욱 명확하게 파악 시장 상황을 빠르게 확인 체계적인 시장 분석 및 진입 계획을 위한 가이드 2. CO
M1 Sniper MT5
Oleg Rodin
5 (7)
M1 SNIPER 는 사용하기 쉬운 거래 지표 시스템입니다. M1 시간대에 맞춰 설계된 화살표 지표입니다. 이 지표는 M1 시간대 스캘핑을 위한 단독 시스템으로 사용할 수 있으며, 기존 거래 시스템의 일부로도 사용할 수 있습니다. 이 거래 시스템은 M1 시간대 거래용으로 특별히 설계되었지만, 다른 시간대에도 사용할 수 있습니다. 원래는 XAUUSD와 BTCUSD 거래를 위해 이 방법을 설계했지만, 다른 시장 거래에도 유용하다는 것을 알게 되었습니다. 이 지표의 신호는 추세 방향과 반대로 거래될 수 있습니다. 저는 지표의 신호를 활용하여 양방향으로 거래할 수 있도록 돕는 특별한 거래 기법을 알려드립니다. 이 방법은 특별한 동적 지지선과 저항선 가격 영역을 활용하는 것을 기반으로 합니다. 구매하시면 M1 SNIPER 화살표 지표를 바로 다운로드하실 수 있습니다. 또한, 아래 스크린샷에 표시된 Apollo Dynamic SR 지표는 M1 SNIPER 도구를 사용하는 모든 사용자에게 무료로
FiboSniper Pro
Van Minh Nguyen
5 (4)
FiboSniper Pro – Multi-Filter Fibonacci System with Auto SL/TP and Control Panel FiboSniper Pro는 동적 Fibonacci Envelopes와 여러 확인 필터를 결합하여 선별된 Buy 및 Sell 신호를 생성하는 기술적 지표입니다. Fibonacci 레벨은 Moving Average와 ATR을 기반으로 계산된 후 ADX, EMA, RSI, ATR, Volume, Time 및 Candle 구조를 통해 필터링됩니다. 이 지표는 ATR 기반의 자동 Stop Loss 및 Take Profit 레벨을 차트에 직접 표시하며, 빠른 설정 조정을 위한 인터랙티브 Control Panel을 제공합니다. 구매 후 MQL5 메시지로 저에게 연락하시면 Auto Trader X를 무료로 받으실 수 있으며, 이 지표의 거래 신호를 자동화하는 방법에 대한 안내도 제공됩니다. User Guide 및 Set Files: [Click here
Auto Optimized SpeedAngle 은 지속적인 워크포워드 최적화(Walk-Forward Optimization, WFO)를 통해 곡선 적합(curve-fitting)을 제거한 기관 수준의 모멘텀 벡터화 시스템입니다. 시장 체제가 바뀔 때 성능이 떨어지는 정적 입력에 의존하는 대신, 이 지표는 표본 외(Out-of-Sample, OOS) 검증을 사용하여 매개변수를 동적으로 재보정하며, 표시되는 신호가 과거의 우연이 아닌 진정한 통계적 우위를 나타내도록 보장합니다. 핵심 기관용 프레임워크 워크포워드 최적화 엔진: 핵심 알고리즘은 수천 가지의 룩백(lookback) 및 임계값 조합을 지속적으로 스캔하며, 데이터를 인샘플(in-sample)과 표본 외(out-of-sample) 세트로 엄격하게 분리합니다. 미지의 데이터 환경에서 수학적 우수성이 증명된 경우에만 새로운 매개변수 구성을 채택합니다. 정량적 목적 함수: 순수한 총이익을 쫓는 대신, 최적화 엔진은 기관 수준의 안정성
Adaptive Price Action Engine 지표를 구매하면 EA(자동매매 프로그램)가 무료 멀티 타임프레임 기반 자기 최적화 추세 & 캔들 패턴 분석 시스템 시장은 끊임없이 변화하며, 모든 Price Action 패턴이 모든 시장 환경에서 동일한 가치를 가지는 것은 아닙니다. Adaptive Price Action Engine 은 변화하는 시장 환경에 적응할 수 있도록 설계되었으며, 추세 구조, 멀티 타임프레임 분석, 캔들 패턴 및 통계적 최적화 를 하나의 분석 프레임워크로 결합합니다. 두 가지 적응형 모드 Dual Alpha Trend Mode 낮은 타임프레임과 높은 타임프레임에서 적합한 Alpha Trend 파라미터를 자동으로 탐색하여, 최근 시장 움직임에 맞춰 추세 분석을 조정합니다. Candlestick + Alpha Mode Alpha Trend를 통한 시장 국면 분석과 22개의 상승 및 하락 캔들 패턴 을 결합합니다. 모든 패턴을 동일하게 취급하는 대신, 다양
Crystal Heikin Ashi Signals
Muhammad Jawad Shabir
5 (5)
Crystal Heikin Ashi Signals—Professional Trend & Signal Detection Indicator Advanced Heikin Ashi Visualization with Intelligent Signal System for Manual & Automated Trading Final Price: $149 ---------> Price goes up $10 after every 10 sales . Limited slots available — act fast . Overview User Guide PDF Crystal Heikin Ashi Signals is a professional-grade MetaTrader 5 indicator that combines pure Heikin Ashi candle visualization with an advanced momentum-shift detection system. Designed for both m
Scalper Vault MT5
Oleg Rodin
5 (1)
Scalper Vault는 당일 매매(intraday trading)에서 일관된 성과를 내고자 하는 트레이더를 위해 설계된, 강력하고 모든 기능을 갖춘 트레이딩 시스템입니다. 이 고정밀 지표는 외환(Forex) 및 바이너리 옵션 트레이더 모두에게 기관급 분석을 제공하는 독립적인 종합 트레이딩 시스템 역할을 합니다. 구매 후 저에게 연락해 주시면, 트레이딩 팁과 함께 특별한 보너스를 제공해 드립니다! Scalper Vault는 추측에 의존하거나 복잡한 수동 분석을 할 필요를 없애주며, 사용하기 쉬운 트레이딩 기법을 통해 오직 매매 실행에만 집중할 수 있도록 돕습니다. 정확한 추세 추종 신호: 핵심 알고리즘이 시장 구조를 분석하여, 지배적인 시장 추세 방향과 일치하는 고확률 신호만을 제공함으로써 잘못된 진입을 획기적으로 줄여줍니다. 정밀한 고점 및 저점 탐지: 시장의 움직임이 소진되는 지점을 스캔하여 잠재적인 반전 구간을 식별합니다. 간(Gann) 이론 기반의 매수/매도 구간: 수학적
Trend Catcher ind mt5
Ramil Minniakhmetov
5 (18)
트렌드 캐처 인디케이터 트렌드 캐처 인디케이터는 개발자가 자체 개발한 맞춤형 적응형 트렌드 분석 지표들을 조합하여 시장 가격 움직임을 분석합니다. 단기적인 노이즈를 제거하고 근본적인 모멘텀 강도, 변동성 확대, 가격 구조 움직임에 집중하여 진정한 시장 방향을 파악합니다. 또한 이동 평균, RSI, 변동성 필터와 같은 맞춤형 지표들을 활용하여 가격을 평활화하고 트렌드를 필터링합니다. 실제 운영 모니터링 및 기타 제품은 다음 링크에서 확인하실 수 있습니다:   https://www.mql5.com/en/users/mechanic/seller 텔레그램에서는 EA나 설정 파일을 판매하지 않습니다. 사기이니 주의하세요. 모든 설정 파일은 블로그에서 무료로 제공됩니다. 중요! 구매 후 즉시 연락 주시면 사용 방법 및 보너스를 드립니다!
SIO Oscillator
Davit Beridze
SIO Oscillator: 자기 최적화 세미분산 불균형 오실레이터 지표를 구매하시면 이를 기반으로 한 전문가 어드바이저(EA)를 무료로 받으실 수 있습니다. 대부분의 오실레이터는 모든 가격 움직임을 똑같이 취급합니다. SIO는 상승 압력과 하락 압력을 분리하여 둘 사이의 불균형을 측정하고, 매수자와 매도자 중 어느 쪽이 실제로 시장을 주도하고 있는지 보여줍니다. 불균형이 극단에 도달하면 SIO는 진입가, 손절(Stop Loss), 익절(Take Profit) 수준이 포함된 명확한 신호를 표시합니다. SIO의 차별점은 고정된 설정에 의존하지 않는다는 것입니다. 내장된 자기 최적화 엔진이 현재 종목과 시간 프레임에 맞는 파라미터를 지속적으로 탐색하고, 사용하기 전에 검증합니다. 두 가지 신호 모드 평균 회귀(Mean Reversion): 불균형의 극단에서 거래하며 균형으로의 복귀를 노립니다. 추세 추종(Trend Following): 지속적이고 우세한 불균형의 방향으로 거래합니다. 자
Volatility Master for MetaTrader is a real-time dashboard tool that scans up to  50 symbols  to identify high-volatility , trending markets instantly. With bullish/bearish signals, customizable alerts, and a user-friendly interface, it helps you avoid range-bound conditions and focus on high-probability trades. Clarity leads to confidence. Trade confidently and protect your capital effectively with this powerful dashboard. We don't offer free or bonus indicators in exchange of reviews from you.
Dynamic Forex28 Navigator MT5
Bernhard Schweigert
5 (1)
다중 통화 강도 및 모멘텀 지표 MT5 Dynamic Forex28 Navigator는 오랫동안 사랑받아 온 저희 지표의 진화 버전으로, 세 가지 기능을 하나로 결합했습니다: Advanced Currency Strength28 Indicator (리뷰 700개) Advanced Currency IMPULSE with ALERT (리뷰 530개) CS28 Combo Signals (최근 보너스) 두 이전 지표는 MQL5 Market에서 합계 1,200개가 넘는 리뷰를 받았으며 2016년부터 MT4 커뮤니티의 필수품이었습니다. Dynamic Forex28 Navigator MT5는 검증된 동일한 로직을 그대로 이어갑니다. MetaTrader 5를 위해 완전히 다시 제작 – MT5의 네이티브 다중 심볼 아키텍처를 최대한 활용하도록 설계되었습니다. 사용 설명서: https://www.mql5.com/en/blogs/post/758844 MT4 버전을 찾고 계신가요? 여기를 클릭하세요: ht
AriFocus
Temirlan Kdyrkhan
AriFocus - Non-Repainting Buy/Sell Signals AriFocus - one clear signal. AriFocus marks buy and sell signals directly on the chart and suggests a stop-loss level for each one. Every signal is confirmed on bar close and never repaints. - Buy/sell arrows, confirmed on bar close - Suggested stop-loss level for every signal - Trend band and candle coloring to show direction at a glance - 10 ready-made presets, or your own settings (14 calculation methods) - Pop-up, push and email alerts with entr
Neuro Poseidon MT5
Daria Rezueva
4.68 (53)
Neuro Poseidon is a new indicator by Daria Rezueva. It combines precise trading signals with adaptive TP/SL levels - creating best possible trades as a result! Message me and get  Neuro Poseidon Assistant  as a gift to automize your trading process! What makes it stand out? 1. Proven profitability on all assets and timeframes 2. Only confirmed BUY and SELL signals present on the chart 3. Adaptive TP & SL levels generated by the software for each trade 4. Easy to understand - suitable for al
PZ Swing Trading MT5
PZ TRADING SLU
5 (5)
Protect against whipsaws: revolutionize your swing trading approach Swing Trading is the first indicator designed to detect swings in the direction of the trend and possible reversal swings. It uses the baseline swing trading approach, widely described in trading literature. The indicator studies several price and time vectors to track the aggregate trend direction and detects situations in which the market is oversold or overbought and ready to correct. [ Installation Guide | Update Guide | Tro
Azimuth Pro
Ottaviano De Cicco
5 (7)
Azimuth Pro V2: Synthetic Fractal Structure and Confirmed Entries for MT5 Overview Azimuth Pro is a multi-level swing structure indicator by Merkava Labs . Four nested swing layers, swing-anchored VWAP, ABC pattern detection, three-timeframe structural filtering, and closed-bar confirmed entries — one chart, one workflow from micro-swings to macro-cycles. This is not a blind signal product. It is a structure-first workflow for traders who care about location, context, and timing. Halloween P
SkyHammer Signal Pro
Shengzu Zhong
5 (5)
SkyHammer Signal Pro Entry, SL, TP 레벨이 고정되는 전문 No-Repaint 추세 신호 인디케이터 SkyHammer Signal Pro는 명확하고 고정되며 검증 가능한 신호를 원하는 트레이더를 위해 설계된 구조적인 추세 및 모멘텀 신호 인디케이터입니다. 특히 M1 및 M5 같은 낮은 시간대에서 가장 효과적으로 작동합니다. 이 인디케이터는 시장의 고점이나 저점을 예측하려고 하지 않습니다. 대신 신호를 생성하기 전에 확인된 시장 구조, 추세 방향, 모멘텀 강도, 건강한 변동성, 그리고 목표까지의 충분한 공간을 기다립니다. 주요 기능 고정 신호 메커니즘 신호가 확인되면 화살표, Entry, Stop Loss, TP1, TP2 레벨이 차트에 영구적으로 고정됩니다. 이후 캔들 움직임 때문에 신호가 사라지거나, 이동하거나, 변경되지 않습니다. 이를 통해 트레이더는 각 신호를 명확하게 검토할 수 있으며, 실시간 시장에서 신호가 사라지는 일반적인 문제를 피할 수 있습니다
가격이 역전되고 후퇴함에 따라 시장 구조가 변경됩니다. 시장 구조 반전 경고 표시기는 추세 또는 가격 움직임이 고갈에 가까워지고 반전할 준비가 되었음을 식별합니다. 일반적으로 반전이나 큰 하락이 일어나려고 할 때 발생하는 시장 구조의 변화를 알려줍니다. 지표는 가능한 고갈 지점 근처에서 새로운 고점 또는 저점이 형성될 때마다 초기에 돌파와 가격 모멘텀을 식별합니다. 표시기는 반대쪽에 있는 마지막 촛불에 직사각형을 그립니다. 그런 다음 현재의 단기 추세에서 계속 움직이기 때문에 가격과 함께 직사각형을 따라갈 것입니다. 가격이 사각형 위나 아래로 다시 닫힐 정도로 약해지면 시장 구조에 잠재적인 변화가 일어나고 있음을 나타냅니다. 그런 다음 표시기는 방향의 잠재적인 이동과 추세 또는 주요 하락의 가능한 반전 시작에 대해 경고합니다. 작동 방식을 보려면 아래의 작동 표시기를 참조하십시오! 모든 쌍 및 주요 기간을 모니터링하는 대시보드: https://www.mql5.com/en/m
Advance AI Scanner
Mohamed Samsudeen
5 (1)
Advance AI Scanner is a multi-symbol analysis indicator for MetaTrader 5. It scans Forex pairs, metals, energy, stock indices and cryptocurrencies at the same time and rates each instrument with its own self-training model. It explains in plain English what moved each market and why, and it estimates how far upcoming economic news usually moves each symbol, measured on your broker's own price history. $199 instead of $499. 10 copies left at this price. One time purchase  Installation and User
DayTrader PRO
Davit Beridze
5 (4)
DayTrader PRO DayTrader PRO는 존 에러스(John Ehlers)의 Laguerre 필터와 강력한 자동 최적화 엔진을 결합한 고급 트레이딩 지표입니다. 고정된 파라미터를 사용하는 대신, 최근 시장 상황을 바탕으로 최적의 설정을 자동으로 검색하므로 지속적인 수동 조정 없이도 변화하는 시장 변동성에 대응할 수 있습니다. 이 지표는 명확한 매수(BUY) 및 매도(SELL) 신호를 생성하며, 현재 시장 변동성을 기준으로 계산된 적응형 손절매(Stop Loss) 및 익절(Take Profit) 레벨을 제공합니다. 내장된 추세, 효율성 지수(Efficiency Ratio), 변동성 및 캔들 필터 기능은 저품질의 진입 신호를 제거하여 신호의 정확도를 높여줍니다. 실시간 성능 대시보드에서는 현재 최적화된 설정값, 수익 요인(Profit Factor), 승률(Win Rate), 최대 낙폭(Drawdown) 및 기타 트레이딩 통계를 확인할 수 있습니다. 또한 DayTrader PR
Bill Williams Advanced
Siarhei Vashchylka
5 (11)
Bill Williams Advanced is designed for automatic chart analysis using Bill Williams' "Profitunity" system. The indicator analyzes four timeframes at once. Manual (Be sure to read before purchasing) Advantages 1. Analyzes the chart using Bill Williams' "Profitunity" system. Signals are displayed in a table in the corner of the screen and on the price chart. 2. Finds all known AO and AC signals, as well as zone signals. Equipped with a trend filter based on the Alligator. 3. Finds "Divergence Bar
Apex Patterns PRO 인디케이터 구매 시 - 기반 Expert Advisor 무료 제공. 자체 최적화 차트 패턴 및 브레이크아웃 분석 시스템 기존의 패턴 스캐너는 고정된 파라미터에 의존하므로 시장 변동성과 구조가 변화할 때 성능이 저하되는 경우가 많습니다. Apex Patterns PRO는 구조적 차트 패턴 인식, 모멘텀 필터링, 통계적 자체 최적화를 하나의 분석 프레임워크로 결합하여 변화하는 시장 환경에 적응하도록 설계되었습니다. 적응형 스캐닝 엔진 자체 최적화 패턴 모드 최근 과거 데이터를 바탕으로 적절한 패턴 파라미터를 자동으로 탐색하여, 정적인 설정 대신 현재 시장 행보에 맞춰 인디케이터의 구조 감지 방식을 적응시킵니다. 스마트 브레이크아웃 필터링 클래식 패턴 인식과 모멘텀, 거래량, 프라이스 액션 지표를 결합합니다. 모든 브레이크아웃을 동일하게 다루는 대신, 시장의 기저 구조를 평가하여 현재 통계적 환경에 부합하는 셋업을 식별합니다. 주요 기능 리페인트 없는 고
Power Candles MT5
Daniel Stein
4.58 (12)
Power Candles V3 - 자체 최적화 강도 지표 파워 캔들 V3는 적용된 모든 차트에서 통화 및 상품의 강세를 실행 가능한 거래 계획으로 전환합니다. 단순히 캔들에 색상을 입히는 대신, 백그라운드에서 실시간 자동 최적화를 수행하여 현재 보고 있는 종목에 대한 최적의 손절매, 익절 및 신호 임계값을 제공합니다. 한 번의 클릭으로 실시간 거래에 적용할 수 있으며, 진입점, 손절매 및 익절 선이 정확한 가격에 맞춰 차트에 표시되고, 방향과 함께 알림이 발령됩니다. 이 도구는 Stein Investments 에코시스템의 일부입니다. 18개 이상의 도구와 함께 당신의 1대1 AI 트레이딩 멘토 Max.  항상 대기 중, 모든 인디케이터를 깊이 있게 이해, 무언가를 차근차근 생각해보고 싶은 순간에 도움을 줍니다.  https://stein.investments 에서 만나보세요 매 종가 바마다 3,000회 이상의 트레이딩 시뮬레이션. 9가지 강도 상태. 2가지 전략을 병렬로 테스트.
제작자의 제품 더 보기
Frontier Pivots
Nestor Jose Mendez Boza
FRONTIER PIVOTS - Geometric Levels Indicator This indicator plots support and resistance levels/ranges on the chart using mathematical calculations. It helps traders identify potential price reaction zones based on geometric patterns. Main Features: Automatically calculates and displays key price levels Plots both support and resistance lines Uses daily price data for level calculation Clean visual presentation with different colors for different level types No repainting - levels remain static
FREE
Projection of Phi
Nestor Jose Mendez Boza
Projection of Phi   Is a technical indicator that calculates dynamic support and resistance levels. It uses angular geometric projections and mathematical ratios to identify market expansion ranges. Features: Dynamic Fibonacci Expansion: Extension level projection Geometric Calculation: Angular analysis and mathematical ratios Visualization: Graphical objects with informative labels Compatibility: M1 to H4 timeframes Applications: Identification of zones for trade management Analysis of volatil
FREE
End Flow Momentum
Nestor Jose Mendez Boza
END FLOW MOMENTUM  Capital Flow Analysis with a Geometric Approach Overview End Flow Momentum   is a technical indicator that blends volume, price, and volatility analysis into a visual tool. Designed for traders seeking an alternative capital flow analysis tool. Key Features 1. Mathematical Foundation Proprietary Calculation Model:   Uses a mathematical core that serves as a dynamic central reference point. Volatility-Adaptive Scaling:   Utilizes the asset's inherent volatility as the primary
필터:
리뷰 없음
리뷰 답변