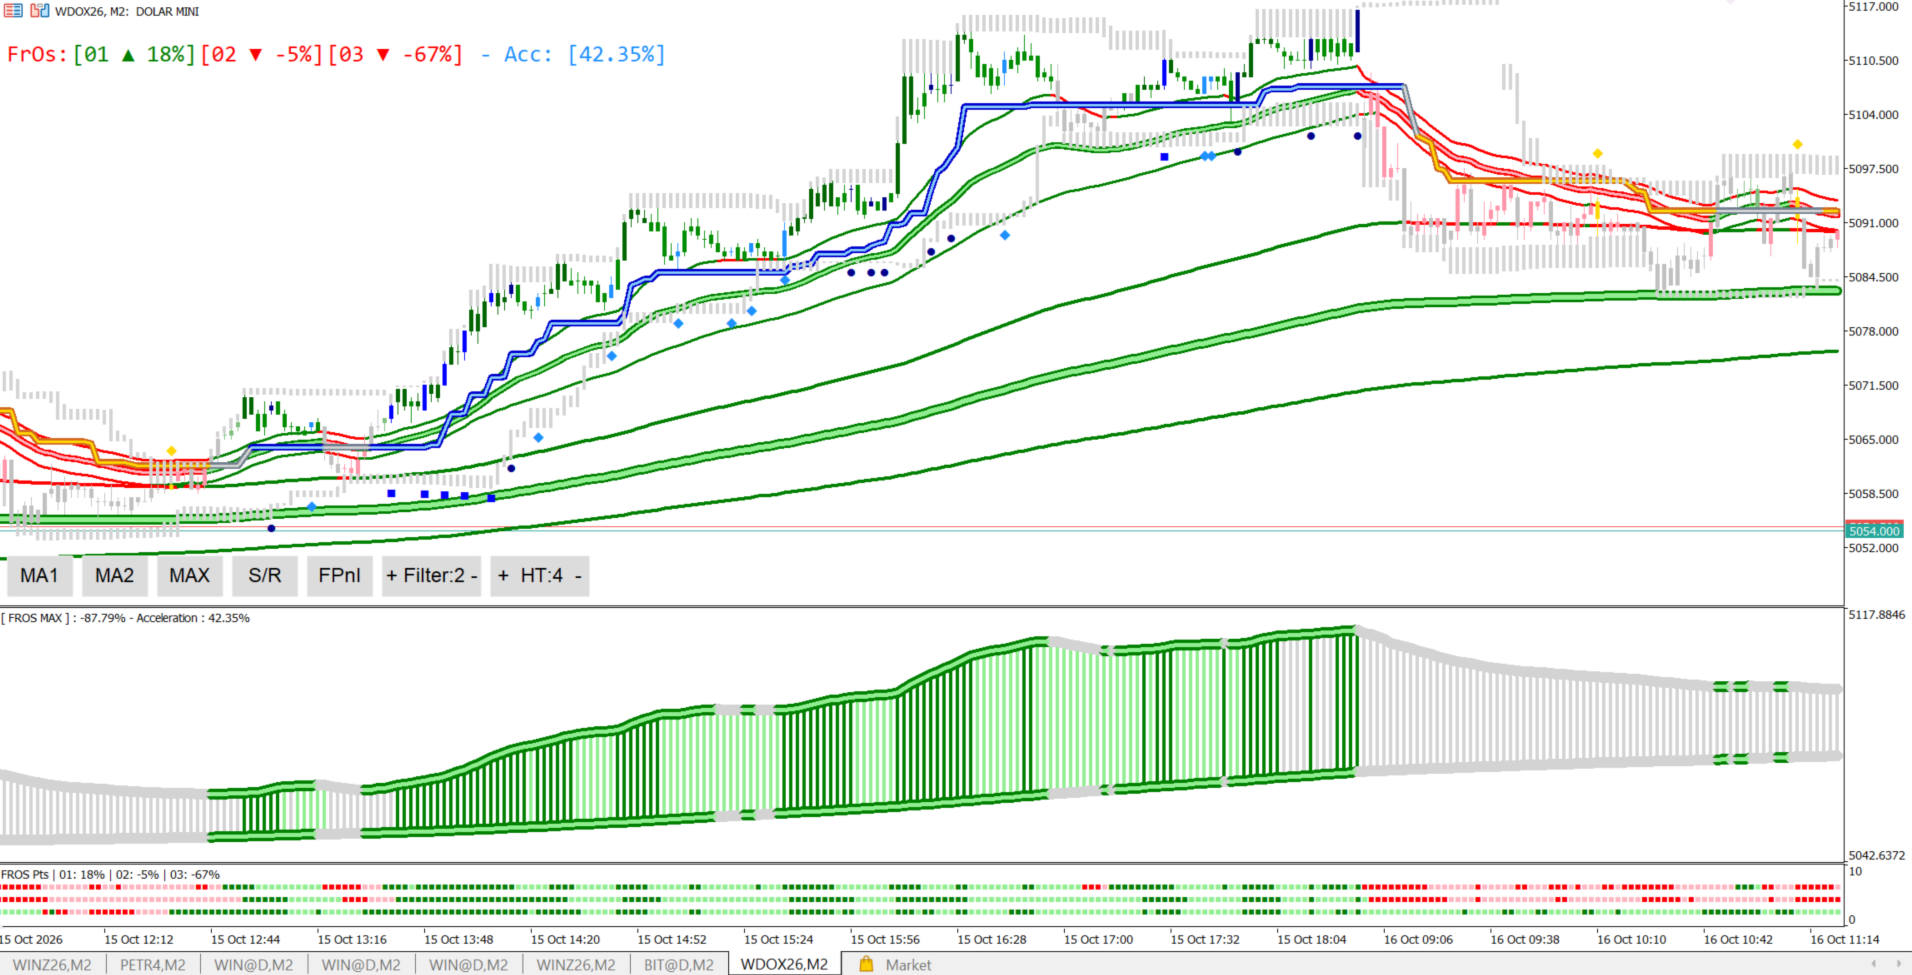
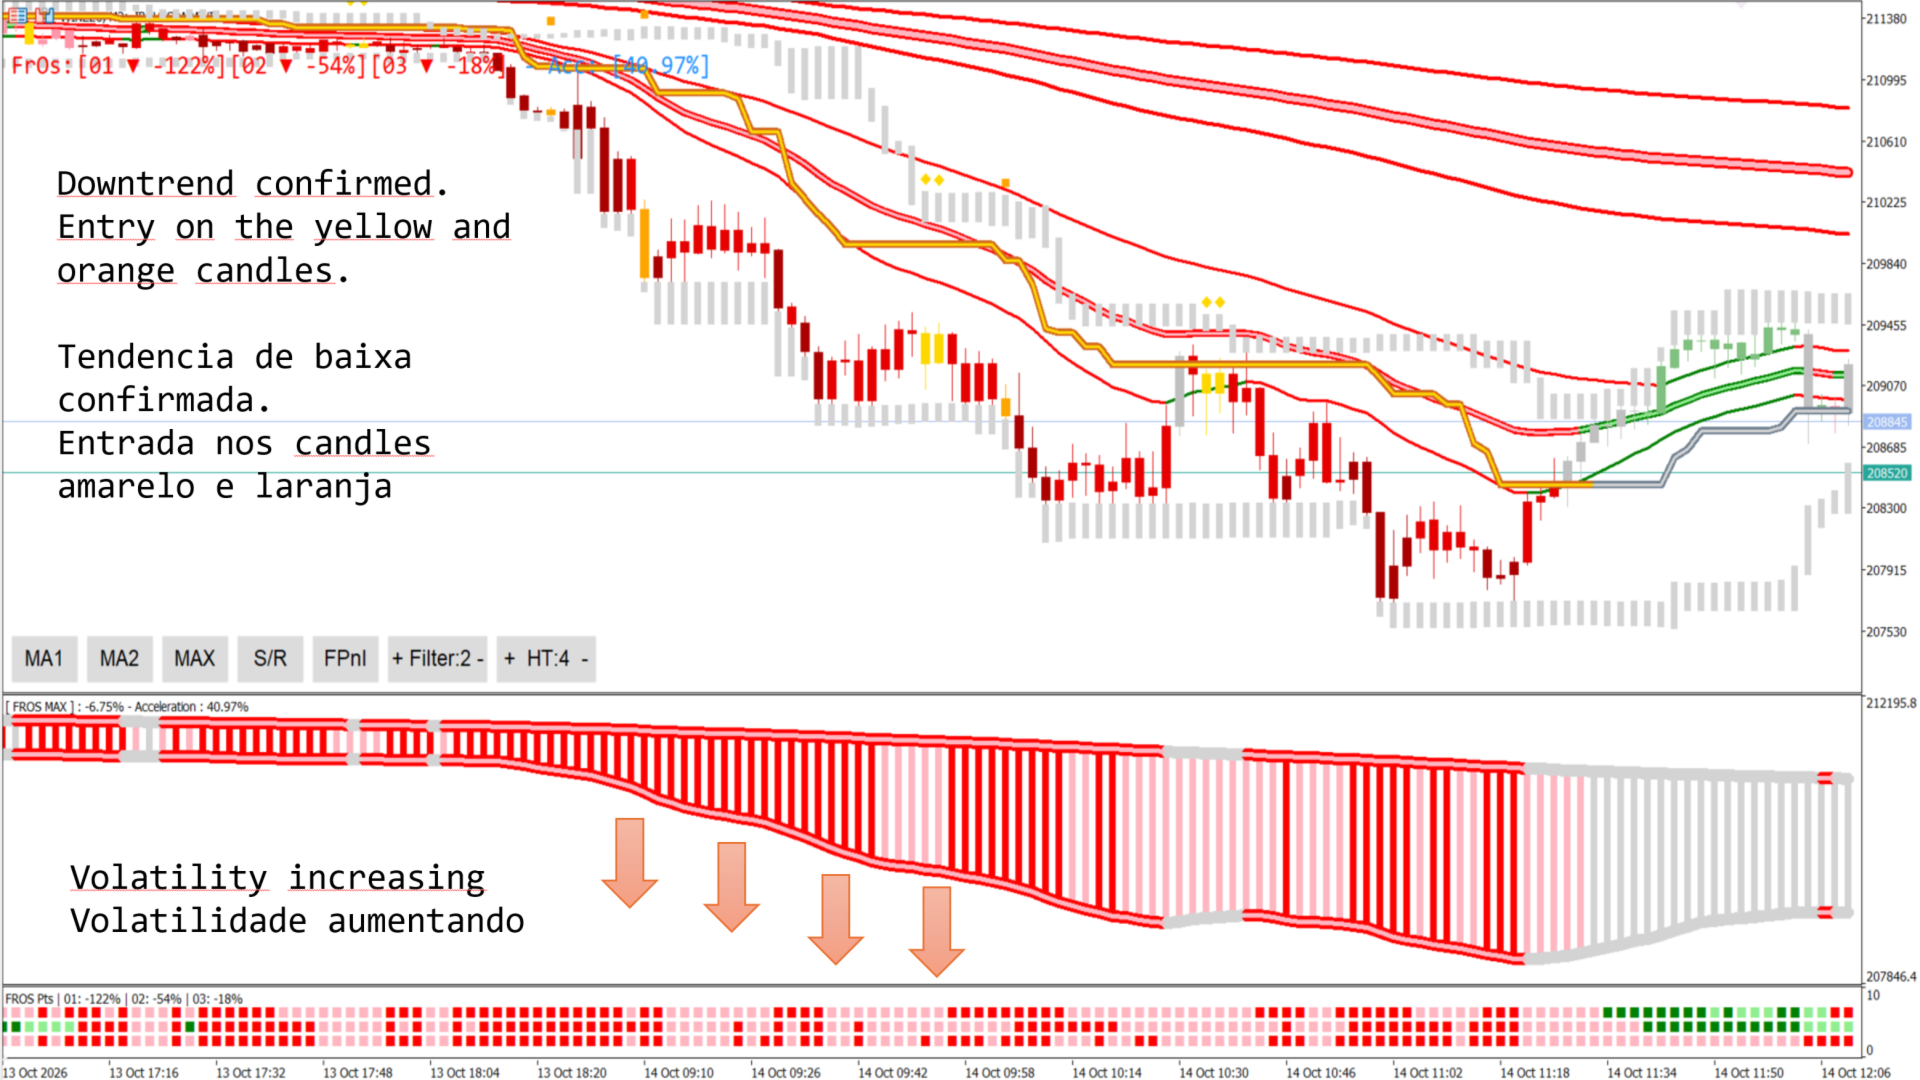
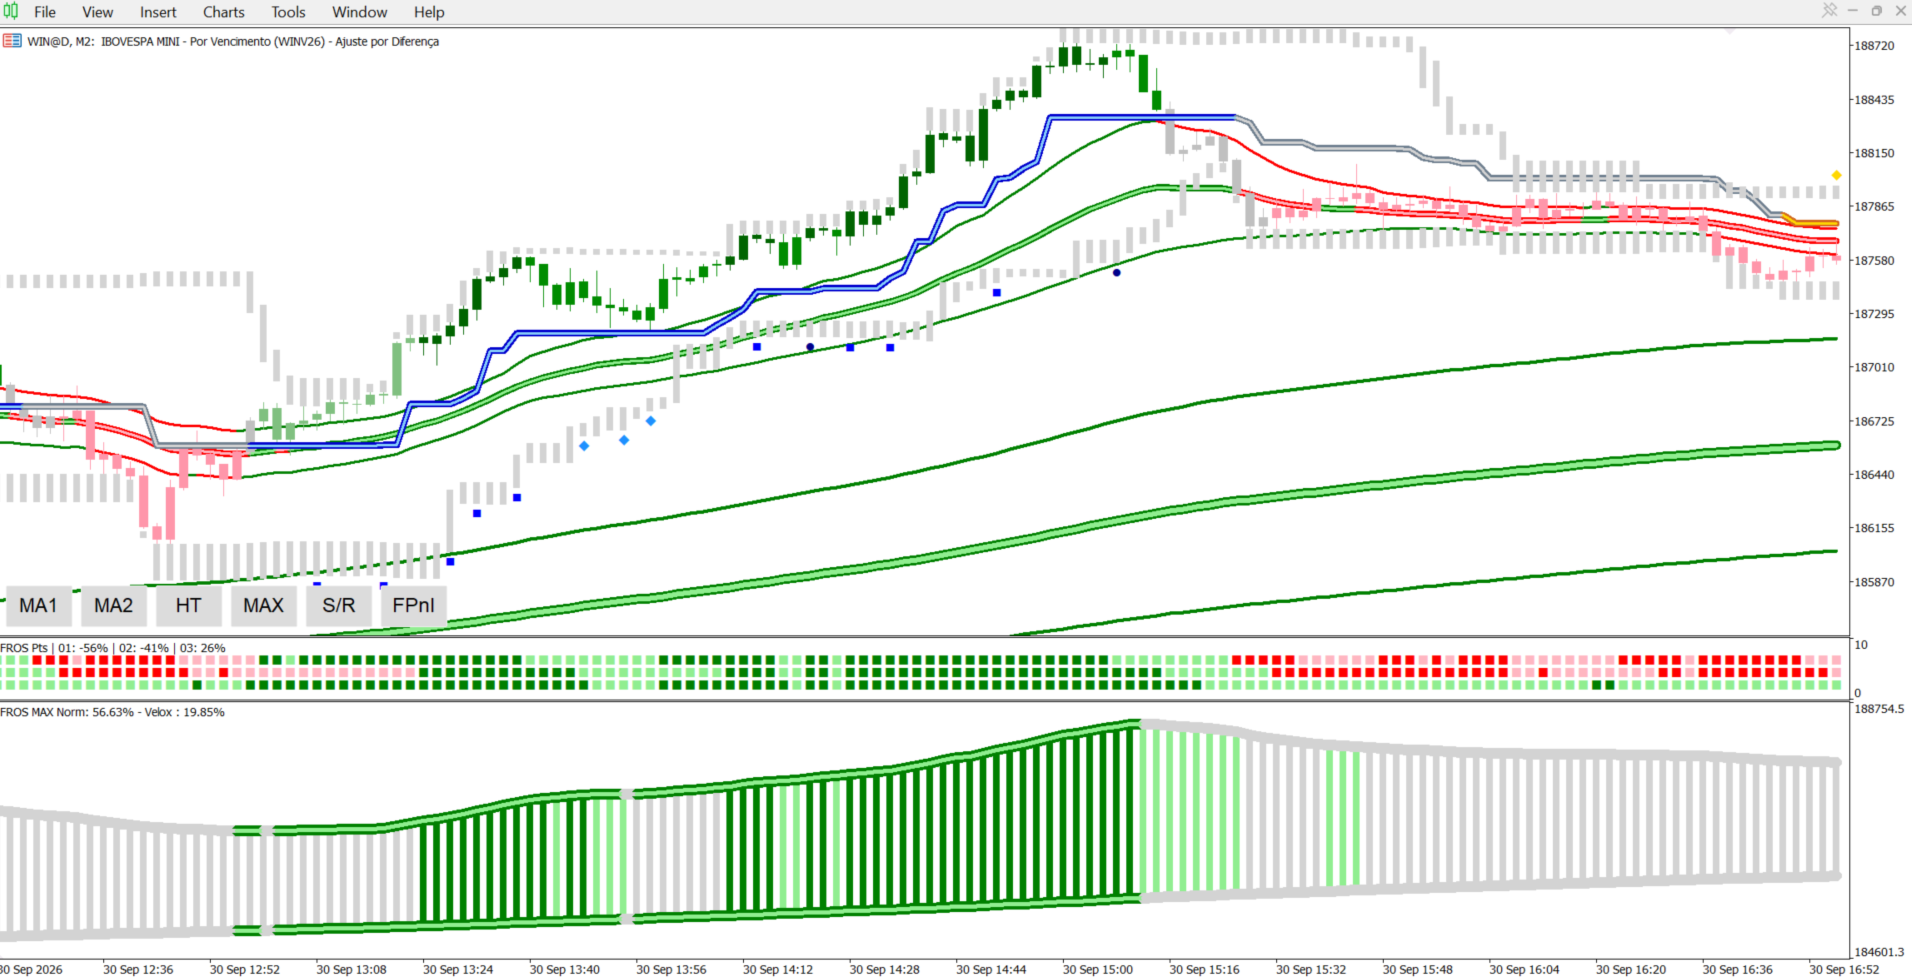
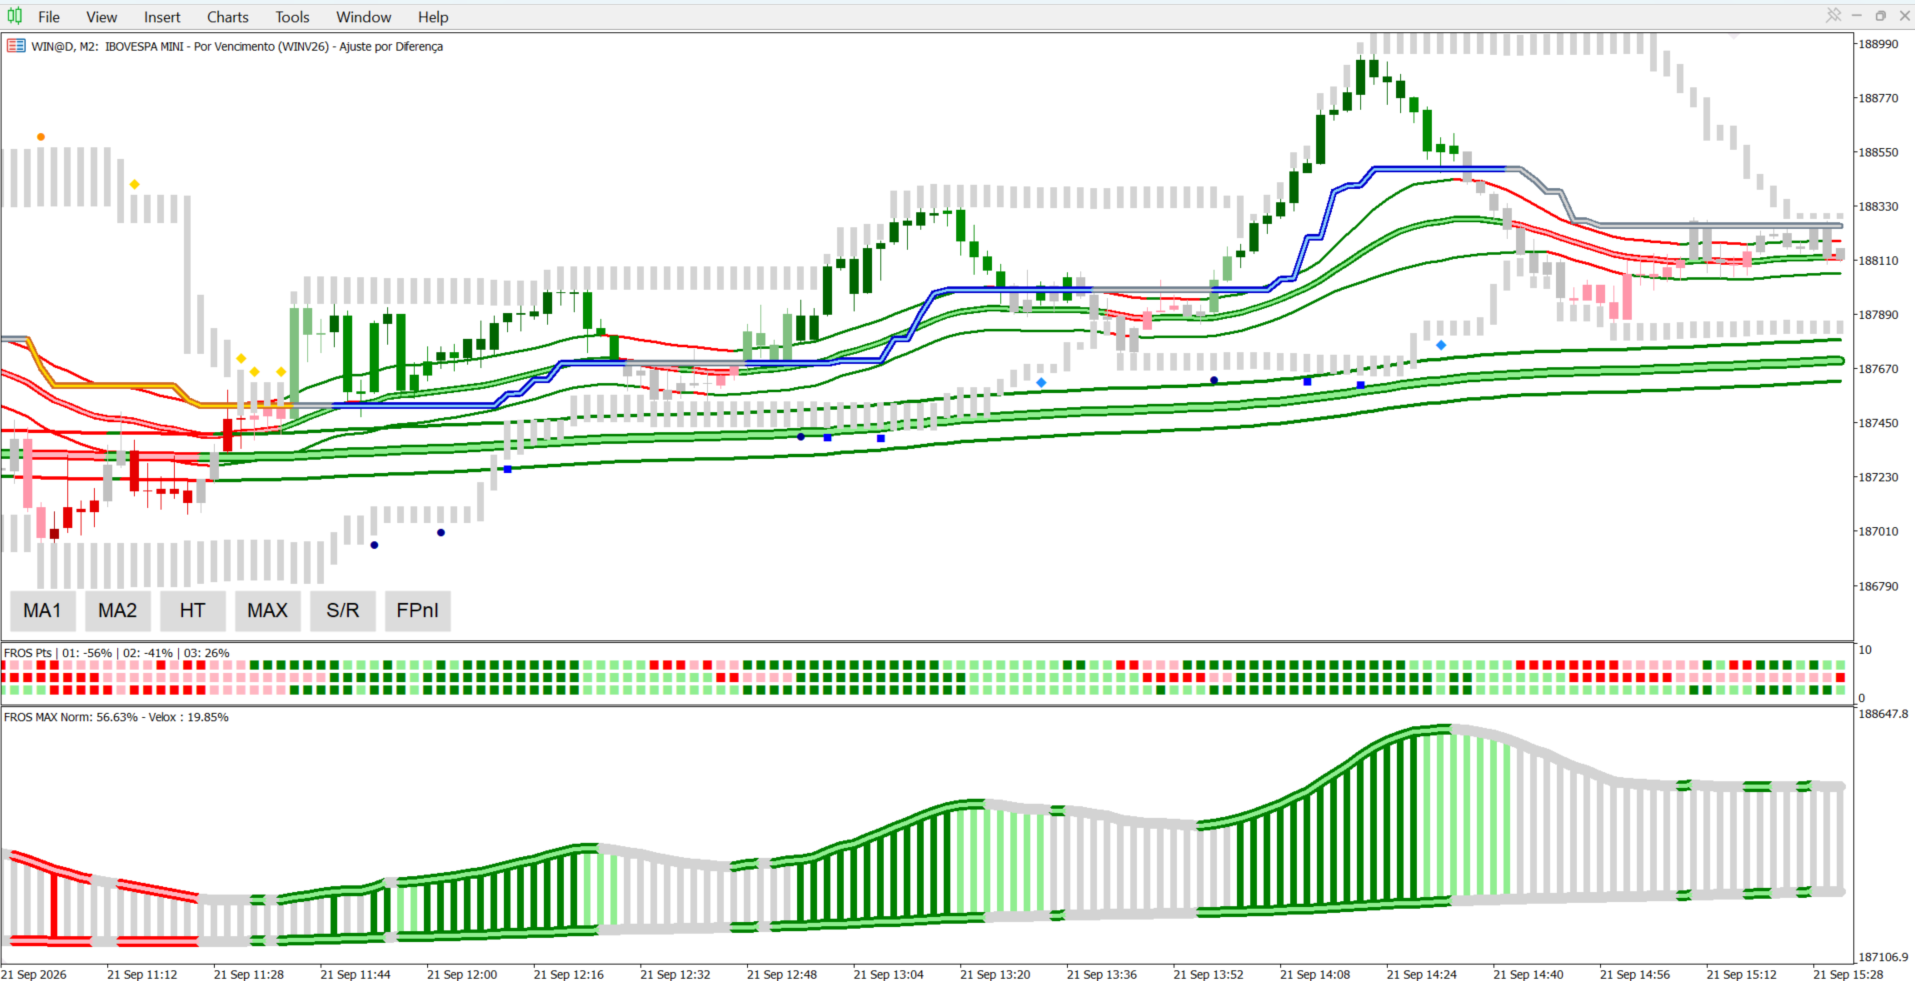
Hexo Trade System
- Indicators
-
Mateus Cerqueira Lopes
 Programador da Empresa Hexo Quant.
Desenvolvimento de Indicadores e EA. - Version: 5.0
- Updated: 19 October 2026
- Activations: 5
The Trading System for Trend Surfers
Discover the full version of our advanced trading system developed to trade in alignment with institutional order flow. The suite includes:
- Hexo Short Average & Hexo Long Average
- Hexo Candle Coloring (6 Shades)
- Hexo FrOs Max (Advanced Fractal Oscillator)
- Hexo Support and Resistance (Dynamic Levels)
- Entry and Exit Signals (Arrows)
- Hexo Trend (Filter and Trailing Stop)
- Fractal Oscillator Painel
1. Hexo Moving Averages
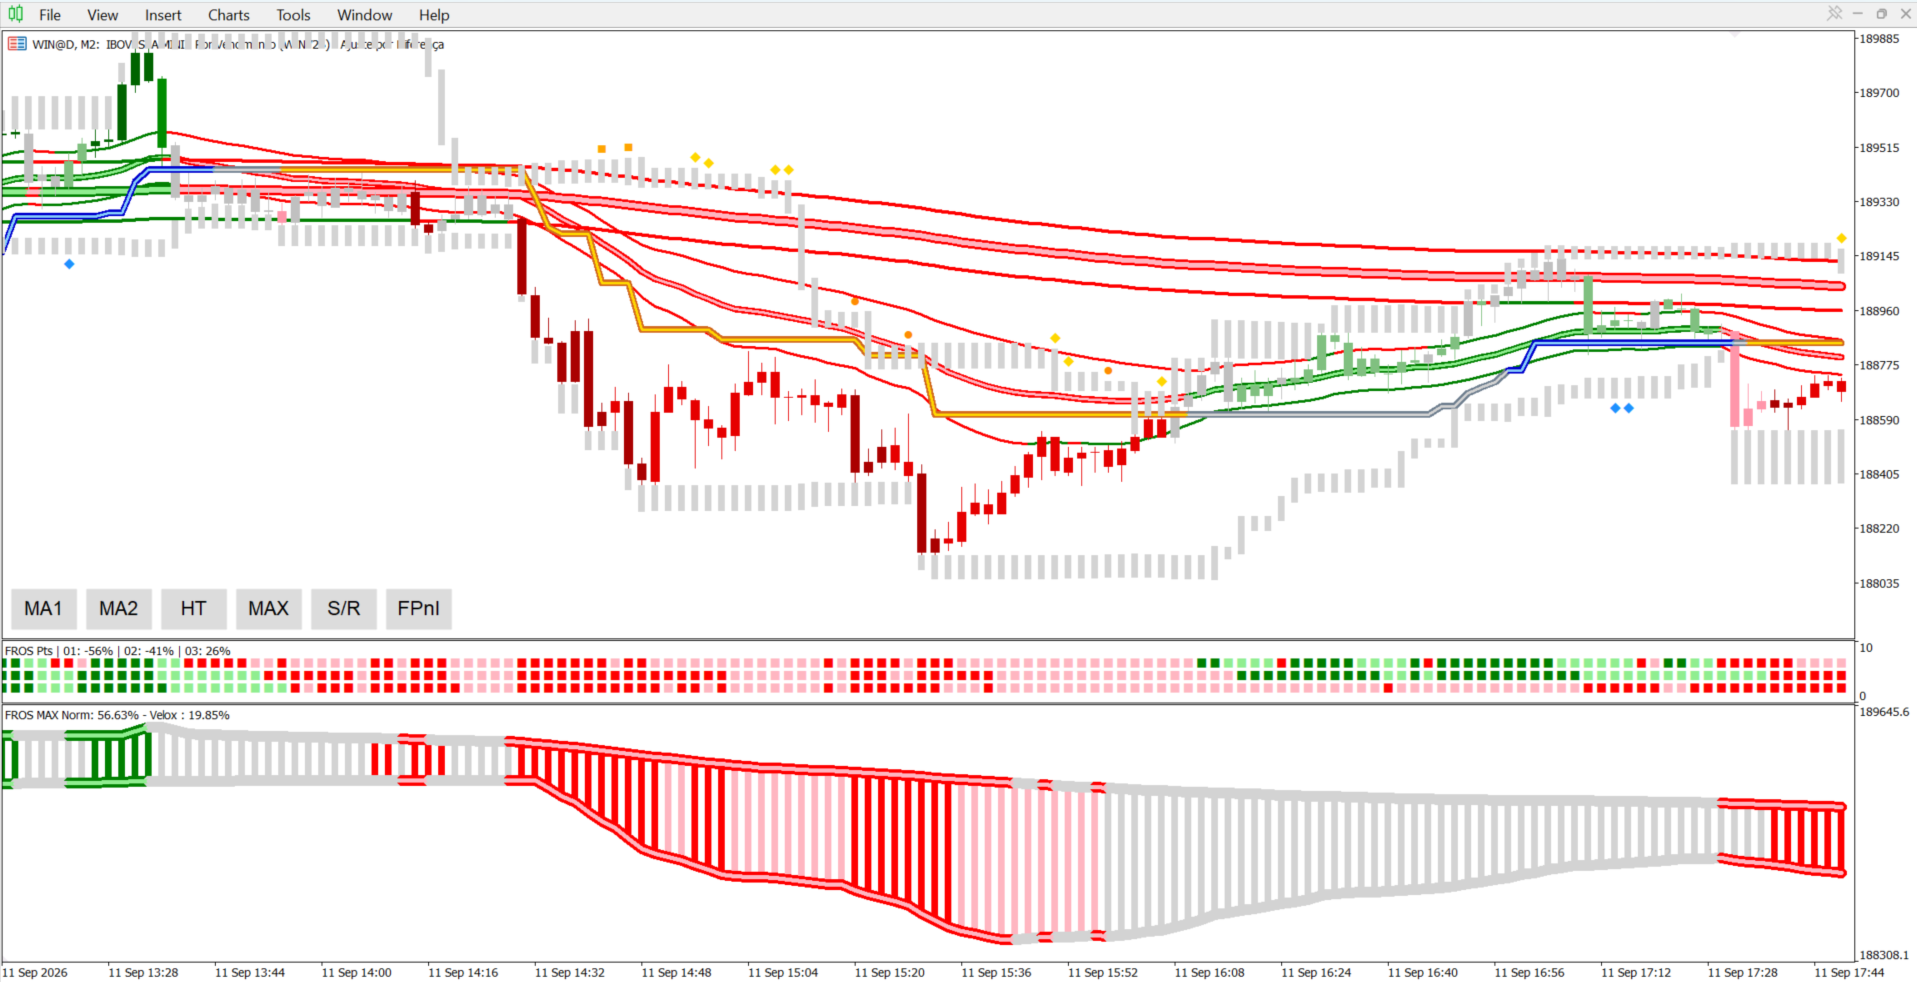
Hexo Averages are an advanced tracking model featuring smooth proprietary calculation, designed to outperform traditional moving averages (simple or exponential):
- Immediate Identification: Dynamic color change signaling uptrend strength (green) or downtrend strength (red).
- Noise Filter: Ultra-smooth curve eliminating whipsaws typical of short-term volatility periods.
- Dynamic Support and Resistance: The lines act as defensive zones where price tends to retest and resume the primary trend.
2. Hexo Candle Coloring
Visual tool grading trend strength bar by bar through 6 mathematically calculated shades:
- Uptrend: Light Green (Alert/Start) | Green (Confirmation) | Dark Green (Maximum Strength)
- Downtrend: Pink (Alert/Start) | Red (Confirmation) | Dark Red (Maximum Strength)
Note: Darker shades represent greater momentum and directional volume.
3. Hexo FrOs Max (Multiscale Fractal Oscillator)
The core confirmation engine of the system, combining directional lines and a central momentum histogram:
- Flow & Smoothing: Filters micro-oscillations to clearly reveal dominant market flow.
- Directional Lines: Green for bullish, red for bearish, and gray for transition/indecision.
- Acceleration Histogram: Gauges whether momentum is accelerating or decelerating. Healthy trends align direction, velocity, and acceleration simultaneously.
4. Hexo Support and Resistance
Dynamic tool that automatically updates support and resistance levels based on real volatility and recent price action, replacing static manual drawings.
5. Entry and Exit Signals (Arrows)
Visual on-chart indications (arrows and candle highlights) pinpointing optimal trigger zones for opening and closing positions. Objective and Non-Repainting signals once the candle closes.
6. Hexo Trend
An evolved implementation of the SuperTrend concept, engineered for simplicity and clarity. Switches color (green/red) as price crosses the reference line. Excellent as a master trend filter and dynamic Trailing Stop.
7. Fractal Oscillator Panel
This panel consists of 3 horizontal rows of square blocks indicating the trend direction and momentum across three different timeframes:
Row 01 (Top): Short Term Row 02 (Middle): Medium Term Row 03 (Bottom): Long Term
Uptrend (Positive Values):
Dark Green: Uptrend gaining strength (buying momentum accelerating).
Light Green: Uptrend losing strength (buying momentum slowing down / exhaustion).
Downtrend (Negative Values):
Dark Red: Downtrend gaining strength (selling momentum accelerating).
Light Red / Pink: Downtrend losing strength (selling momentum slowing down / exhaustion).
Percentage Strength in Header: The values shown next to the indicator name (e.g., 01: -56% | 02: -41% | 03: 26%) indicate the normalized trend strength on the current bar:
Positive Values (0% to +100%): Bullish momentum. Closer to +100% means a stronger uptrend.
Negative Values (0% to -100%): Bearish momentum. More negative (closer to -100%) means a stronger downtrend.
Trading Tip:
Avoid trading when the three rows display conflicting colors (ranging or transition phase).
Wait for all three rows to align in the same color/direction to look for higher-probability entries in favor of the trend.
8. Operational Rules
- Long Only (Buys): Short Average above Long Average and diverging, both green, candles predominantly Green / Dark Green, confirmed by auxiliary indicators.
- Short Only (Sells): Short Average below Long Average and diverging, both red, candles predominantly Red / Dark Red, confirmed by auxiliary indicators.
- Stay Out (Flat): Overlapping or intertwined averages indicate consolidation and absence of trend.
Important: Day trading develops clean trends only about 20% to 25% of the time. The secret to consistency is preserving capital in choppy ranges and riding with high conviction when the trend confirms.