Fibonacci Probability Zones
- Indicators
- Version: 1.0
- Activations: 16

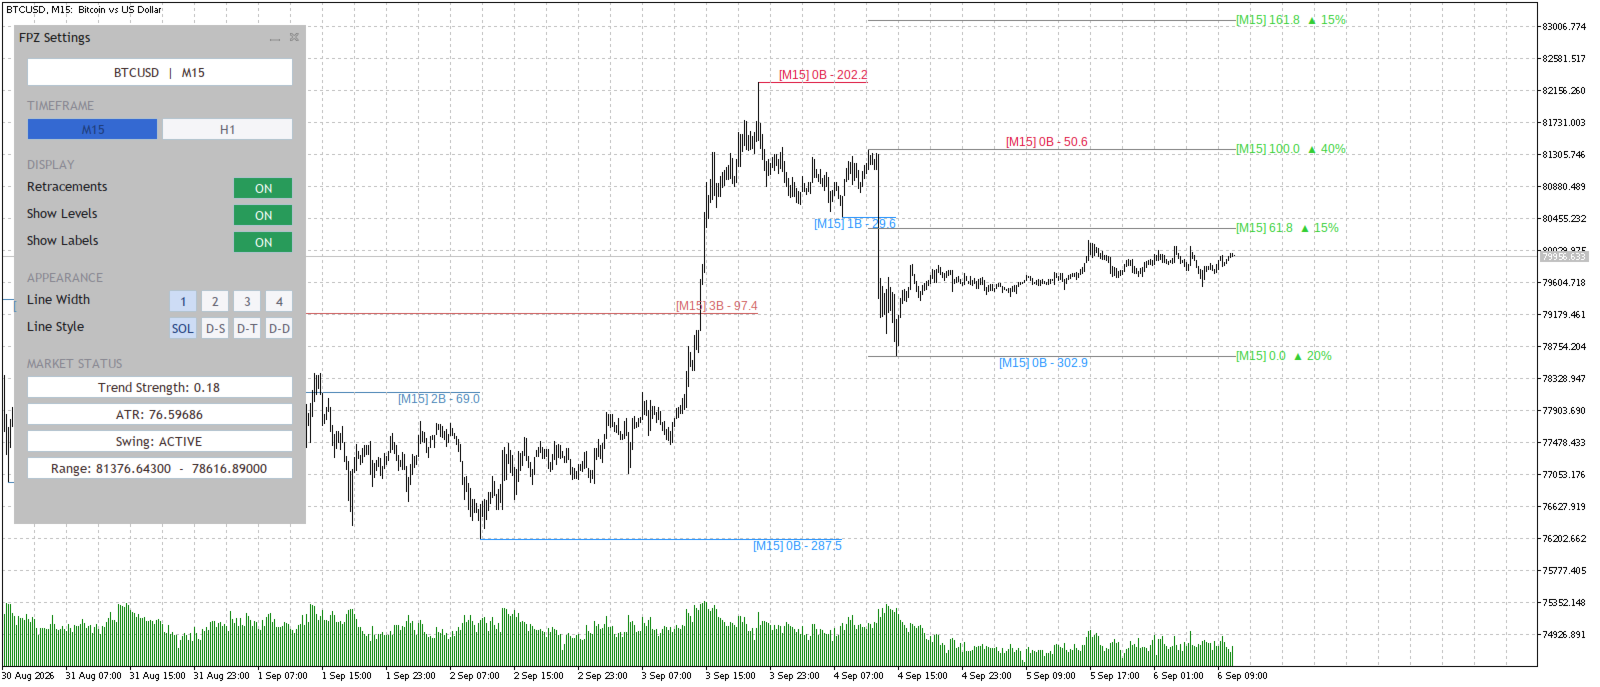
Fibonacci Probability Zones is an indicator for MetaTrader 5 that scores the confluence and historical reliability of Fibonacci retracement levels across multiple timeframes, giving each level a direction and a confidence percentage rather than just a static line.
Key Features
1. Dual Pivot Source
- Detects swings using either a Fibonacci ATR engine or the classic ZigZag (Depth, Deviation, Backstep) — selectable per instance.
2. Multi-Timeframe Analysis
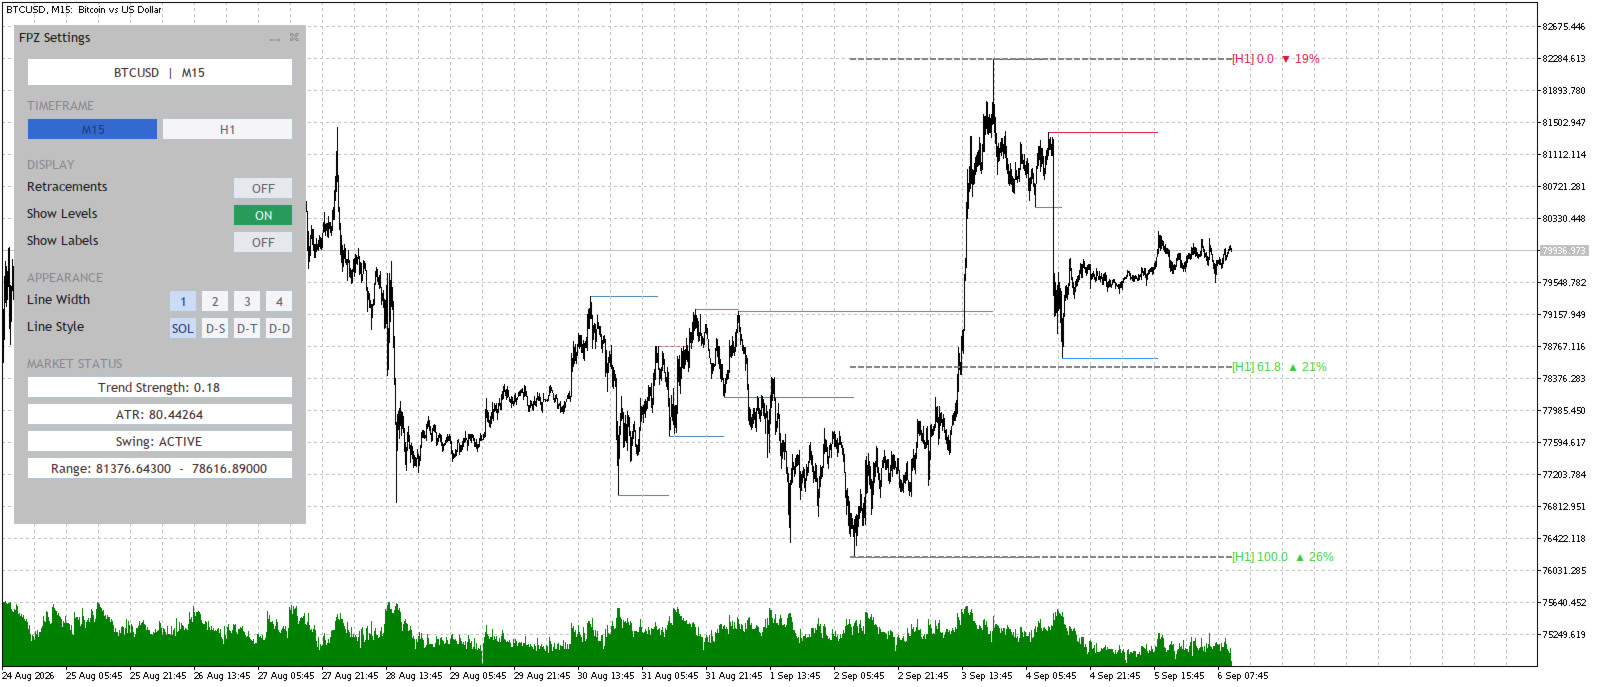
- Runs the same Fibonacci grid across any combination of timeframes you specify.
- Each timeframe's Levels can pick up confluence from every other enabled timeframe, not just its own.
3. Fibonacci Probability Scoring
- Every Fibonacci level is scored using a weighted blend of touch count, ratio-quality (how closely historical levels matched that exact Fibonacci ratio), and trend strength.
- Produces a directional arrow (▲/▼) and a confidence percentage for each level, per timeframe.
4. Level & Zone Detection
- Builds support/resistance Levels from swing pivots, extending them forward until broken.
- Broken (breakout) levels are shown in a distinct color from active (extension) levels.
5. Independent Visualization Controls
- Separate on/off toggles for Levels/Zones, Fibonacci Retracement lines, and their labels — shown or hidden independently, per timeframe.
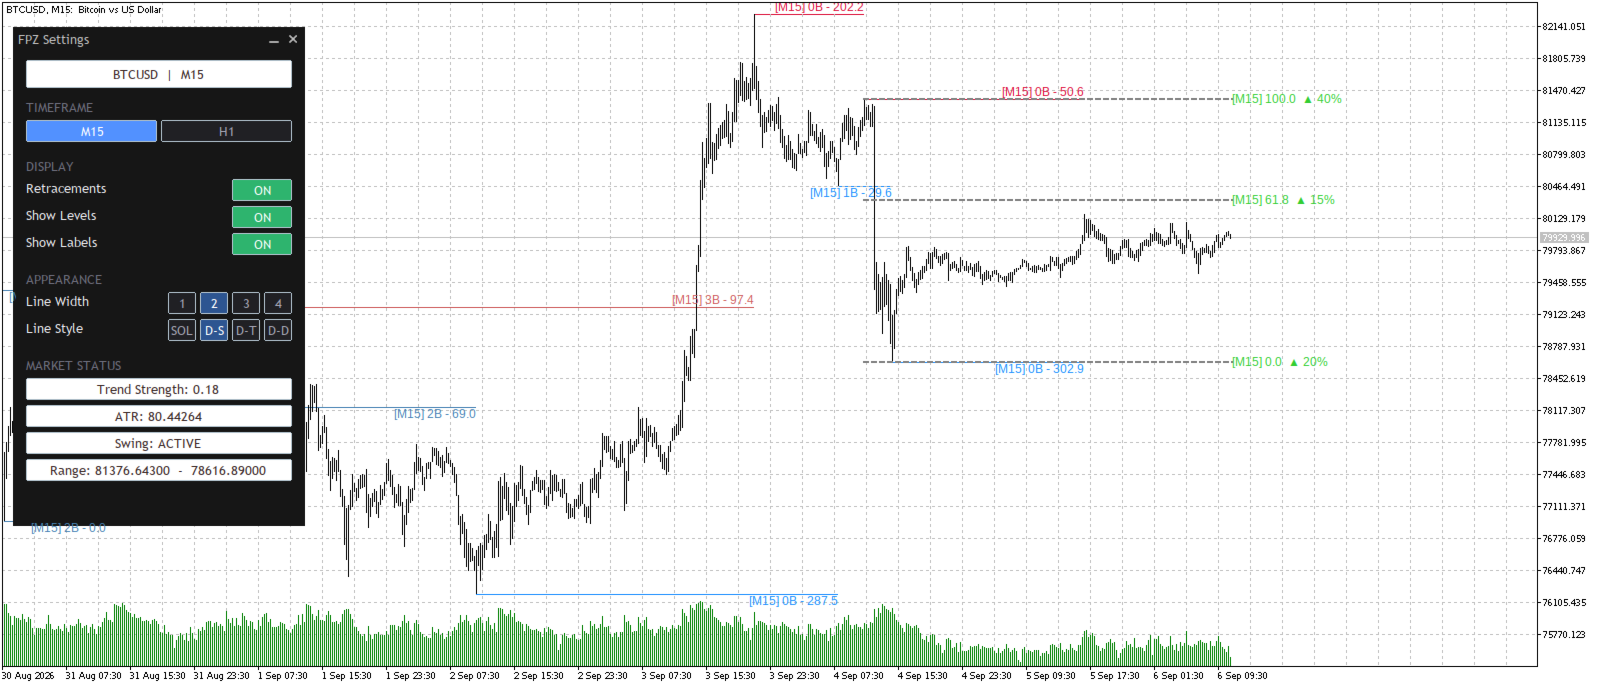
- Adjustable line width, dash style, and font size per timeframe.
Key Benefits
- Turns static Fibonacci retracements into a probability-weighted read on which levels are actually likely to hold.
- Cross-timeframe confluence detection surfaces levels reinforced by higher or lower timeframes.
- Distinguishes broken levels from active ones at a glance.
- Independent display toggles mean you can isolate zones, retracements, or labels without losing the others.
- Self-contained: no separate indicators to install.
Who This Indicator Is For
- Traders who use Fibonacci retracements and want a data-driven read on level reliability instead of eyeballing it.
- Multi-timeframe traders who want confluence between higher and lower timeframe structure.
- Users who prefer configurable, live-adjustable visualization of levels and probability data.
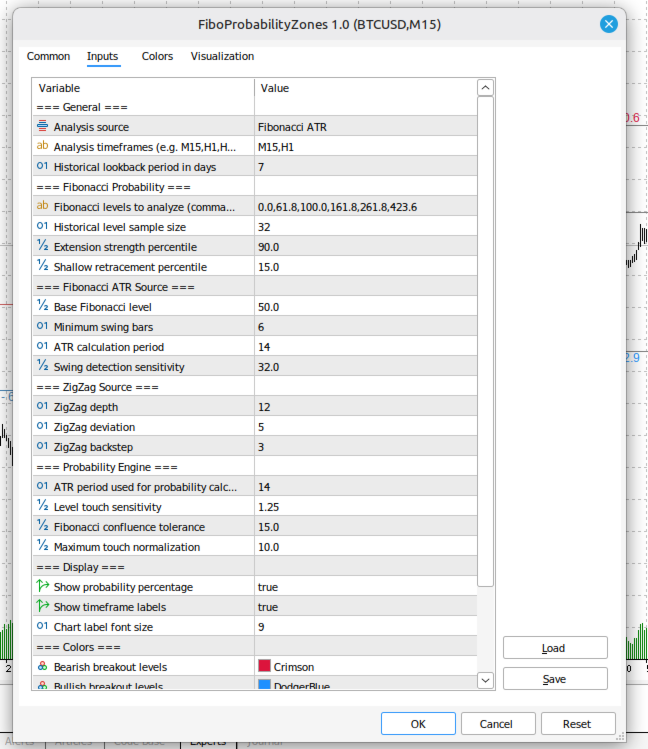
Input Parameters
| Parameter Group | Parameter | Description |
|---|---|---|
| General | ||
| General | Source | Choose Fibonacci ATR or ZigZag as the pivot source. |
| General | Timeframes | Comma-separated list of timeframes to analyze (empty = current chart). |
| General | Lookback (Days) | Number of days of history to analyze. |
| Fibonacci Probability | ||
| Fibonacci Probability | Fibonacci Levels | Comma-separated list of Fibonacci ratios to score (e.g. 0, 61.8, 100, 161.8). |
| Fibonacci Probability | Level Sample | Number of historical levels sampled for trend/percentile calculations. |
| Fibonacci Probability | Extension Percentile | Percentile marking a "strong extension" level. |
| Fibonacci Probability | Shallow Percentile | Percentile marking a "shallow retracement" level. |
| Fibonacci ATR Source | ||
| Fibonacci ATR Source | Base Fibonacci Level | Base level used by the Fibonacci ATR swing engine. |
| Fibonacci ATR Source | Minimum Swing Bars | Minimum bars required to confirm a swing. |
| Fibonacci ATR Source | ATR Period | ATR period feeding the swing detector. |
| Fibonacci ATR Source | ATR Threshold Multiplier | Sensitivity of swing detection to ATR. |
| ZigZag Source | ||
| ZigZag Source | Depth | Number of bars used to detect pivots. |
| ZigZag Source | Deviation | Minimum price movement required to form a pivot. |
| ZigZag Source | Backstep | Number of bars used to filter nearby pivots. |
| Probability Engine | ||
| Probability Engine | ATR Period | ATR period used for touch-distance calculations. |
| Probability Engine | Touch Sensitivity (ATR) | ATR multiple defining how close price must come to count as a "touch." |
| Probability Engine | Fibonacci Confluence Tolerance | Ratio-point distance beyond which confluence quality drops to zero. |
| Probability Engine | Max Touch Normalizer | Touch count used to normalize the touch-score component. |
| Display | ||
| Display | Show Probability | Show the confidence percentage and direction arrow on labels. |
| Display | Timeframe Tag | Prefix labels with their source timeframe. |
| Display | Font Size | Chart label font size. |
| Colors | ||
| Colors | High/Low Breakout Colors | Independent colors for broken resistance and support levels. |
| Colors | High/Low Extension Colors | Independent colors for active resistance and support levels. |
| Panel | ||
| Panel | Theme | Light or dark panel color theme. |
Summary
- Fibonacci Probability Zones scores Fibonacci retracement levels using touch count, ratio quality, and trend strength across any set of timeframes you choose.
- Each level gets a direction and confidence percentage instead of a plain static line.
- An interactive on-chart panel gives independent, live control over Levels, Retracements, and Labels.
Disclaimer
Trading financial markets involves risk. This indicator does not guarantee any specific outcome and should not be used as the sole basis for trading decisions. It is intended for analytical purposes only.