Single TF SR Pro
- Indicators
- Maksim Golubev
- Version: 1.0
- Activations: 5
Single TF SR Pro – Support and Resistance Indicator
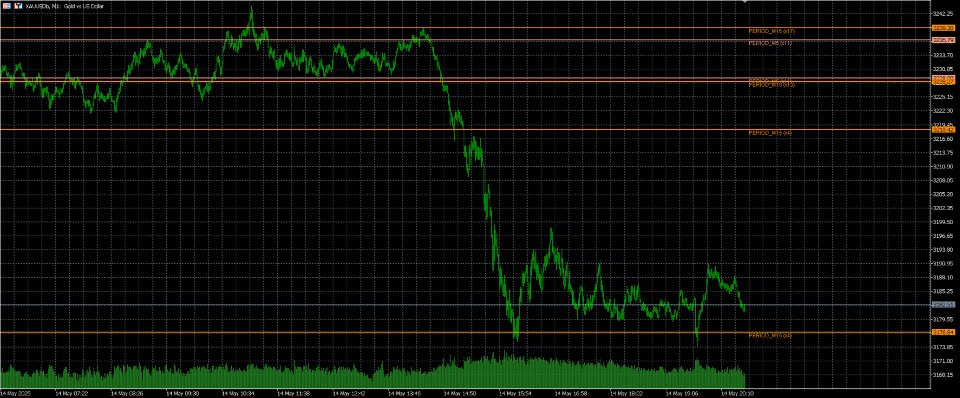
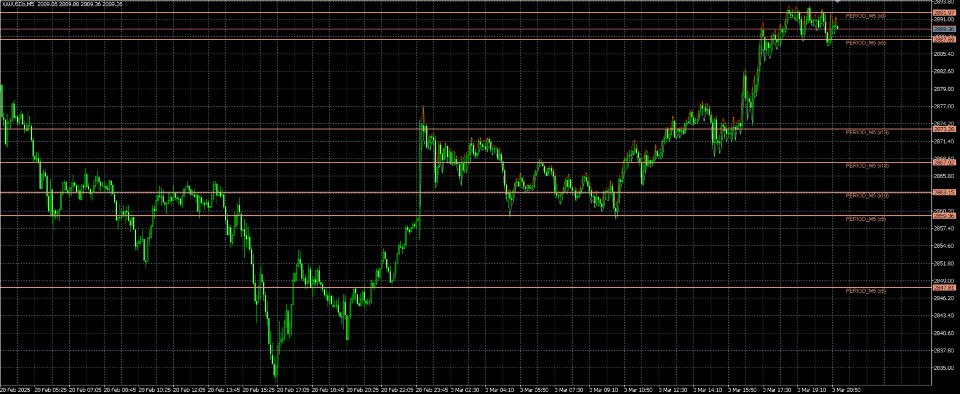
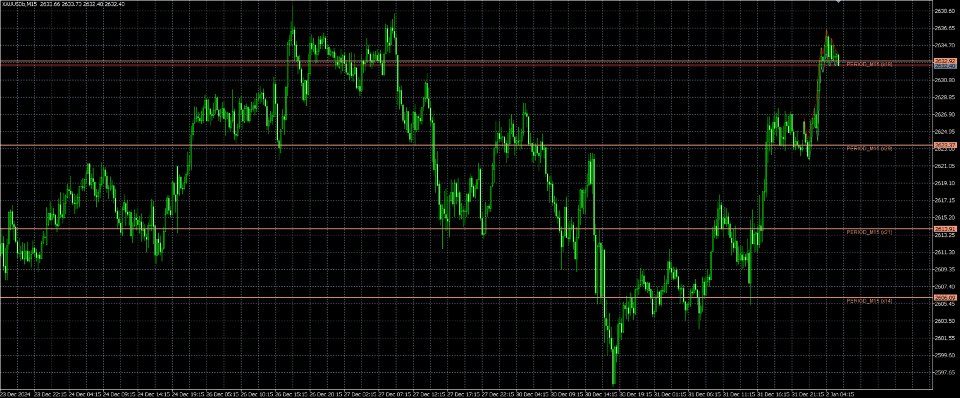
Single TF SR Pro is a technical analysis tool that automatically detects and displays key support and resistance levels on the chart based on local price extremums. The indicator is designed to work on a selected timeframe and shows only significant levels that appear repeatedly.
📌 Key Features
-
Extremum-based level detection — the indicator identifies local highs and lows in historical price data, which are then grouped into common levels if they are close to each other.
-
Automatic clustering — nearby levels are merged into stronger zones, helping to avoid chart clutter and highlighting only the most important areas.
-
Significance filtering — only levels that have been confirmed multiple times on the chart are displayed, improving accuracy and reducing noise.
-
Flexible visualization settings — customize the color, style, and width of the lines, and optionally display labels showing the timeframe and "strength" of the level (number of confirmations).
-
Automatic redrawing — levels are recalculated and updated automatically when the chart is refreshed or when the number of candles changes, keeping them up to date.
⏱ Timeframe Management
The indicator analyzes data from the selected timeframe — regardless of the chart's own timeframe. This allows you, for example, to view important levels from an hourly or daily timeframe while working on a minute chart.
You can add multiple copies of the indicator to the same chart, each working with a different timeframe. This way, you can build support and resistance levels from multiple timeframes — such as M5, H1, and D1 — to gain a more complete market view.
✅ Recommended Parameters
To help you get started quickly, here are suggested settings for the most common timeframes. These values can be adjusted depending on the market instrument and your trading style.
This values tested on XAU/USD
| Timeframe | Lookback Bars | Extremum Step | Min Strength to Draw | Cluster Threshold |
|---|---|---|---|---|
M1 | 600 | 2 | 7 | 0.05% |
M5 | 300 | 2 | 5 | 0.1% |
M15 | 300 | 2 | 5 | 0.15% |
M30 | 300 | 2 | 4 | 0.2% |
H1 | 300 | 3 | 6 | 0.25% |
D1 | 120 | 2 | 2 | 0.3% |
💬 Feedback Welcome
The indicator is under ongoing development. If you have suggestions for improvement — such as zone drawing, multi-timeframe support within a single copy, additional filters, or visual enhancements — feel free to share your ideas. All feedback is carefully considered for future updates.
