Press review - page 583
You are missing trading opportunities:
- Free trading apps
- Over 8,000 signals for copying
- Economic news for exploring financial markets
Registration
Log in
You agree to website policy and terms of use
If you do not have an account, please register
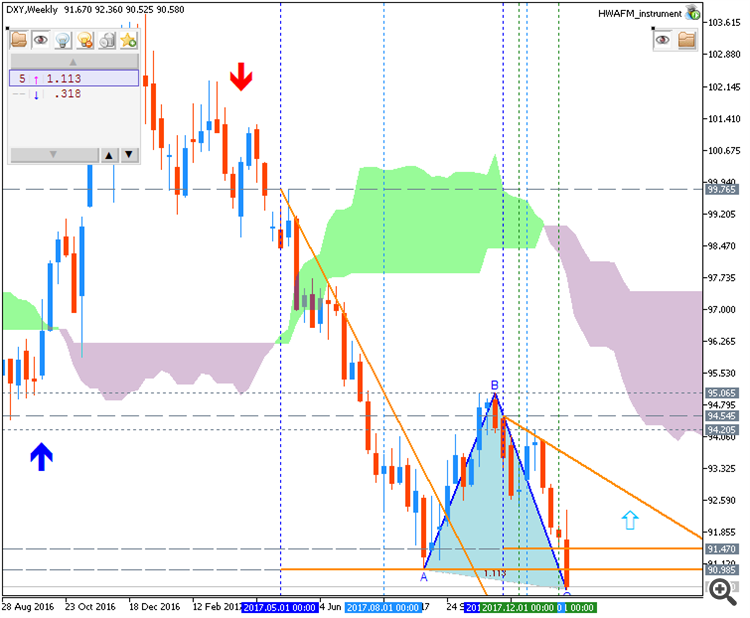
Weekly Outlook: 2018, January 14 - January 21 (based on the article)
The dollar suffered across the board in the second week of 2018. Will it remain under pressure? The upcoming week features housing data and consumer confidence from the US, Chinese GDP, and other market-moving events. Here are the highlights for the upcoming week.
============
The chart was made on Metatrader 5 using HWAFM tool pattern tool from this post.
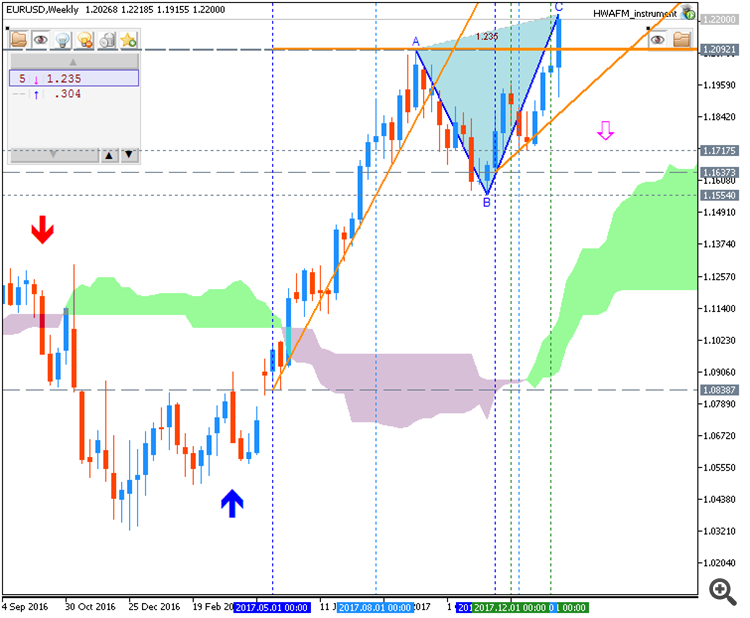
Weekly EUR/USD Outlook: 2018, January 14 - January 21 (based on the article)
EUR/USD had an excellent week that saw more volatility than the prior week with the pair hitting the highest levels in over three years. Is there more to come? Final inflation figures stand out in the week before the ECB decision. Here is an outlook for the highlights of this week.
============
The chart was made on Metatrader 5 using HWAFM tool pattern tool from this post.
Bitcoin Weekly Trading Outlook (based on the article)
Daily BTC/USD price is located above Ichimoku cloud in the bullish area of the chart: the price is on ranging within 16,897 resistance and 12,796 support levels for the bullish trend to be continuing or to the bearish reversal to be started.
============
Chart was made on MT5 with BrainTrading system (MT5) from this thread (free to download) as well as the following indicators from CodeBase:
All about BrainTrading system for MT5:
Ethereum Weekly Trading Outlook (based on the article)
Daily price is located above Ichimoku cloud in the bullish area of the chart: the price is on testing with resistance level at 1,380 to above for the bullish trend to be continuing, otherwise - ranging bullish.
By the way, the bearish reversal support level is 713 so if the price breaks this level to below - the daily bearish reversal will be started.
============
Chart was made on MT5 with BrainTrading system (MT5) from this thread (free to download) as well as the following indicators from CodeBase:
All about BrainTrading system for MT5:
Ripple Weekly Trading Outlook (based on the article)
Daily price is above Ichimoku cloud in the bullish area of the chart: the price is testing 1.536 support level together with descending triangle pattern to below for the possible daily bearish reversal to be started, otherwise - ranging bullish trend nearrrr bearish reversal levels.
============
Chart was made on MT5 with BrainTrading system (MT5) from this thread (free to download) as well as the following indicators from CodeBase:
All about BrainTrading system for MT5:
Bovespa Index - strong bullish trend; 79,880 is the key (based on the article)
The price on the H1 chart is above 100 SMA/200 SMA rebersal levels - the price is located in the bullish area of the chart for resistance level at 79,880 together with symmetric triangle pattern to be testing to above for the strong bullish trend to be continuing...
==========
The chart was made on H1 timeframe with standard indicators of Metatrader 4 except the following indicators (free to download):
USD/JPY - intra-day strong bearish trend; 110.32 support is the key (based on the article)
Intra-day price on H4 chart is far below 100-SMA/200-SMA bearish/bullish reversal levels: the price is on bearish market condition for 110.32 support level to be testing for the primary bearish trend to be continuing.
The fundamental justification for these moves is clear enough. The greenback has been under general pressure thanks to increasing market certainty that other developed markets will see tighter monetary policy in due course, crowding a field which for much of last year belonged solely to the US Federal Reserve. The Eurozone is held to be the most obvious candidate as stronger economic data see bets rise that stimulus withdrawal will accelerate."
==========
The chart was made on H4 timeframe with standard indicators of Metatrader 4 except the following indicators (free to download):
Cryptocurrency News
Bitcoin Daily - breakdown with the bearish reversal; 12,355 is the key (based on the article)
Daily price is on breakdown with the possible bearish reversal: the price is breaking 12,355 support level to below for the breakdown to be continuing with the bearish reversal to be started.
----------------
The chart was made on D1 timeframe with Ichimoku market condition setup (MT5) from this post (free to download for indicators and template) as well as the following indicator from CodeBase:
Litecoin Daily - testing 193 support for the bearish reversal (based on the article)
Daily price is on possible breakdown which may be started if the price breaks 193 support level together with the descending triangle pattern to below. If yes so the bearish breakdown will be started with 174 nearest daily bearish target to re-enter.
----------------
The chart was made on D1 timeframe with Ichimoku market condition setup (MT5) from this post (free to download for indicators and template) as well as the following indicator from CodeBase: