
If big moves were spread evenly, one would come every 20 bars or so. They are not. Big Move Map colours every big move on the chart and measures the gaps between them, and the gaps tell a clear story.
Typical gap against average gap
| Market | A big move is | Typical gap | Average gap |
|---|---|---|---|
| US500 (D1) | 2.02% or more | 4 days | 19 days |
| EURUSD (M15) | 0.07% or more | 5 bars | 20 bars |
| Gold (H1) | 0.73% or more | 7 bars | 19 bars |
| USDJPY (H4) | 0.46% or more | 8 bars | 19 bars |
Half of the big days on US500 came within 4 days of the previous big day. The average is pulled up by long quiet stretches with none at all.
The record days on US500
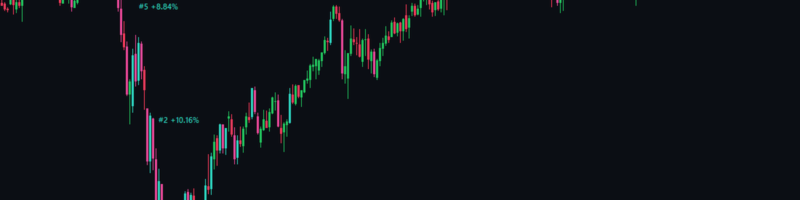
- -10.62% on 12 March 2020
- +10.16% on 24 March 2020
- +10.14% on 9 April 2025
Two of the three came within two weeks of each other, which is the same clustering again.
What counts as big
A candle's move is its close against the previous close. It is big when it is larger than 95% of all moves on that symbol and timeframe, so big on gold H1 (0.73%) is not the same as big on US500 D1 (2.02%). You can change the 95% from 80% to 99.5%.
On the chart
- Big rises redrawn in aqua, big falls in pink, so they stand out from the usual candles.
- The 10 record moves labelled with their rank, 1 to 10.
- A strip with big moves in each of the last 12 months.
- A panel with the bars since the last big move, the typical gap, this month against the usual, and the record.
Useful? A short review on its Market page helps other traders find it.
Big Move Map is free: https://www.mql5.com/en/market/product/204607. The figures describe past moves on that chart: a move can always be larger than any before it.