
This article is for informational and educational purposes only. It does not constitute financial advice or an investment recommendation. Trading in financial markets carries a high risk of loss.
Introduction
The ATR is one of the most widely used indicators for placing stops and sizing positions. It is also one of the most misunderstood. A very common mistake is to use the same value or the same settings on every asset, as if EURUSD, gold and the Nasdaq moved in the same way: a 20-pip stop can be wide on a quiet currency pair and far too tight on gold or an index.
This article is divided into three sections. The first explains what the ATR really measures, how to choose its period and how to read its value in MetaTrader 5. The second shows why each asset needs a different approach and how to adapt the ATR to it. The third covers how to use the ATR when managing a trade.
1. Understanding the ATR
What the ATR measures
The ATR (Average True Range) measures how much price moves, on average, in each candle. It was developed by J. Welles Wilder in 1978 and is based on a simple concept: the True Range. The True Range of a candle is the largest of these three values:
TR = max(High − Low, |High − Previous close|, |Low − Previous close|)
The last two terms capture opening gaps: if price opens far from the previous close, that jump also counts as movement.
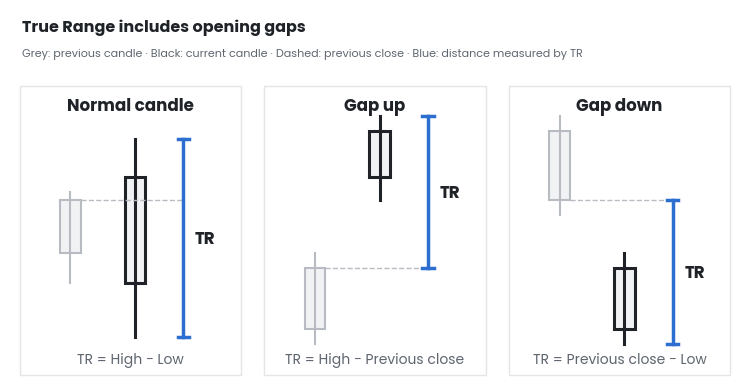
Figure 1. True Range: normal candle, gap up and gap down
When there is a gap, measuring only the candle's high and low would underestimate the real movement. The ATR is the average True Range of the last N candles. Three key ideas:
- It is expressed in the asset's price units. An ATR of 0.00080 on EURUSD and one of 4.50 on XAUUSD cannot be compared directly.
- It does not show direction. A high ATR can appear in a rally, in a sell-off or in a very choppy sideways market.
- It depends on the timeframe. The H1 ATR and the D1 ATR of the same asset measure different things: the average movement per hour and per day.
What the ATR does not do
- It does not predict. It measures how much price has moved in the recent past, not how much it will move.
- It does not give signals. A rising or falling ATR is not a buy or sell signal.
- It does not guarantee that a stop will hold. A stop based on the ATR is a more reasonable stop, not an infallible one. The market can change its behaviour at any time, especially around news or in low liquidity.
The ATR is a tool to adapt your decisions to the volatility of each asset, not a rule that works on its own.
How to choose the period
There is no correct period for everyone. Wilder's 14 is a reasonable middle ground, not a rule. The choice depends on what you want to measure and how you trade.
Short or long period
| Period | Advantage | Drawback |
|---|---|---|
| Short (5–10 candles) | Reacts quickly to changes in volatility | Irregular values; a single large candle distorts it |
| Medium (14–20 candles) | Balance between speed and stability | May lag slightly after a sudden change |
| Long (30–50 candles or more) | Stable, reliable values | Slow to adapt when the market speeds up or calms down |
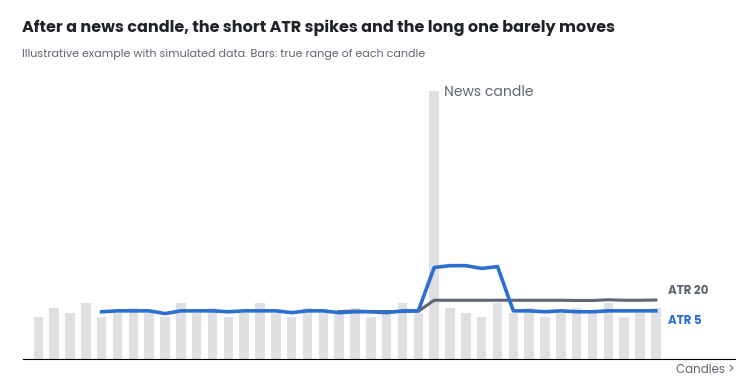
Figure 2. Short and long ATR periods after a news candle
With a short period, a single large candle makes the ATR jump and, a few candles later, drop sharply. With a long period, the same spike is barely noticeable.
Depending on the use
- Stops and take profit: the period should reflect volatility over the time you usually hold a trade. If your trades last a few hours, an ATR that only looks at the last few minutes falls short.
- Position size: a longer period is usually better, so the lot size does not change much from one trade to the next because of a single unusual candle.
- Volatility filter: comparing a short ATR with a long one shows whether the market is moving more or less than usual right now.
Depending on timeframe and session
On low timeframes, 14 candles cover very little time. On M5, that is about 70 minutes, which may fall entirely within the Asian session, much quieter for many currency pairs. If you then trade the London open, that ATR will underestimate the real movement. In these cases, it helps to use a longer period or to also check the ATR of a higher timeframe, such as H1 or D1.
Do not over-optimise
If a strategy only works with ATR 13 and stops working with 12 or 15, the problem is not the period: it is the strategy. A good setting gives similar results across a wide range of values. Always test several periods in the Strategy Tester or on a demo account before deciding.
Why the MT5 ATR does not match other platforms
People often compare the MetaTrader 5 ATR with TradingView's, using the same period, and see different values. It is not an error: they are calculated differently.
- MetaTrader 5: the standard ATR indicator calculates the simple average of the True Range over the last N candles. All candles carry the same weight.
- Wilder and TradingView: use a smoothed average, in which each new value is combined with the previous one:
ATR(today) = (ATR(yesterday) × (N − 1) + TR(today)) ÷ N
With the smoothed average, old candles do not disappear all at once and the value changes more gradually. With the simple average, a very large candle carries the same weight for N candles and then suddenly drops out of the calculation.
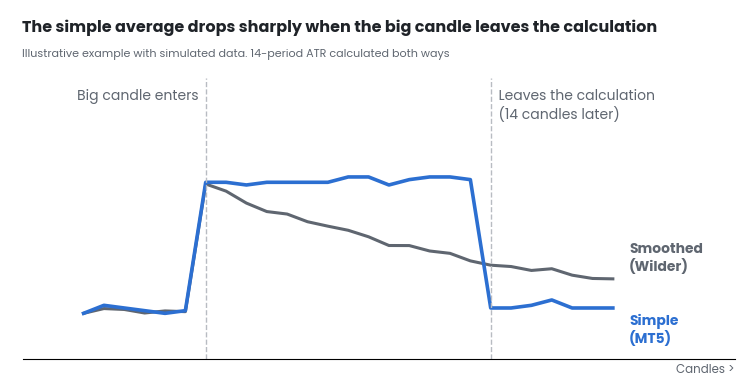
Figure 3. Simple ATR (MT5) versus smoothed ATR (Wilder)
There are other reasons for differences, even between two brokers on MT5:
- Price data: each broker has its own feed, with slightly different highs and lows.
- Server time: it defines where the daily candle starts and ends. Some brokers show a small Sunday candle that lowers the daily ATR.
The practical conclusion: use the ATR from the same platform and broker you trade with, and do not copy values from another source.
Pips, points and ticks: reading the ATR value in MT5
The MT5 ATR shows its value in price. To use it for a stop or a lot size calculation, you need to know how many pips or points it equals, and how much money that represents. Many mistakes happen here.
- Point: the smallest price change shown by the broker. On EURUSD with 5 decimals, it is 0.00001.
- Pip: on most currency pairs it is 0.0001, i.e. 10 points. On JPY pairs it is 0.01. Outside forex, the term has no single definition, so on gold, indices and crypto it is safer to work in points.
- Tick: the minimum movement with a monetary value. The tick size and its value per lot are shown in the symbol specification (Market Watch → right-click → Specification).
| Asset | Example ATR | Equals |
|---|---|---|
| EURUSD (5 decimals) | 0.00080 | 8 pips = 80 points |
| USDJPY (3 decimals) | 0.120 | 12 pips = 120 points |
| XAUUSD (2 decimals) | 4.50 | 450 points |
Illustrative values. Decimals, tick size and tick value vary by broker and account type. Always check your symbol's specification.
To know how much money a distance represents, use the tick size and tick value:
Risk per lot = (Stop distance ÷ Tick size) × Tick value
For example, if on EURUSD the tick size is 0.00001 and its value is 1 USD per lot, a stop of 0.00080 equals 80 ticks × 1 USD = 80 USD per lot. The same stop on another asset can mean a completely different amount, which is why lot size must always be calculated from the symbol specification.
2. Why each asset needs its own stop
Why each asset is different
Two assets with the same ATR on screen can behave very differently. These factors, among others, play a role:
- Price and scale: the ATR is in price units, so an asset trading at 4,000 will show much larger values than one trading at 1.08, even if their relative volatility is similar.
- Trading hours: forex trades 24 hours a day, five days a week; many indices have session hours with opening gaps; and cryptocurrencies trade every day.
- Liquidity and spread: in less liquid assets, or at low-volume hours, the spread eats a larger share of the movement.
- Sensitivity to news: some assets react much more strongly to economic data or specific events.
- Broker conditions: decimals, contract size, tick value, leverage and server time vary from one broker to another.
For all these reasons, there is no ATR setting that works for every asset. Each one must be analysed separately.
Normalising the ATR: ATR as a percentage of price
To compare the volatility of different assets, the ATR can be expressed as a percentage of price:
ATR% = (ATR ÷ Price) × 100
This removes the effect of scale. An ATR of 4.50 on gold looks huge compared with 0.00080 on EURUSD, but as a percentage, the difference is much smaller. On the other hand, assets such as indices or cryptocurrencies usually move considerably more in relative terms.

Figure 4. ATR as a percentage of price on five assets
ATR as a percentage is useful to compare assets and to see whether one is more or less agitated than another. To place the stop and calculate the lot size, you still use the ATR in price.
Multipliers by asset type
A common practice is to place the stop at a distance of X times the ATR. The problem is using the same multiplier everywhere. Assets with sharper moves, more gaps or more intraday noise usually need a wider margin so the stop is not hit by normal price movement. As a general reference, and always as a starting point for testing, not as a recommendation:
| Asset type | Typical behaviour | Usual stop margin |
|---|---|---|
| Major forex pairs | Continuous movement, few gaps except at the weekend | Tighter (for example, 1 to 2 ATR) |
| Metals (gold, silver) | Fast moves and strong reactions to news | Medium (for example, 1.5 to 2.5 ATR) |
| Indices | Gaps at the session open and spikes at the start | Medium to wide (for example, 1.5 to 3 ATR) |
| Cryptocurrencies | High volatility, trade every day, long wicks | Wider (for example, 2 to 3 ATR) |
Indicative ranges. They depend on the timeframe, strategy, broker and market conditions. Always check them with your own data in the Strategy Tester or on demo.
A wider stop is not "safer" in itself: with the same risk in money, it forces you to trade a smaller lot. What matters is that the stop sits outside the asset's normal noise and that the lot size is calculated from that distance, as the example below shows.
Gaps, sessions and news
The ATR captures all the movement in each candle, including movement that cannot be traded normally. Depending on the asset, this distorts it in different ways.
Opening gaps
On indices and stocks, the market closes every day or every weekend, and the next session can open far from the last close. That gap enters the True Range and raises the ATR, especially on low timeframes at the start of the session. In forex, gaps are usually limited to the weekend, and in crypto, which trades every day, they hardly exist. The practical consequence is that the same ATR period behaves differently depending on the asset. On an index, check whether the value is inflated by the open before using it.
Sessions
Volatility changes throughout the day. On many currency pairs, the Asian session is quieter than the London open or the New York overlap. An ATR calculated on candles from one session may not represent what happens in the next.
News
A major economic release can produce a candle several times larger than normal. With the MT5 simple average, that candle keeps the ATR high for the whole period and then drops out of the calculation all at once, as shown earlier in this article. During that time, stops calculated with the ATR come out larger than the market justifies after the news. Some ways to reduce this effect are to use a longer period, compare the ATR with its average over several weeks, or avoid calculating the stop right after a news release.
Spread versus ATR
The spread is a fixed cost you pay on entry, and the ATR is the average movement you expect. The larger the spread relative to the ATR, the harder it is for the trade to pay off. A simple way to measure it is to divide the spread by the ATR:
| Example | Spread | ATR | Spread / ATR |
|---|---|---|---|
| EURUSD on H1 | 0.00010 | 0.00080 | 12.5% |
| EURUSD on M5 | 0.00010 | 0.00025 | 40% |
Illustrative values. The spread varies by broker, account and time of day.
With the same spread, on M5 the cost represents a share of the movement three times larger than on H1. That is why a 1-ATR stop that looks reasonable on low timeframes can end up too close if the spread is not taken into account. The same happens on assets with wide spreads or at low-liquidity hours, such as the server's daily rollover.
Step-by-step example: EURUSD versus XAUUSD
Suppose a 10,000 USD account and a risk of 1% per trade, i.e. 100 USD. We want to trade EURUSD and XAUUSD on H1, risking the same amount on both.
| Step | EURUSD | XAUUSD |
|---|---|---|
| 1. H1 ATR | 0.00080 | 4.50 |
| 2. Chosen multiplier | 1.5 ATR | 2 ATR |
| 3. Stop distance | 0.00120 (120 points) | 9.00 (900 points) |
| 4. Tick size and tick value | 0.00001 · 1 USD per lot | 0.01 · 1 USD per lot |
| 5. Risk per lot | 120 × 1 = 120 USD | 900 × 1 = 900 USD |
| 6. Lot = 100 USD ÷ risk per lot | 0.833 → 0.83 lots | 0.111 → 0.11 lots |
Illustrative example. Tick value, contract size and lot step vary by broker. The calculation does not include spread or commission.
In both cases, the risk is about 100 USD, but the stop and the lot size are very different. The lot is always rounded down so as not to exceed the planned risk.
Now look at the common mistake: using on gold the same 120-point stop as on EURUSD. On XAUUSD, 120 points is 1.20 in price, barely 27% of its ATR. Such a stop would sit inside the normal movement of a single candle and would most likely be hit by simple noise. Before trading, always check the lot size in your broker's order window.
3. Using the ATR to manage a trade
ATR trailing stop
A trailing stop follows price when the trade moves in your favour. If it moves at a fixed distance in pips, in quiet periods it ends up too far away and in volatile periods too close. With the ATR, the distance adapts to volatility. The best-known version is the chandelier stop. On a long trade, the stop is placed a number of ATRs below the highest high reached since entry (another common variant uses the highest high of the last N candles):
Stop = Highest high − k × ATR
On a short trade it is the other way round: the lowest low plus k times the ATR. The key rule is that the stop only moves in your favour: if the ATR rises or price pulls back, the stop stays where it was.
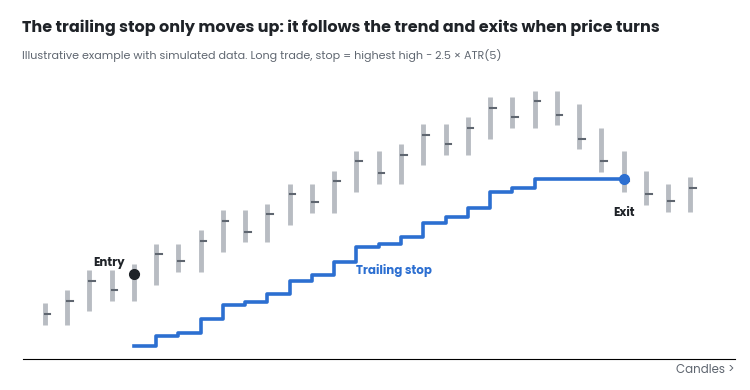
Figure 5. ATR trailing stop (chandelier stop) on a long trade
How to choose k:
- A low k (for example, 1.5 or 2) locks in profit sooner, but price hits it more easily on normal pullbacks.
- A high k (for example, 3 or more) gives the trend more room, but gives back a larger part of the profit when price turns.
Neither value is better than the other: it depends on the asset, the timeframe and whether you are looking for short moves or long trends. As always, it is worth testing several values before deciding.
How much of the day's range has been used
The daily ATR shows how much price moves on a normal day. Comparing it with the current day's range gives an estimate of how much movement the market has already used:
Day's range used (%) = (Day's high − Day's low) ÷ Daily ATR × 100
For example, if the daily ATR of EURUSD is 0.00700 and today the price has already moved 0.00630 between high and low, the day has used 90% of its ATR. (Illustrative values.) What it is useful for:
- Judging whether a take profit is realistic. If the day has already used 90% of its ATR, a target that requires another large move in the same session is less likely.
- Avoiding late entries. Entering when the day has already made most of its usual move tends to leave little room and more risk of a reversal.
- Spotting exceptional days. If the range used is well above 100%, the day is more volatile than normal, usually because of news.
This is not a limit: price can exceed its daily ATR, and some days it does so by a wide margin. It is a statistical reference for making better-informed decisions, not a forecast. Use your broker's daily ATR, because the time at which the daily candle starts and ends varies from one broker to another.
Is current volatility high or low?
An ATR of 0.00080 says nothing on its own: it can be a lot for one asset and little for another, or a lot today and little a month ago. To know, you need to compare it with the asset's own history. The simplest way is to divide the current ATR by its average over a long period, for example, the last 100 candles:
Volatility ratio = Current ATR ÷ Average ATR (100 candles)
| Ratio | Reading |
|---|---|
| Above 1.3 | High volatility compared with usual |
| Between 0.7 and 1.3 | Normal volatility |
| Below 0.7 | Low volatility compared with usual |
Indicative thresholds. Each trader can adjust them to the asset and timeframe.
A more robust alternative is the percentile: where the current ATR sits among all values of the last few months. An ATR in the 90th percentile is among the highest 10% of the period.
How it can be used:
- Adjusting risk. Some traders reduce risk per trade when volatility is high, because sharp moves are more frequent.
- Filtering strategies. A breakout strategy may perform worse in very low volatility, and a range strategy worse in very high volatility.
- Interpreting stops. With high volatility, ATR-based stops come out wider and the lot size smaller. That is expected behaviour, not an error.
Remember that low volatility can turn into high volatility very quickly, especially before major news.
Common mistakes when managing a trade with the ATR
- Moving the stop further away when the ATR rises. A trailing stop should only move in your favour. Widening it because the market has become agitated increases the risk beyond what was planned.
- Recalculating the lot size with the trade open. The lot is decided at entry, from the initial stop distance. Changing it later breaks risk control.
- Using an ATR from a different timeframe than the one you manage on. A trailing stop based on the M5 ATR in a trade planned on H4 will be hit by normal market movement.
- Treating the daily ATR as a ceiling. Price can exceed its average range, and on news days it often does.
- Forgetting spread and gaps. A very tight stop can be hit by a widening spread or an opening gap, even if the analysis was correct.
Conclusions
- Measuring volatility: the ATR measures past volatility in price units. It does not predict or show direction. Its period must be chosen according to its use, and the MT5 value (a simple average) differs from Wilder's smoothed version and from other platforms, so always use your broker's data.
- Every asset is different: each asset has its own scale, trading hours, liquidity, spread and sensitivity to news. Use the ATR as a percentage of price to compare assets, adapt the stop multiplier to each type and calculate the lot size from the stop distance, so you risk the same amount on any asset.
- Managing the trade: the ATR helps to set a trailing stop that adapts to volatility, to judge how much room the day has left and to tell whether current volatility is high or low.
The ATR does not predict the market or eliminate risk. It is a tool for making decisions that are more consistent with how each asset moves. Like any indicator, it works best when it is well understood, tested with your own data on demo or in the Strategy Tester, and combined with disciplined risk management.
References
- J. Welles Wilder Jr., New Concepts in Technical Trading Systems, 1978.
- MQL5 Reference: iATR and the Average True Range indicator (MetaTrader 5 documentation).
Disclaimer
This content is for informational and educational purposes only. It does not constitute financial advice or a recommendation to buy or sell any instrument. The ATR measures past price behaviour and is not a forecast. Every asset and every broker is different, and the values, multipliers, thresholds and examples shown are for illustration only. Trading forex, CFDs and other leveraged products carries a high risk of loss. Every trading decision, and its outcome, is the sole responsibility of the reader. The author accepts no liability for any loss arising from the use of this information.