VolBand Pro User Manual – Next-Hour Range Forecast with Calibrated Bands for MetaTrader 5

1. What VolBand Pro answers
Most volatility tools answer "how much did the market move?". VolBand Pro answers the question that matters before an entry: how far is the market likely to move over the next hour, and how sure is that estimate?
It does not forecast direction and does not give buy or sell signals. It forecasts the high-low range of the next horizon:
| Timeframe | Horizon | Covers |
|---|---|---|
| M15 | 4 bars | next hour |
| M30 | 2 bars | next hour |
| H1 | 4 bars | next 4 hours |
The horizon is set automatically from the chart timeframe.

GBPUSD H1: expected range for the next 4 hours with 80% and 95% bands. Grey bars = realized range.
2. Reading the chart
VolBand Pro draws in a separate window, in price units:
- Expected range (median line): the typical high-low distance for the coming horizon.
- 80% band: in 4 cases out of 5 the realized range is expected to fall inside it.
- 95% band: in 19 cases out of 20 the realized range is expected to fall inside it.
- Realized range: the range that actually happened, drawn so you can compare the forecast with the result.
- Suggested stop: a stop distance derived from the forecast.
The forecast bands are shifted forward by the horizon, so each forecast sits over the bars it refers to. Every value is computed at bar close and never repainted.
The information box shows the same numbers for the current forecast: next-hour range, bands and stop, in pips.
3. Why the bands change with the time of day
ATR looks back at the last 14 bars and projects them forward. Just before London or New York opens, the last bars were quiet, so ATR is too small exactly when volatility is about to rise. After the open it stays too large while the market calms down.
VolBand Pro models each currency pair in each intraday slot:
- Time of day: how this pair usually behaves in this slot.
- Recent activity: today's and this week's volatility, compared with normal.
- Self-calibration: the bands are adjusted continuously on the indicator's own recent errors (adaptive conformal prediction). If the forecast starts missing too often, the bands widen; if they are too wide, they tighten.

EURUSD M15, 27 October: the bands are narrow during the Asian session and widen from 08:00, ahead of the London move. Grey bars = realized range.
4. How it was validated
The protocol and hypotheses were written and frozen before the test data were opened.
- Test set: 18 forex pairs, January 2024 – October 2026, about 17,500 forecasts per pair, never used to build or tune the model.
- Calibration: on M15 the 80% band contained the realized range 79.5–80.4% of the time and the 95% band 94.8–95.3%, on 18 of 18 pairs. M30 and H1 were also within tolerance on 18 of 18 pairs.
- Accuracy (interval score, lower is better, all methods with identical calibration):
- vs. ATR: better on 18/18 pairs, error 16–36% lower on M15.
- vs. a time-of-day seasonal model: better on 18/18 pairs, median error reduction 8.7% (M15), 9.2% (M30), 4.6% (H1).
- Stop test: with random entries and the same average stop size, the VolBand stop-out rate stayed closer to its target across hours of the day and across quiet/volatile days than ATR and seasonal stops, on 18 of 18 pairs.
- MT5 implementation: compared bar by bar with the research code on more than 570,000 forecasts. Maximum difference: 3e-11.
What the test did not show is just as important: the VolBand stop does not reduce drawdown compared with an ATR stop. On days when volatility jumps abruptly, ATR reacts faster. The advantage of VolBand Pro is the time-of-day structure and the calibration.
5. Practical uses
Stop placement. Use the suggested stop, or place your technical stop and compare it with the bands. A stop inside the 80% band will often be touched by normal noise within the horizon.
Position sizing. Keep the money risk constant: when the expected range is wider, the stop is wider and the lot is smaller.
Target reality check. If your target is beyond the 95% band, you are asking for a move that happens less than 1 time in 20 within the horizon. It may still happen, but over a longer holding period.
Cost check. When the expected range is only a few pips, spread and commission take a large share of it. Quiet slots are often the most expensive ones to trade.
Context. A realized range above the 95% band signals unusual activity: news, jumps, liquidity gaps.
6. Settings
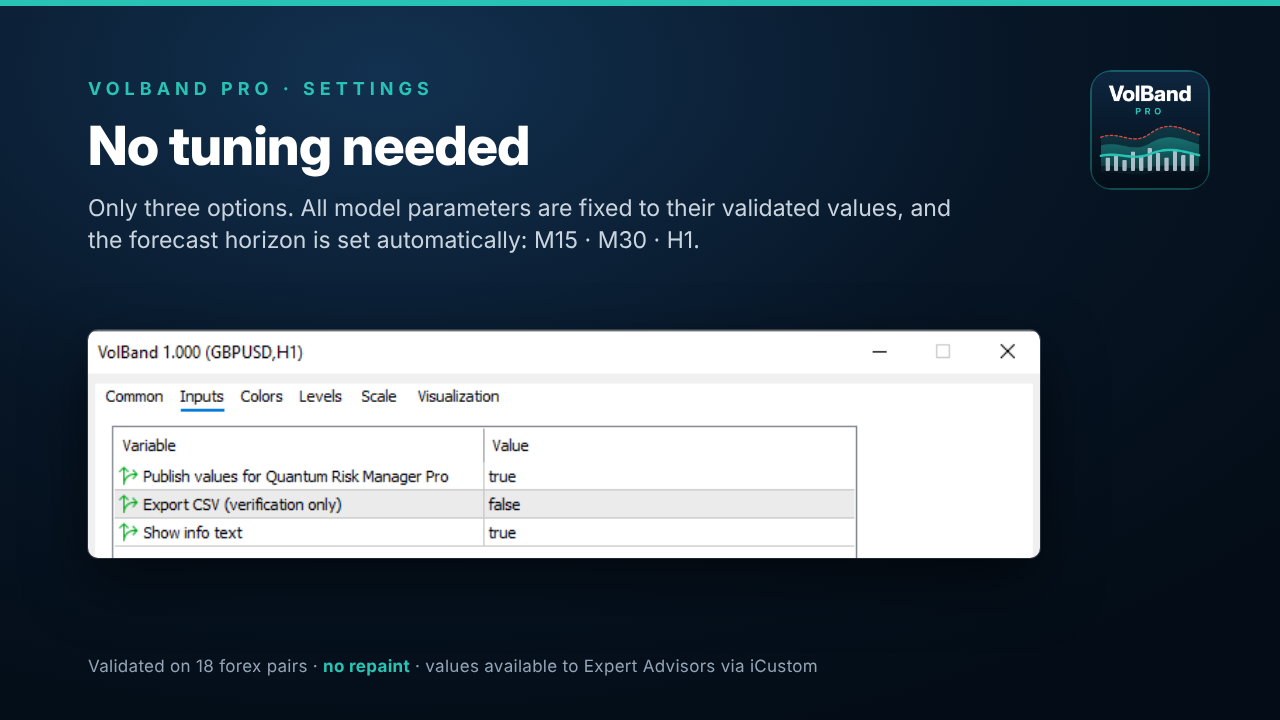
The model parameters are fixed to the validated values. The input window has only three options:
| Input | Default | Purpose |
|---|---|---|
| Publish values for QRM / EAs | true | publishes the forecast as terminal global variables |
| Export CSV | false | writes the forecasts to a file (for your own analysis only) |
| Show info label | true | shows the information box |
Warm-up: the model needs about 250 trading days of history before the first forecast. If the chart shows "warm-up", scroll back or let the terminal download more history.
Supported timeframes: validated on M15, M30 and H1 for forex pairs. On other symbols the indicator works but marks the output as "not validated". On D1 and above it shows "timeframe not supported".
7. Using VolBand Pro with Quantum Risk Manager Pro
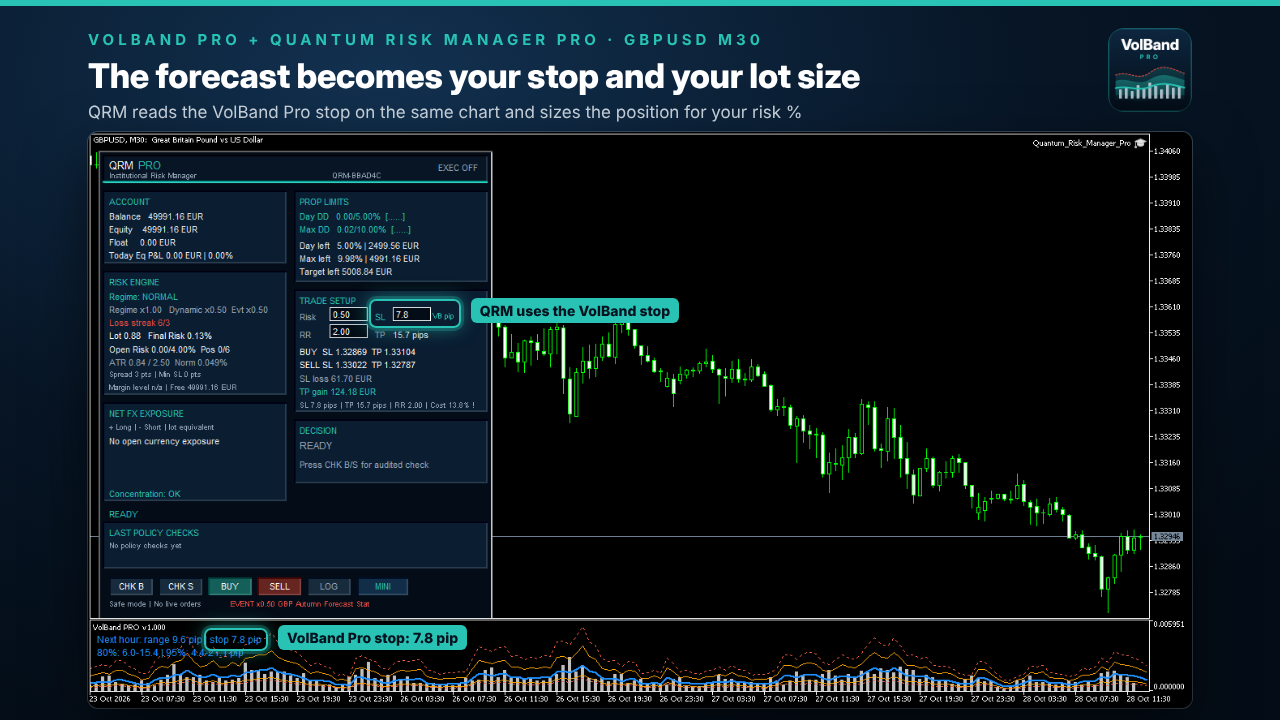
From version 1.002, Quantum Risk Manager Pro can take its stop distance directly from VolBand Pro:
- Attach VolBand Pro and QRM Pro to the same chart (M15, M30 or H1).
- In QRM, group 5 "Companion indicators", set Use VolBand PRO stop loss = YES.
- The SL field in the panel turns read-only and shows VB pips. QRM sizes the lot on the VolBand stop and runs all its usual checks.
If VolBand Pro is removed, the timeframe is not validated or the forecast is not up to date, QRM automatically returns to your manual stop, and the SL label turns red. The audit file records the stop source of every decision ( sl_src=VOLBAND or sl_src=MANUAL_FALLBACK ).
8. For EA developers
All values are available through iCustom / CopyBuffer , in price units. Read shift 1 (the last closed bar).
| Buffer | Content |
|---|---|
| 0 | Realized range of the last horizon |
| 1 | 95% upper band |
| 2 | 80% upper band |
| 3 | Expected range (median) |
| 4 | 80% lower band |
| 5 | 95% lower band |
| 6 | Suggested stop distance |
int h = iCustom(_Symbol, _Period, "Market\\VolBand Pro Volatility Forecast Bands");
double stop[];
if(CopyBuffer(h, 6, 1, 1, stop) == 1 && stop[0] > 0)
   Print("VolBand stop: ", DoubleToString(stop[0] / _Point, 0), " points");
9. Limitations
- Range forecast, not direction. No trading signals.
- Validated on forex pairs, M15/M30/H1 only.
- About 250 trading days of history needed before the first forecast.
- Abrupt volatility shifts: ATR adapts faster.
- No drawdown reduction compared with an ATR stop was found in testing.
Trading involves risk. Results on historical data do not guarantee future results. VolBand Pro is a decision-support tool, not financial advice.