Best Indicators for Scalping: Top Forex Indicators and Strategies for 1-Minute and 5-Minute Charts

Best Indicators for Scalping:
Top Forex Indicators and Strategies for 1-Minute and 5-Minute Charts
Scalping is one of the fastest-paced trading styles in the Forex market. Traders aim to capture small price movements within minutes, which means every entry, exit, and spread can significantly affect the final result. Choosing the best indicators for scalping is therefore essential, but adding more tools to your chart does not automatically improve your trading performance.
Successful scalpers use technical indicators to identify market direction, confirm momentum, measure volatility, and filter out low-quality setups. In this guide, we will explore the most useful Forex scalping indicators, explain practical settings for 1-minute and 5-minute charts, and show how to combine them into a structured trading strategy.
What Are the Best Indicators for Scalping?
The best scalping indicators are those that help traders make fast, informed decisions without overwhelming their charts. Moving averages, RSI, Bollinger Bands, and the Stochastic Oscillator are popular choices because each provides a different perspective on price action.
Rather than relying on a single indicator, traders can combine two or three complementary tools to confirm potential entries.
1. Exponential Moving Average (EMA)
The Exponential Moving Average is one of the most widely used indicators for scalping. Unlike a simple moving average, the EMA gives greater weight to recent prices, making it more responsive to short-term market movements.
A common setup uses the 9 EMA and 21 EMA to identify momentum and short-term trend direction.
How to use EMA for scalping:
-
Look for potential buying opportunities when the 9 EMA moves above the 21 EMA.
-
Look for potential selling opportunities when the 9 EMA moves below the 21 EMA.
-
Consider pullbacks toward the EMA as possible entry areas when the broader trend remains intact.
-
Avoid relying on crossover signals alone during sideways markets.
On a 1-minute chart, EMA crossovers can generate frequent signals, including false entries. Confirming the direction with the 5-minute chart can help traders avoid some unnecessary trades.
2. Relative Strength Index (RSI)
The Relative Strength Index measures the strength of recent price movements on a scale from 0 to 100. It is commonly used to identify momentum, potential exhaustion, and divergence between price and the indicator.
The standard RSI setting is 14 periods, although some scalpers experiment with shorter periods to make it more responsive.
RSI settings and signals:
-
Above 70: Potentially overbought conditions.
-
Below 30: Potentially oversold conditions.
-
Above 50: Often used as a bullish momentum filter.
-
Below 50: Often used as a bearish momentum filter.
Overbought does not automatically mean that price will fall, and oversold does not guarantee a rebound. In a strong trend, RSI can remain near extreme levels for an extended period.
For Forex scalping, RSI is often more useful when combined with trend analysis or support and resistance levels.
3. Bollinger Bands
Bollinger Bands help traders understand volatility and identify areas where price is trading relative to its recent average. The indicator consists of a moving average and two outer bands that expand or contract as volatility changes.
A common configuration is 20 periods with a standard deviation of 2.
How to use Bollinger Bands for scalping:
-
Watch for band contraction as a sign that volatility has decreased.
-
Monitor potential breakouts when price moves beyond a narrow range.
-
In ranging markets, look for possible reversals near the outer bands after price-action confirmation.
-
In strong trends, recognize that price can continue moving along an outer band.
A touch of the upper or lower band is not a guaranteed reversal signal. Traders should first determine whether the market is trending or ranging.
4. Stochastic Oscillator
The Stochastic Oscillator compares the latest closing price with its recent trading range. It is particularly useful for evaluating short-term momentum and potential turning points.
Common settings are 14, 3, and 3, although shorter configurations may be used for faster strategies.
The indicator typically highlights overbought conditions above 80 and oversold conditions below 20.
For example, a bullish crossover below 20 may suggest that upward momentum is developing. A bearish crossover above 80 may indicate weakening upward momentum.
However, strong trends can keep the Stochastic Oscillator in an extreme zone. For this reason, traders should combine its signals with market structure and trend direction rather than entering every crossover.
Best Indicators for 1-Minute and 5-Minute Scalping
The best indicators for a 1-minute chart are not always the best choices for a 5-minute chart. Lower timeframes contain more market noise, while slightly higher timeframes can provide a clearer view of short-term structure.
Best Indicators for 1-Minute Scalping
The 1-minute chart is designed for precise entries, but it can produce many false signals. A practical setup may include:
-
9 EMA: Helps identify immediate momentum.
-
21 EMA: Provides a broader short-term trend reference.
-
RSI (14): Helps evaluate momentum and potential divergence.
-
Bollinger Bands (20, 2): Provides context about volatility.
Avoid adding all these indicators simply because they are available. Choose the tools that support your specific trading rules.
Spread, commissions, execution speed, and slippage are especially important on the 1-minute chart because trading costs can consume a large portion of small potential profits.
Best Indicators for 5-Minute Scalping
The 5-minute chart can help traders filter market direction before searching for entries.
A combination of the 9 EMA, 21 EMA, and RSI can provide a simple framework for trend and momentum analysis. Bollinger Bands can be added when volatility conditions are relevant to the strategy.
One practical approach is to use the 5-minute chart to identify the dominant short-term direction and the 1-minute chart to refine entry timing. This multi-timeframe method can reduce impulsive trades, although it cannot eliminate false signals.
How to Combine Scalping Indicators Into a Trading Strategy
A useful scalping strategy should define market conditions, entry confirmation, stop-loss placement, and profit targets before a trade is opened.
Consider a simple EMA and RSI setup.
Step 1: Identify the Trend
Check whether the 9 EMA is above or below the 21 EMA. Look for buying opportunities when the short-term direction is bullish and selling opportunities when it is bearish.
Step 2: Confirm Momentum
Use RSI to assess whether momentum supports the potential trade. For example, an RSI reading above 50 may support a bullish bias, while a reading below 50 may support a bearish bias.
Step 3: Wait for a Suitable Entry
Avoid chasing a candle that has already made a large move. Instead, wait for a pullback, a clear price-action signal, or a break and retest of a relevant level.
Step 4: Define Risk Before Entry
Place the stop loss at a level that invalidates the trade idea. Set the target according to market structure and your planned risk-to-reward ratio.
A strategy targeting a 1:2 risk-to-reward ratio aims to make twice the amount risked if the target is reached. This does not guarantee profitability; the win rate, execution costs, and consistency of the trading method still matter.
Common Scalping Mistakes to Avoid
Even the best Forex scalping indicators cannot compensate for poor execution or weak risk management.
Using too many indicators: Multiple tools may provide conflicting signals and delay decisions. Keep your chart focused on a small number of complementary indicators.
Ignoring transaction costs: A strategy that appears profitable before spreads and commissions may perform poorly in live trading.
Trading every signal: Not every crossover or overbought reading creates a valid opportunity. Wait for conditions that match your plan.
Ignoring market conditions: A trend-following setup may struggle in a sideways market, while a reversal strategy may fail during strong directional moves.
Risking too much per trade: Frequent trading can magnify losses when position sizing is too aggressive. Define your risk limits and daily loss threshold in advance.
Before trading a new setup live, backtest it and evaluate its performance under realistic costs. Then use a demo account to assess execution and consistency.
Conclusion: Which Scalping Indicators Actually Work?
The best indicators for scalping are the ones that support a clear, repeatable trading process. EMA helps identify short-term direction, RSI measures momentum, Bollinger Bands provide volatility context, and the Stochastic Oscillator can help assess potential turning points.
For 1-minute scalping, prioritize fast decision-making, clean charts, and realistic execution costs. For 5-minute scalping, use the additional market context to filter entries and avoid trading against the broader short-term direction.
No indicator works in every market condition. Consistent results depend on combining technical analysis with disciplined execution, suitable position sizing, and effective risk management.

Introducing TW Multi Divergence MT4
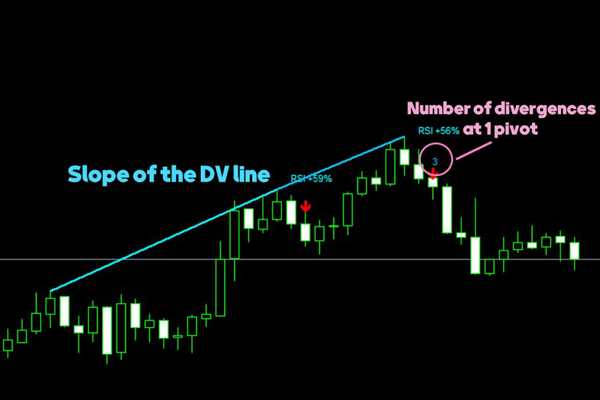
For traders who want to analyze momentum and potential reversal signals, TW Multi Divergence MT4 combines six technical oscillators in one indicator: RSI, CCI, MACD, OBV, Stochastic, and Awesome Oscillator (AO).
The indicator identifies bullish and bearish divergences, displays oscillator-specific signals, and helps traders spot areas where multiple indicators show divergence simultaneously. It also supports multi-timeframe and multi-currency analysis, with adjustable display filters to keep charts organized.
TW Multi Divergence MT4 can be used as a confirmation tool alongside price action, support and resistance, and an existing scalping strategy. Test it under your trading conditions before using it on a live account, and remember that divergence signals do not guarantee reversals or profitable trades.