
SuperTrend Sentinel Levels: A Five-Gate Confluence SuperTrend Indicator With ATR-Based TP/SL for MT4 and MT5

Introduction
The SuperTrend indicator has been a staple of trend-following retail trading for over a decade. Its appeal is obvious -- one number drawn on a chart that flips from green to red and back again, marking the prevailing trend direction without ambiguity. The mechanics are straightforward: an ATR-based band sits above or below price, ratcheting in one direction until a close on the opposite side flips the state. For traders who want a single trend filter, it is hard to beat the simplicity.
The simplicity is also the problem. A classic SuperTrend fires on every flip, including those that occur during sideways consolidation, against the higher-timeframe trend, on bars where momentum is exhausted, and on weak-volume sessions where no real participation is taking place. Most of these flips never produce a meaningful follow-through. The result is the familiar pattern that drives traders to abandon the indicator after a month -- chops in ranges, late entries at trend exhaustion, whipsaws against the higher timeframe.
SuperTrend Sentinel Levels rebuilds the indicator around a five-gate confluence filter that evaluates every raw trend flip against five independent market-context conditions before promoting the signal to alert-worthy. The five gates -- EMA(100) bias, RSI extreme filter, ADX trending, volume above average, and higher-timeframe SuperTrend agreement -- each capture a different aspect of whether the current bar represents a genuine trend shift or a market-structure failure. A configurable filter mode (Loose, Balanced, or Strict) controls how many gates must pass, and a 18-row confirmation dashboard shows the live state of every gate so the trader can read the quality of the current signal at a glance.
Around this confluence engine, every signal automatically draws a five-line risk architecture (Entry, Stop Loss, TP1, TP2, TP3), a VWAP horizontal line with daily session reset, a Fibonacci golden zone retracement, and an 11-channel alert package that routes signals through popup, sound, email, and mobile push notifications. The indicator is available for both MetaTrader 4 and MetaTrader 5 with identical signal logic and visual identity across both platforms.
This article walks through the technical foundation of each component -- the SuperTrend trend state machine, the five confluence gates, the non-repaint guarantee, the ATR-anchored risk architecture, the dashboard and alert systems -- and provides a complete parameter reference. The intent is to give traders the conceptual grounding to configure SuperTrend Sentinel Levels for their own markets and timeframes.
Download the indicator:
- MetaTrader 5: SuperTrend Sentinel Levels MT5
- MetaTrader 4: SuperTrend Sentinel Levels MT4
The SuperTrend Trend State Machine
At the core of the indicator is a classic SuperTrend trend state machine, identical to the canonical Pine v6 implementation. Two trailing lines are maintained on every bar -- a bullish trail and a bearish trail -- and the trend state alternates between +1 (bullish) and -1 (bearish) depending on which trail the close crosses.
On each closed bar, the indicator computes:
hl2 = (High + Low) / 2 atr = Wilder ATR(atrPeriod) // default period = 10 up = hl2 - factor * atr // default factor = 3.0 dn = hl2 + factor * atr
up is the candidate bullish trail value for the current bar, dn is the bearish counterpart. The trailing lines do not simply equal up and dn -- they ratchet:
trendUp[i] = (close[i-1] > trendUp[i-1]) ? max(up, trendUp[i-1]) : up
trendDown[i] = (close[i-1] < trendDown[i-1]) ? min(dn, trendDown[i-1]) : dn
The bullish trail moves only upward (during a bullish trend) or resets when price breaks below it. The bearish trail mirrors this behavior on the short side. The result is a "ratcheting stop" that follows the trend without retreating, similar in spirit to a Chandelier exit.
The trend state then flips on a close crossover:
trend[i] = (close[i] > trendDown[i-1]) ? +1 : (close[i] < trendUp[i-1]) ? -1 : trend[i-1]
The visible SuperTrend line is trendUp when the trend state is +1, and trendDown when -1. The line is colored green during bullish trends and red during bearish trends. A buffer zone is drawn as dotted lines buffer% above and below the SuperTrend line. When the trend flips, both the bullish and bearish line buffers are written on the transition bar to maintain visual continuity -- without this, the chart would show a gap at every flip.
The factor parameter is the most important tuning knob. A higher factor produces wider bands and fewer flips (better for swing trading on H1 and above). A lower factor produces tighter bands and more flips (better for scalping on M5 and M15). The default of 3.0 with ATR period 10 is a balanced configuration suitable for H1 trend-following on most Forex pairs.
Why a Single Trend Filter Is Not Enough
The SuperTrend state machine is excellent at marking trend direction once a trend is established. It is poor at deciding whether the current flip represents the start of a new trend or a temporary excursion during consolidation. Every classic SuperTrend produces three categories of signals:
- Genuine trend starts -- the flip catches the early phase of a multi-bar directional move. This is the signal we want.
- Range chops -- the close briefly crosses the trail during sideways consolidation, then reverses. The trend state flips back within a few bars. This is the dominant failure mode in ranging markets.
- Counter-trend reversals -- the flip occurs against the higher-timeframe trend, typically catching the end of a corrective leg rather than the start of a new trend. The trade often hits the stop before reaching any meaningful target.
A pure SuperTrend cannot distinguish between these three categories because the trend state machine has no knowledge of trend strength, momentum exhaustion, volume confirmation, or higher-timeframe context. It only knows the immediate trail and the immediate close.
The five-gate confluence filter addresses each failure mode with a specific structural check. Each gate is independent -- it captures a different aspect of price behavior, not a redundant view of the same condition. Independence is the key word in any confluence design. Two indicators that are mathematically related (for example, the 14-period RSI and the 14-period Stochastic) do not produce real confluence when they agree, because they essentially measure the same quantity. Genuine confluence requires that each gate captures something the others miss.
Gate 1: EMA(100) Bias
The first gate is the simplest and the most universally applicable. A 100-period exponential moving average is computed on close. The gate state is:
buyEmaOk  = close > ema100
sellEmaOk = close < ema100
A buy signal passes Gate 1 only when the close is above EMA(100); a sell signal passes only below. This single condition eliminates the bulk of counter-trend reversal flips, because EMA(100) on most timeframes captures the medium-term trend direction. A buy flip below EMA(100) is by definition a counter-trend reversal -- it may still work, but the statistical edge is poor.
EMA(100) is chosen deliberately over slower MAs (200, 500) because it adapts faster to genuine trend changes. On a 1-hour chart, EMA(100) covers roughly four trading days of context. A flip on the right side of this slope-aware line carries meaningfully better follow-through statistics than a flip on the wrong side.
Note that this gate is a one-way filter -- it does not require the EMA itself to be sloping in the direction of the trade. The gate is satisfied even on a flat EMA, as long as price is on the correct side. This avoids the trap of requiring two trend signals at the same time (which would eliminate every legitimate trend reversal entry).
Gate 2: RSI Extreme Filter
The second gate uses the 14-period RSI to block signals that fire at momentum extremes. The conditions are:
buyRsiOk = rsi < rsiOverbought // default rsiOverbought = 70 sellRsiOk = rsi > rsiOversold // default rsiOversold = 30
A buy signal is blocked when RSI is already in overbought territory. A sell signal is blocked when RSI is already in oversold territory.
The logic is subtle. The classic mistake is to think "RSI overbought means sell, RSI oversold means buy". That logic produces counter-trend trades that fail in strong trends, where RSI can remain overbought or oversold for many consecutive bars while the trend continues. The Sentinel Levels logic is the opposite -- it uses the extreme zones to block trend-following entries that would arrive at the worst possible moment. If price has already rallied hard enough to push RSI above 70, a fresh long signal is statistically late. Similarly, a fresh short at RSI below 30 is late.
This gate is especially valuable on crypto and indices, where momentum extremes are more common and trend-following signals tend to fire at exhaustion. On slower Forex pairs the gate fires less often but still saves the trader from chasing already-extended moves.
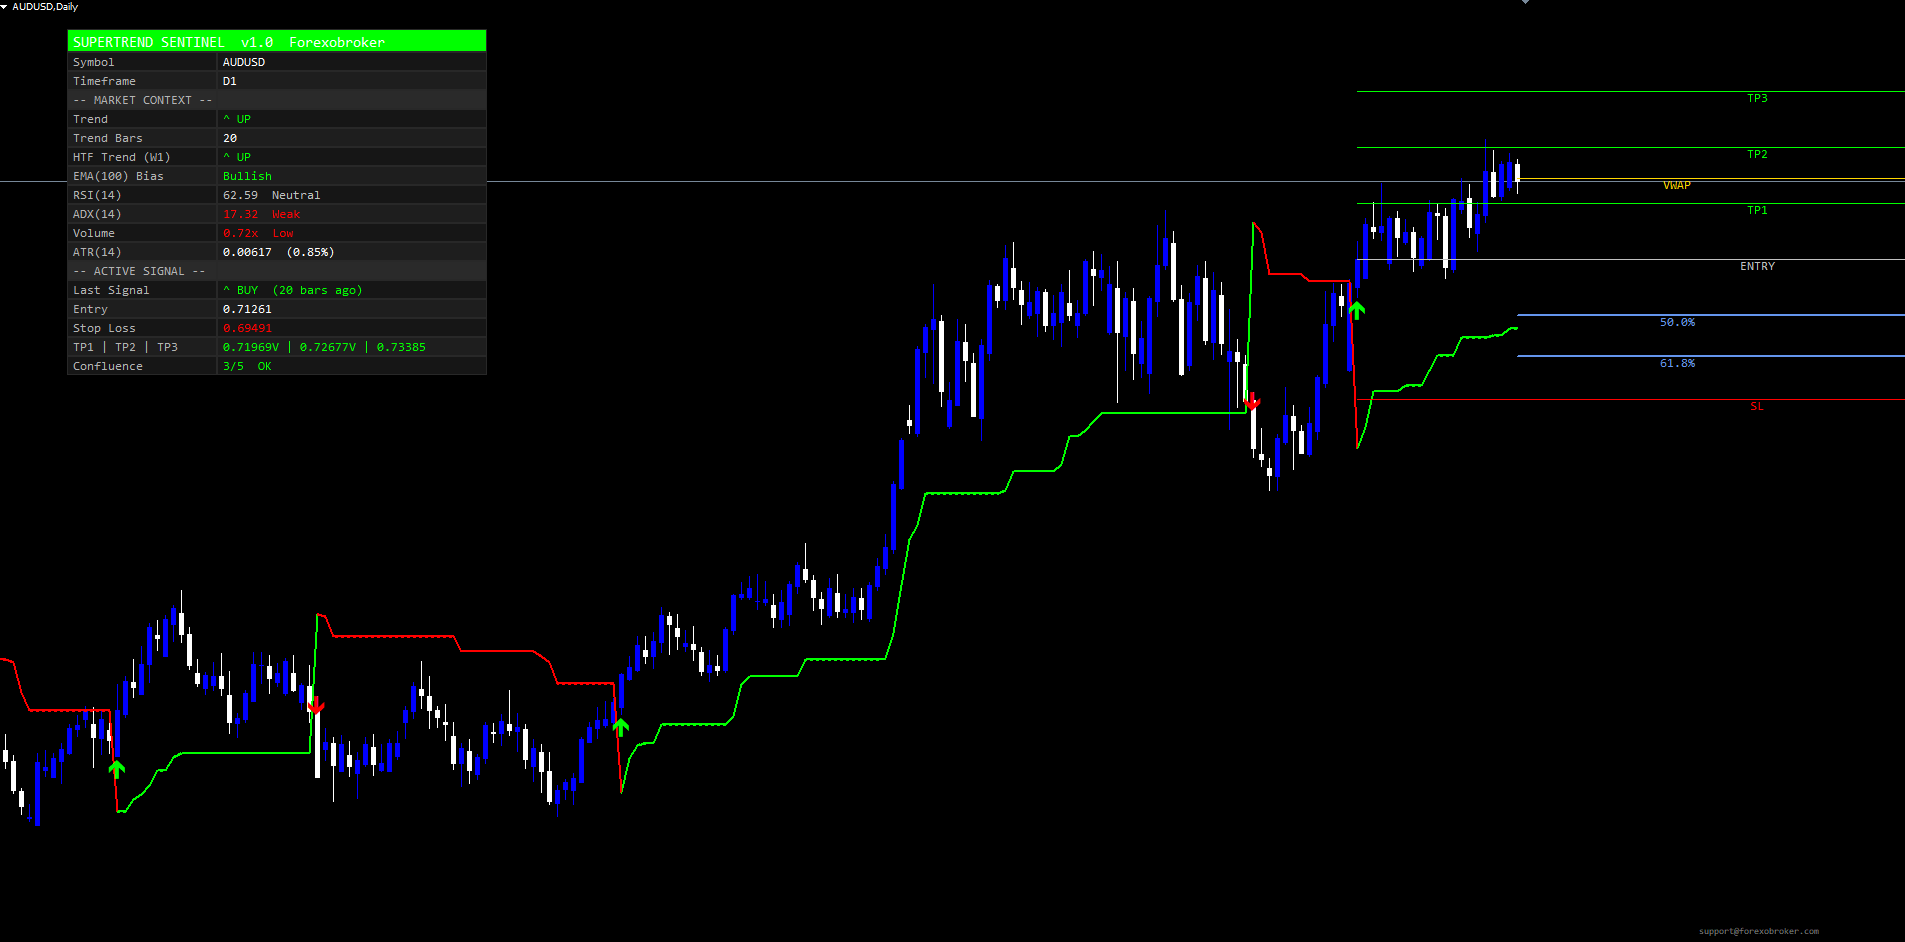
Gate 3: ADX Trending
The third gate addresses the dominant failure mode of every trend-following indicator -- false signals in ranging conditions. The 14-period Average Directional Index (ADX) measures trend strength without regard to direction:
adxOk = adx >= adxMin // default adxMin = 20
A signal passes Gate 3 only when ADX is at or above the minimum threshold. The threshold of 20 is the conventional dividing line between trending and ranging markets. Below 20, ADX is signaling that neither bulls nor bears have sustained control, which is exactly the condition where SuperTrend flips most often produce whipsaws.
The ADX value is also displayed live in the dashboard with three labels: Strong (>= 40), Trending (>= adxMin), Weak (below adxMin). On a typical Forex H1 chart, sessions oscillate between Weak (Asian range), Trending (London open), and back to Trending or Weak depending on the day. A SuperTrend flip during a Weak phase rarely follows through; a flip during a Trending or Strong phase often kicks off a multi-bar move.
Gate 4: Volume Above Average
The fourth gate uses tick volume as a proxy for market participation. For each closed bar, the gate compares the current tick volume against the N-bar simple moving average of tick volume:
volOk = volume >= volumeSMA(volLen) // default volLen = 20
A flip on a high-volume bar represents real participation -- many ticks, broad consensus on direction. A flip on a low-volume bar is typically a thin-market event that the next session's participants will reverse. The gate is permissive (>=, not strictly greater) so a flip on average-volume bars still passes.
On Forex, tick volume is the standard proxy. On equities and futures, where real volume is available, the same gate works on either. The dashboard displays the live volume ratio (current / N-bar average) with a three-label classification: High (>= 1.5x), Avg (>= 0.8x), Low (below 0.8x). A SuperTrend flip with the dashboard showing High volume is structurally stronger than a flip with Avg or Low volume.
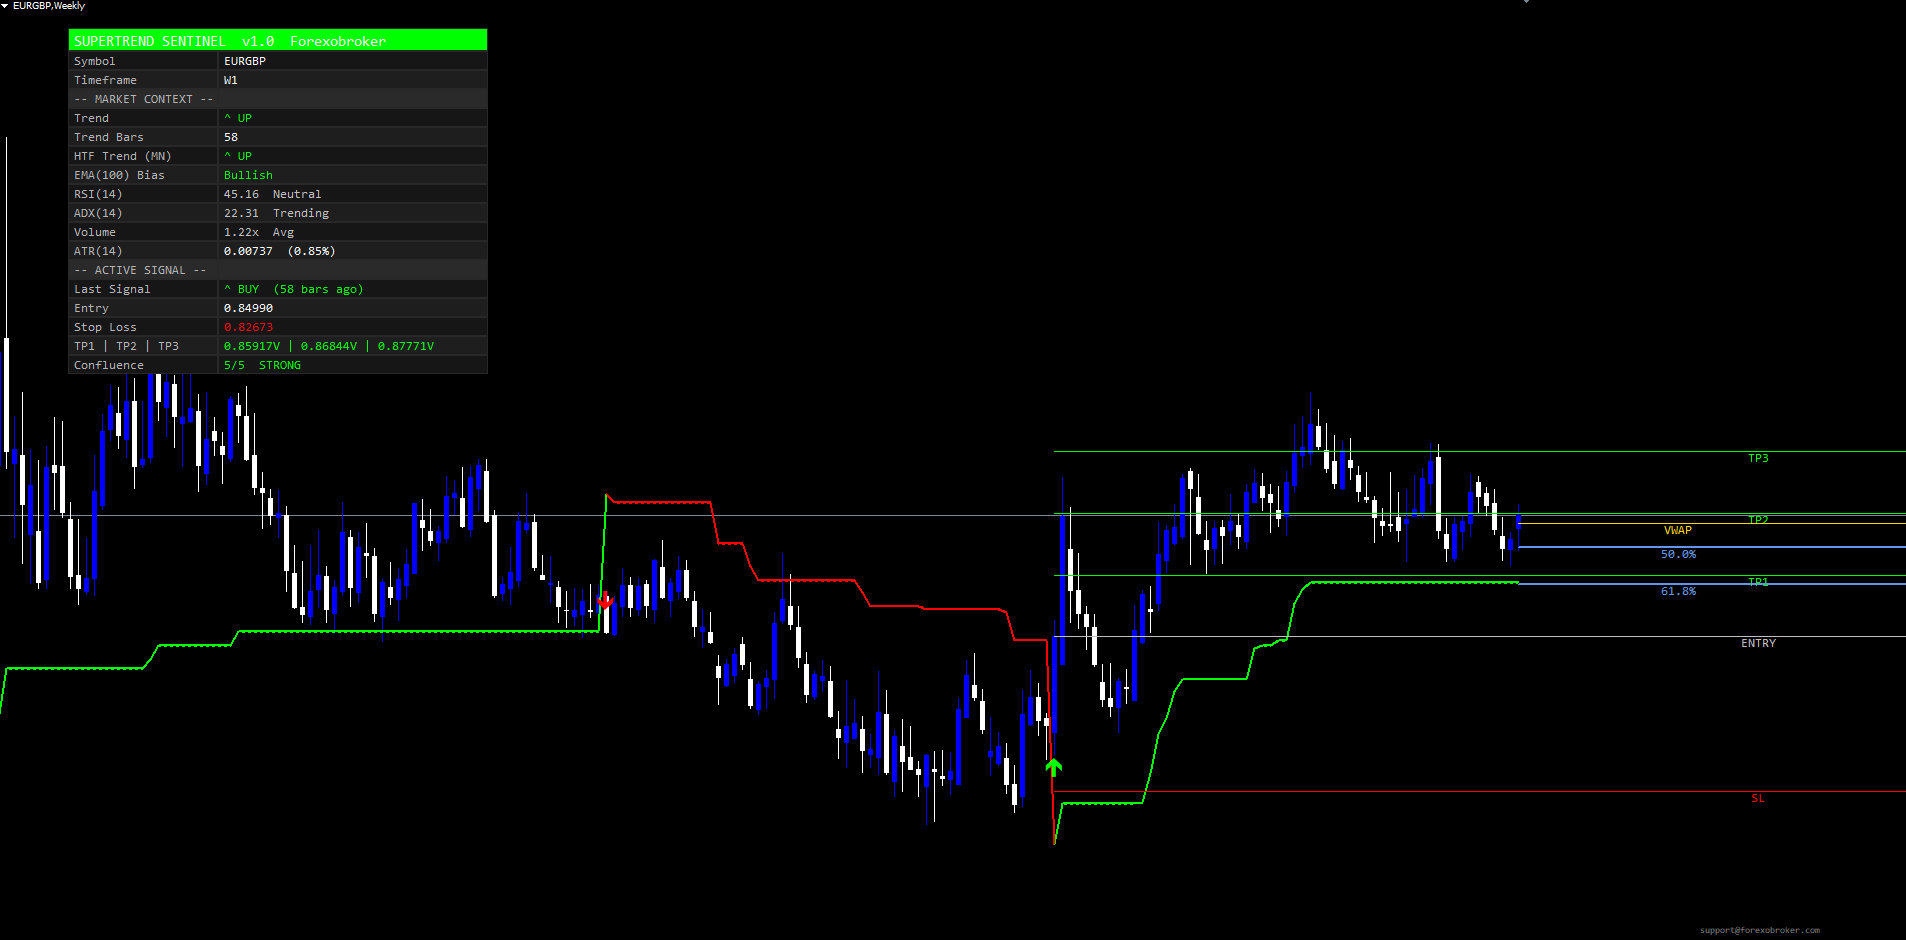
Gate 5: HTF SuperTrend Agreement
The fifth gate is the most powerful and the most computationally involved. The same SuperTrend algorithm is computed on a higher timeframe -- by default the current chart timeframe multiplied by 4 (so M15 chart uses H1 HTF, H1 chart uses H4 HTF, H4 chart uses D1 HTF). The gate is:
buyHtfOk  = htfTrend == +1
sellHtfOk = htfTrend == -1
A buy signal passes Gate 5 only when the higher-timeframe SuperTrend is also bullish; a sell signal only when the HTF is bearish. This single gate eliminates the entire category of counter-HTF reversal trades -- the ones that destroy account balances when traders fight a strong daily trend on the 1-hour chart.
The HTF SuperTrend is computed in two passes. First, the indicator walks the full HTF bar history and computes the SuperTrend state machine at that timeframe using exactly the same formula. Second, for each chart bar, the indicator looks up which HTF bar contains the chart bar's timestamp and uses the previous fully-closed HTF bar's trend state -- never the current in-progress HTF bar. This ensures the HTF gate is non-repainting: the value never changes once the chart bar closes.
Filter Modes: Loose, Balanced, Strict
The trader controls how many gates must pass for a signal to count as alert-worthy via the Filter Mode input:
- Loose (no gates) -- All raw trend flips pass. The chart shows every flip as an arrow with TP/SL lines. The Confluence row in the dashboard still shows the live gate-pass count for informational use, but alerts fire on every flip regardless.
- Balanced (3 of 5) -- A signal passes when at least 3 of the 5 enabled gates pass. This is the default and represents the best balance between signal frequency and quality.
- Strict (all gates pass) -- A signal passes only when all enabled gates pass. The lowest signal frequency and the highest individual signal quality.
A trader can also disable individual gates via the per-gate boolean toggles -- if you do not care about volume, set Gate 4 to false and the gate count adjusts automatically. The gate-pass logic accounts for the count of enabled gates: in Balanced mode, if you have only 3 gates enabled, the threshold becomes 3 of 3 (all three pass), not 3 of 5.
The filter mode setting determines which trend flips fire alerts -- it never suppresses chart visuals. Every raw trend flip always draws an arrow, refreshes the Entry / SL / TP1 / TP2 / TP3 lines, and updates the dashboard's Last Signal row. This is a deliberate design choice. The trader can see the complete historical signal record on the chart, read the Confluence row to evaluate quality, and decide whether to trust the live signal. Alerts (popup, sound, email, push) fire only on signals that meet the configured filter mode -- preventing alert fatigue while preserving full chart context.
The Non-Repaint Guarantee
A repainting indicator is one where the historical record on the chart changes as new ticks arrive. Most retail traders have been burned by a "great-looking" backtest that turns out to have been produced by an indicator silently updating its past signals as more recent data came in. SuperTrend Sentinel Levels is engineered specifically to prevent any such repainting.
Three architectural choices guarantee non-repaint:
-
Closed-bar signal evaluation. The signal-detection block runs only at shift >= 1 (the just-closed bars). The live bar ( shift = 0 ) updates the SuperTrend line and the buffer zones for visualization purposes, but no signal arrow is drawn and no signal state is updated based on the live bar. Pine code uses barstate.isconfirmed for the same guarantee.
-
HTF lookups use the previous closed HTF bar. When the HTF gate looks up the higher-timeframe SuperTrend state for a chart bar, it uses iBarShift + 1 -- the previous fully-closed HTF bar -- not the current in-progress HTF bar. Without this offset, the HTF gate would flicker between true and false as the current HTF bar evolved, causing the chart signal to appear and disappear.
-
Alert one-shot guards. Each alert channel maintains a lastAlertBar timestamp. When a signal fires, the alert fires once and the timestamp is recorded; subsequent ticks on the same bar do not refire the alert. When the indicator first attaches to a chart, all alert timestamps are armed to the latest closed bar -- this prevents the indicator from firing alerts for historical signals that fired before the trader attached the indicator.
The architectural rule is simple: a value drawn on the chart for bar N never changes after bar N closes. Once you see an arrow at a specific bar, the arrow stays there permanently. Once a TP/SL line is set, it does not move. This is a non-negotiable property of the indicator.
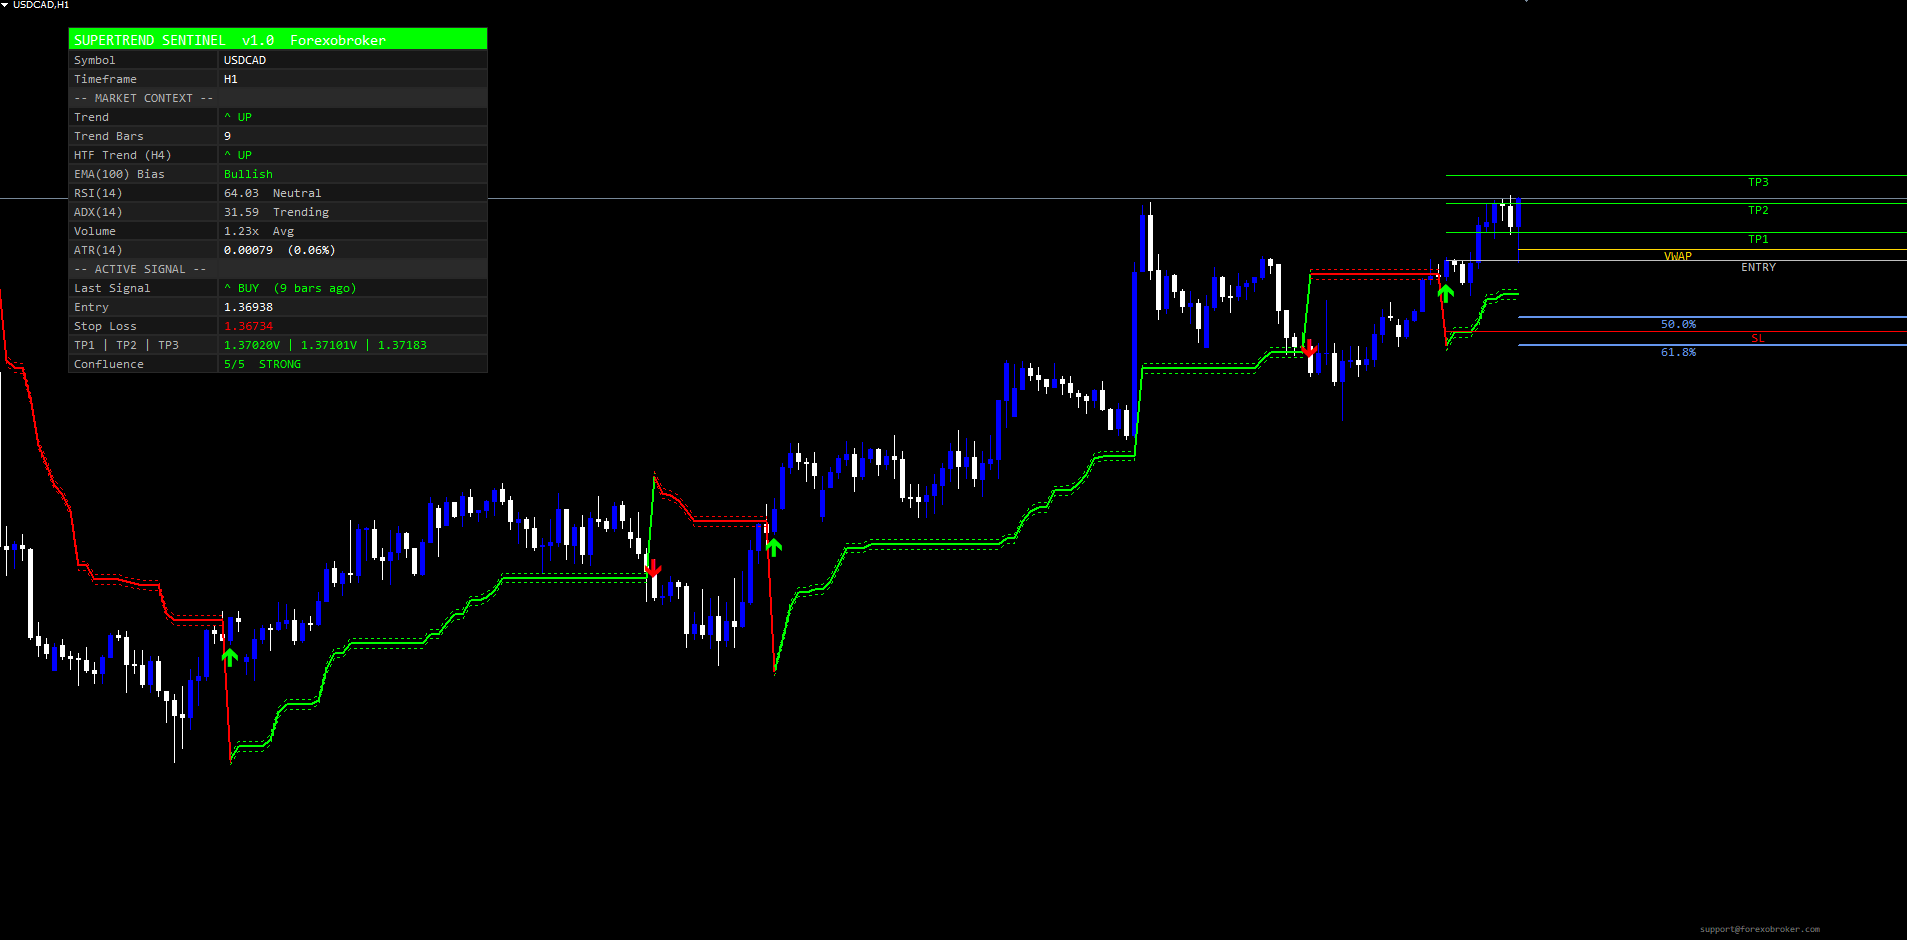
ATR-Anchored Risk Architecture
Every trend flip -- regardless of whether the confluence gates pass -- draws five horizontal levels extending forward as rays to the right edge of the chart:
- Entry -- the closing price of the signal bar, drawn in neutral gray
- Stop Loss -- entry minus slFactor * atrTpSl for longs, entry plus the same for shorts (drawn in bear color)
- TP1 -- entry plus tp1Factor * atrTpSl for longs (drawn in bull color)
- TP2 -- entry plus tp2Factor * atrTpSl for longs
- TP3 -- entry plus tp3Factor * atrTpSl for longs
The atrTpSl value is computed from the dedicated TP/SL ATR length input (default 14, separate from the SuperTrend's own ATR period). This separation is intentional -- the SuperTrend uses a shorter ATR (10) to keep the trend trail tight, while the risk architecture uses a slightly longer ATR (14) to keep TP/SL spacing stable through minor volatility blips.
The default factor values produce a 1 : 2 : 3 ATR profile for the three TPs and 2.5 ATR for the stop. This gives reward-to-risk ratios of 0.40 : 0.80 : 1.20 -- meaning a trader who scales out one-third at each target captures roughly 0.80 R per signal on average, before any win-rate considerations. The factors are fully configurable, so a trader who prefers wider stops and bigger targets can adjust independently.
The Stop Loss has two operating modes:
- Fixed -- the SL stays at its original price for the duration of the signal. This is the standard mode.
- Trailing -- the SL ratchets in favor of the trade as the SuperTrend line itself ratchets. The SL never moves against the trade. This mode is useful for letting winners run while protecting open profits, at the cost of a less predictable risk envelope.
Hit detection is automatic. As price evolves after a signal, the indicator scans the bars from the signal bar to the current bar and checks whether each closed bar's high or low touched any of the five levels. When TP1 is hit, a small "V" mark appears next to the TP1 price in the dashboard's TP row. When the SL is hit, an "X HIT" flag appears next to the SL row. Alerts fire on each hit through the same 11-channel system as the BUY/SELL alerts.
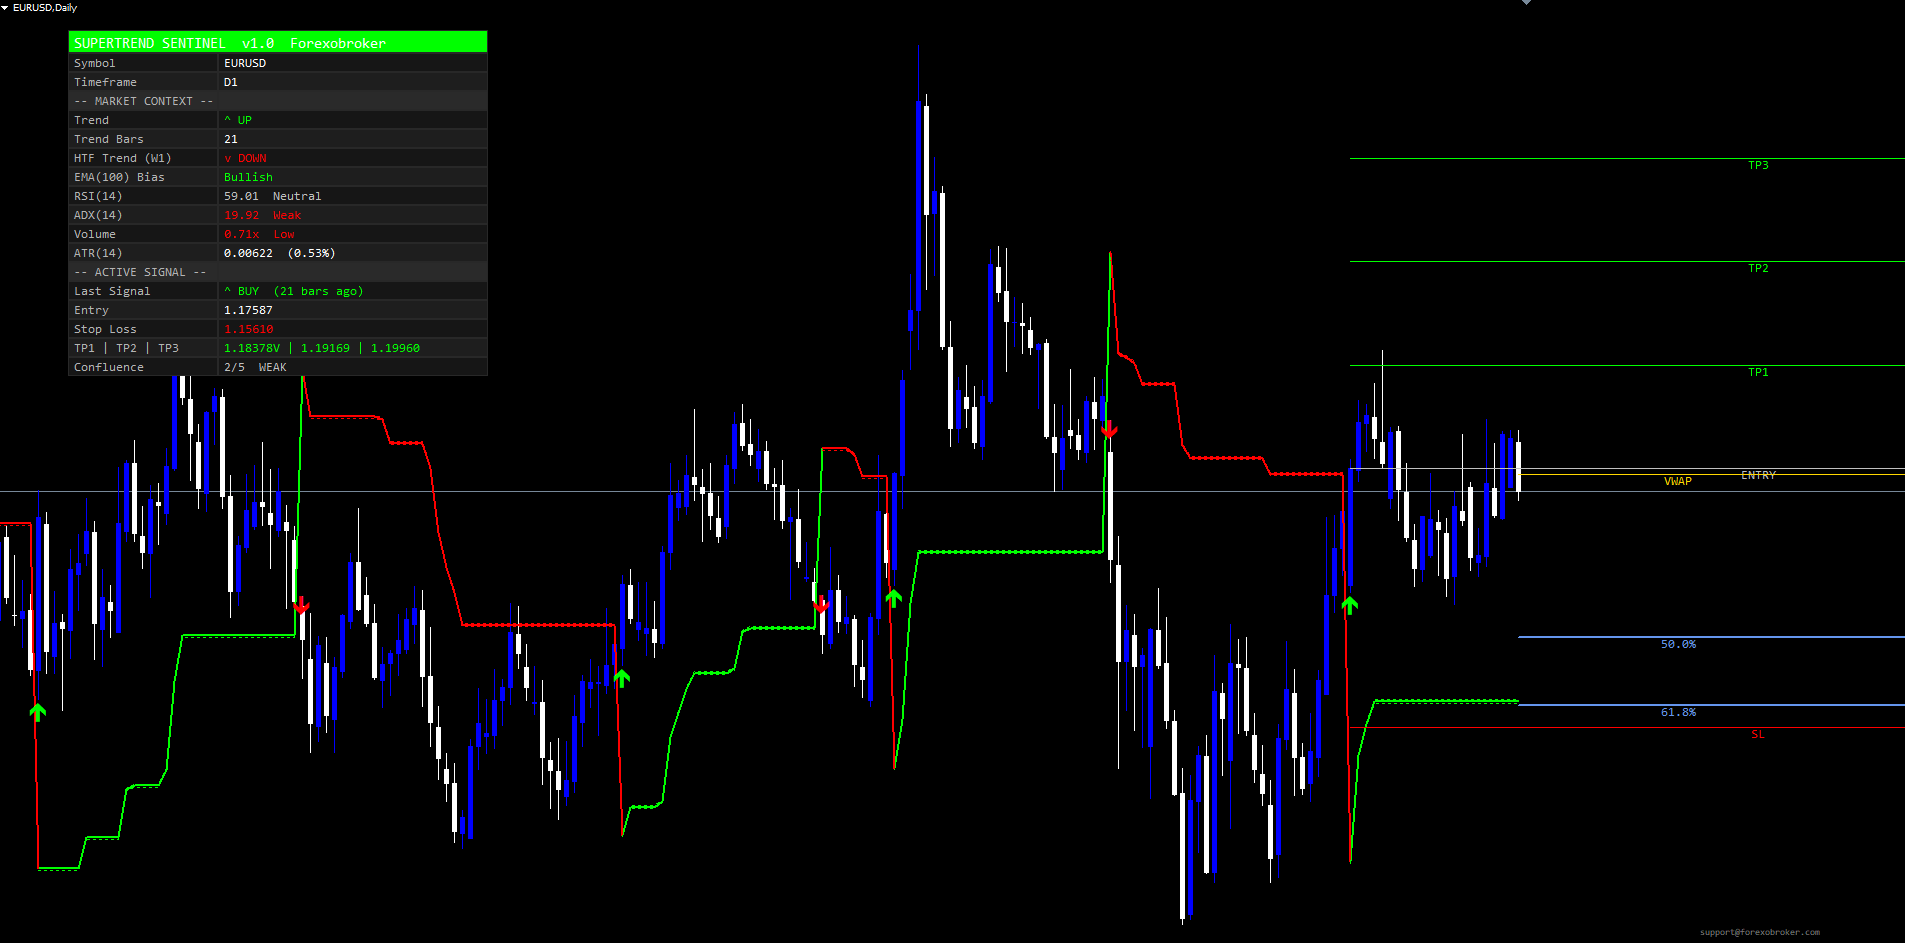
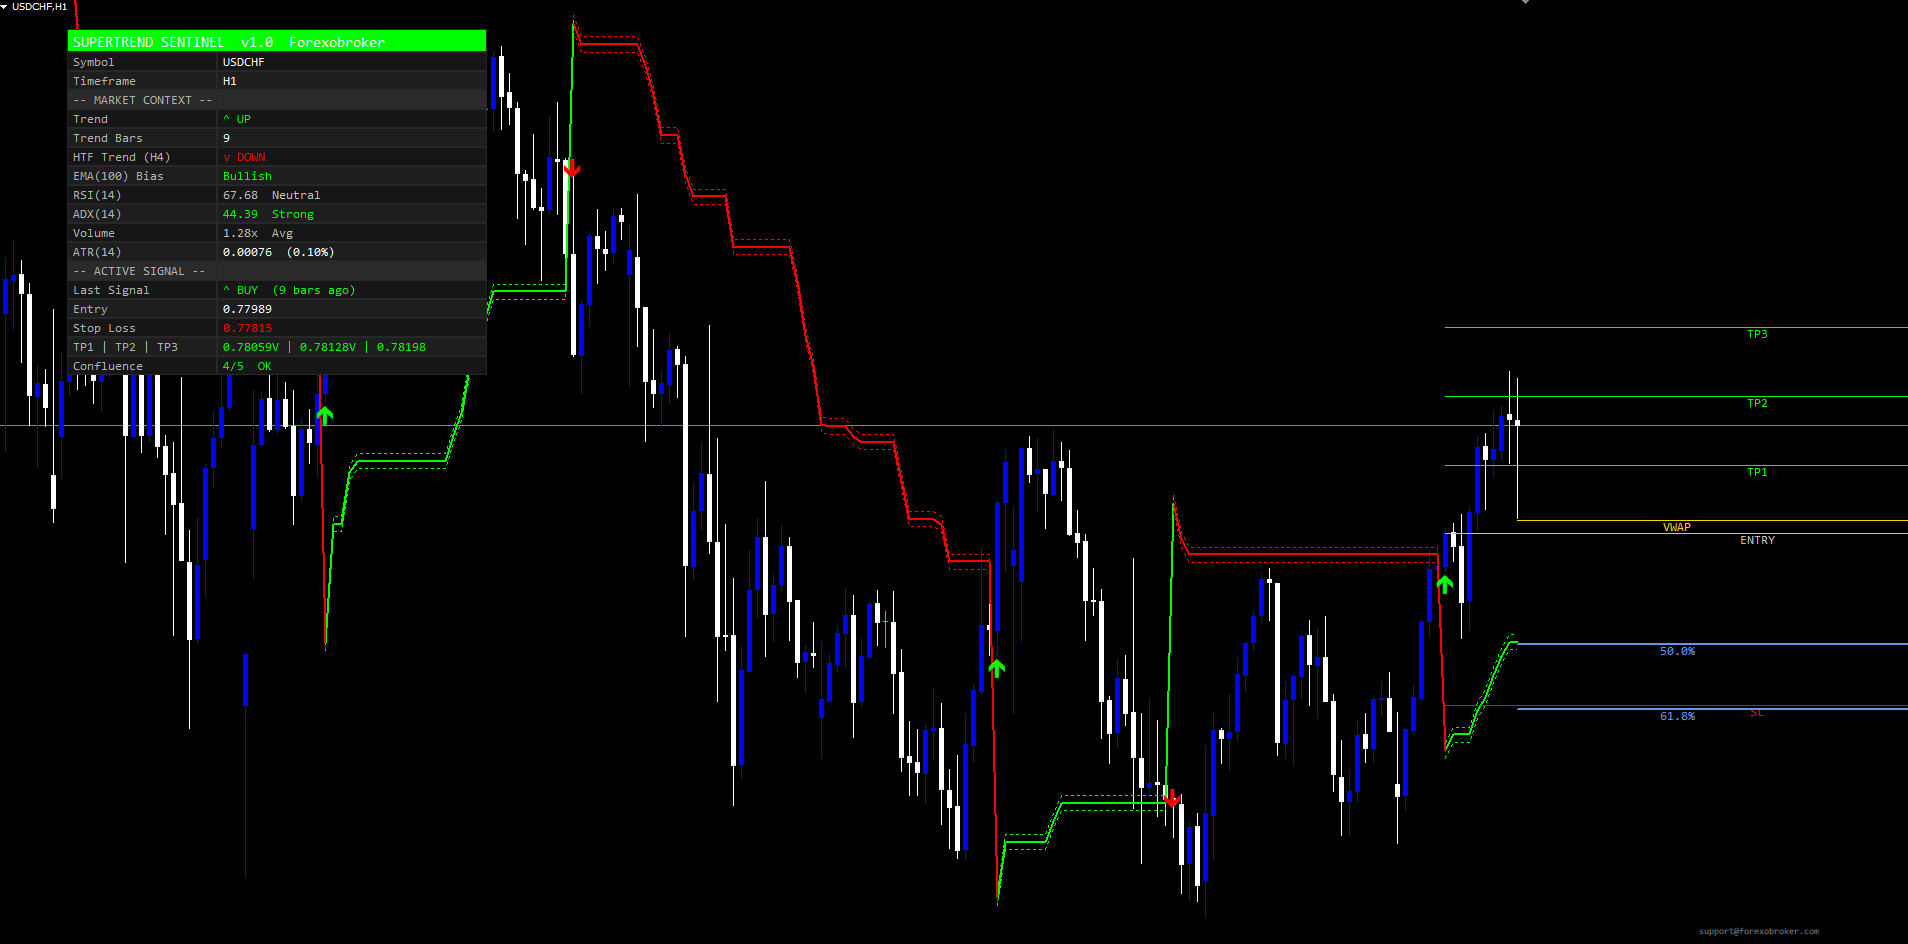
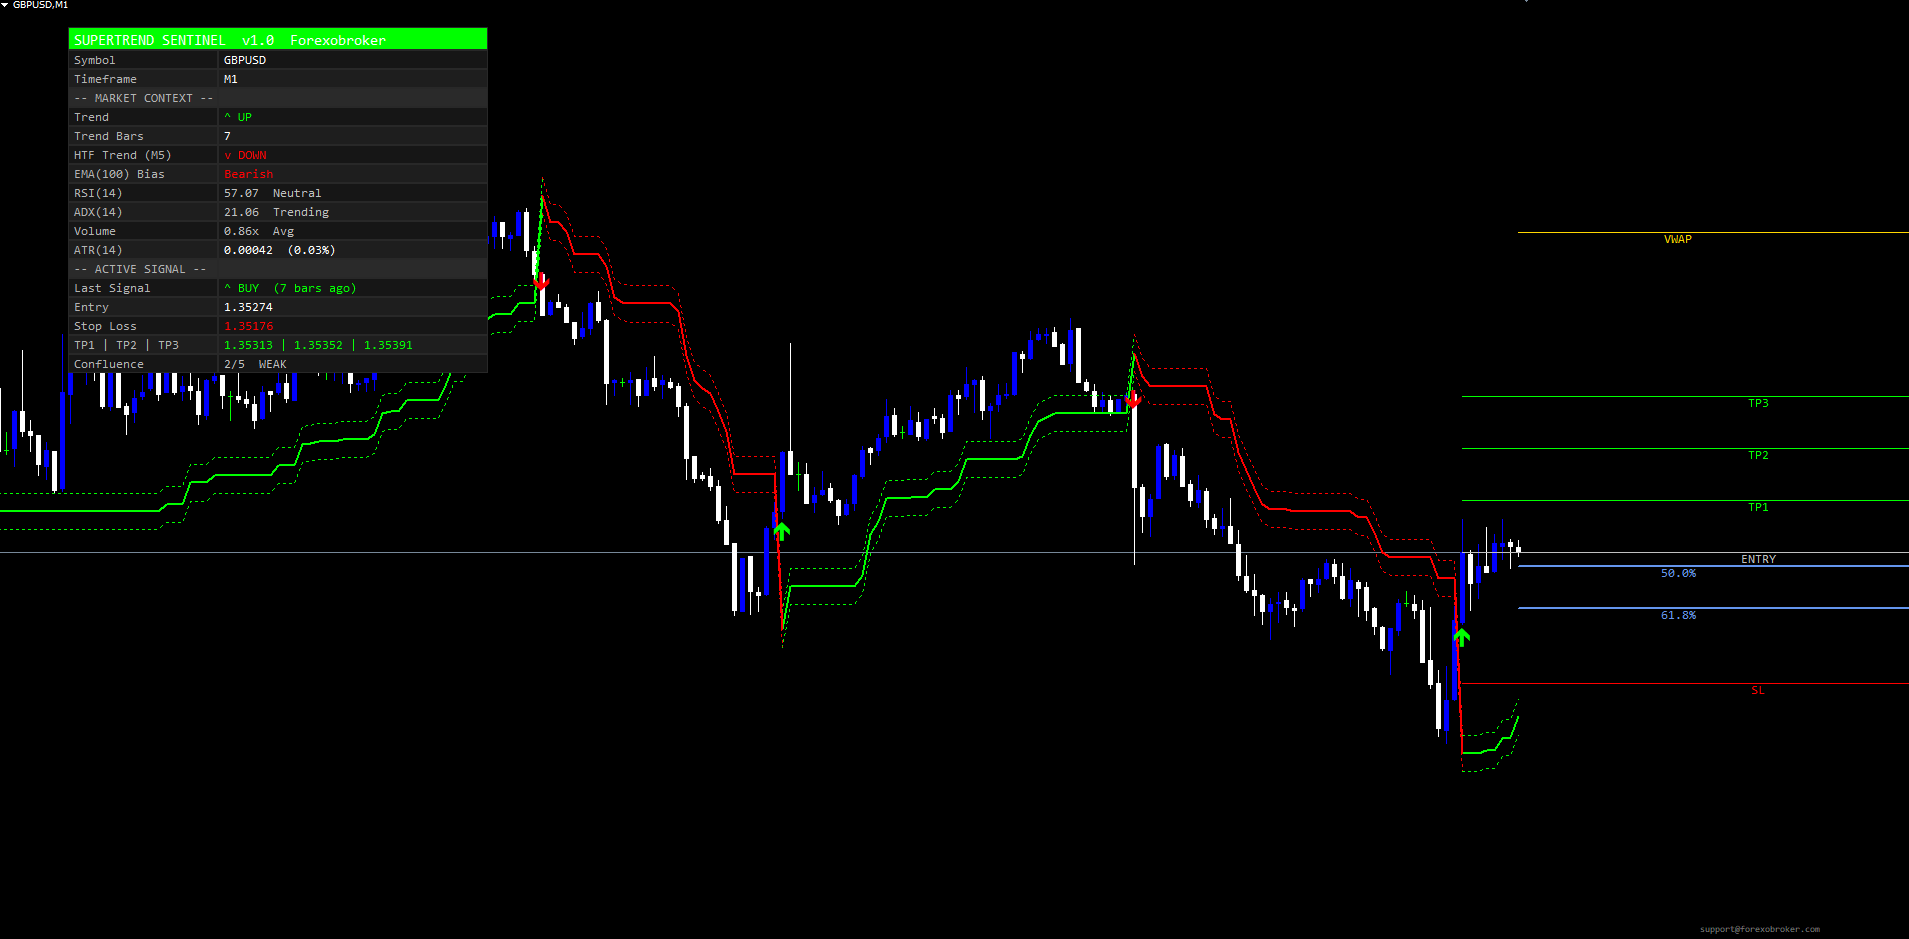
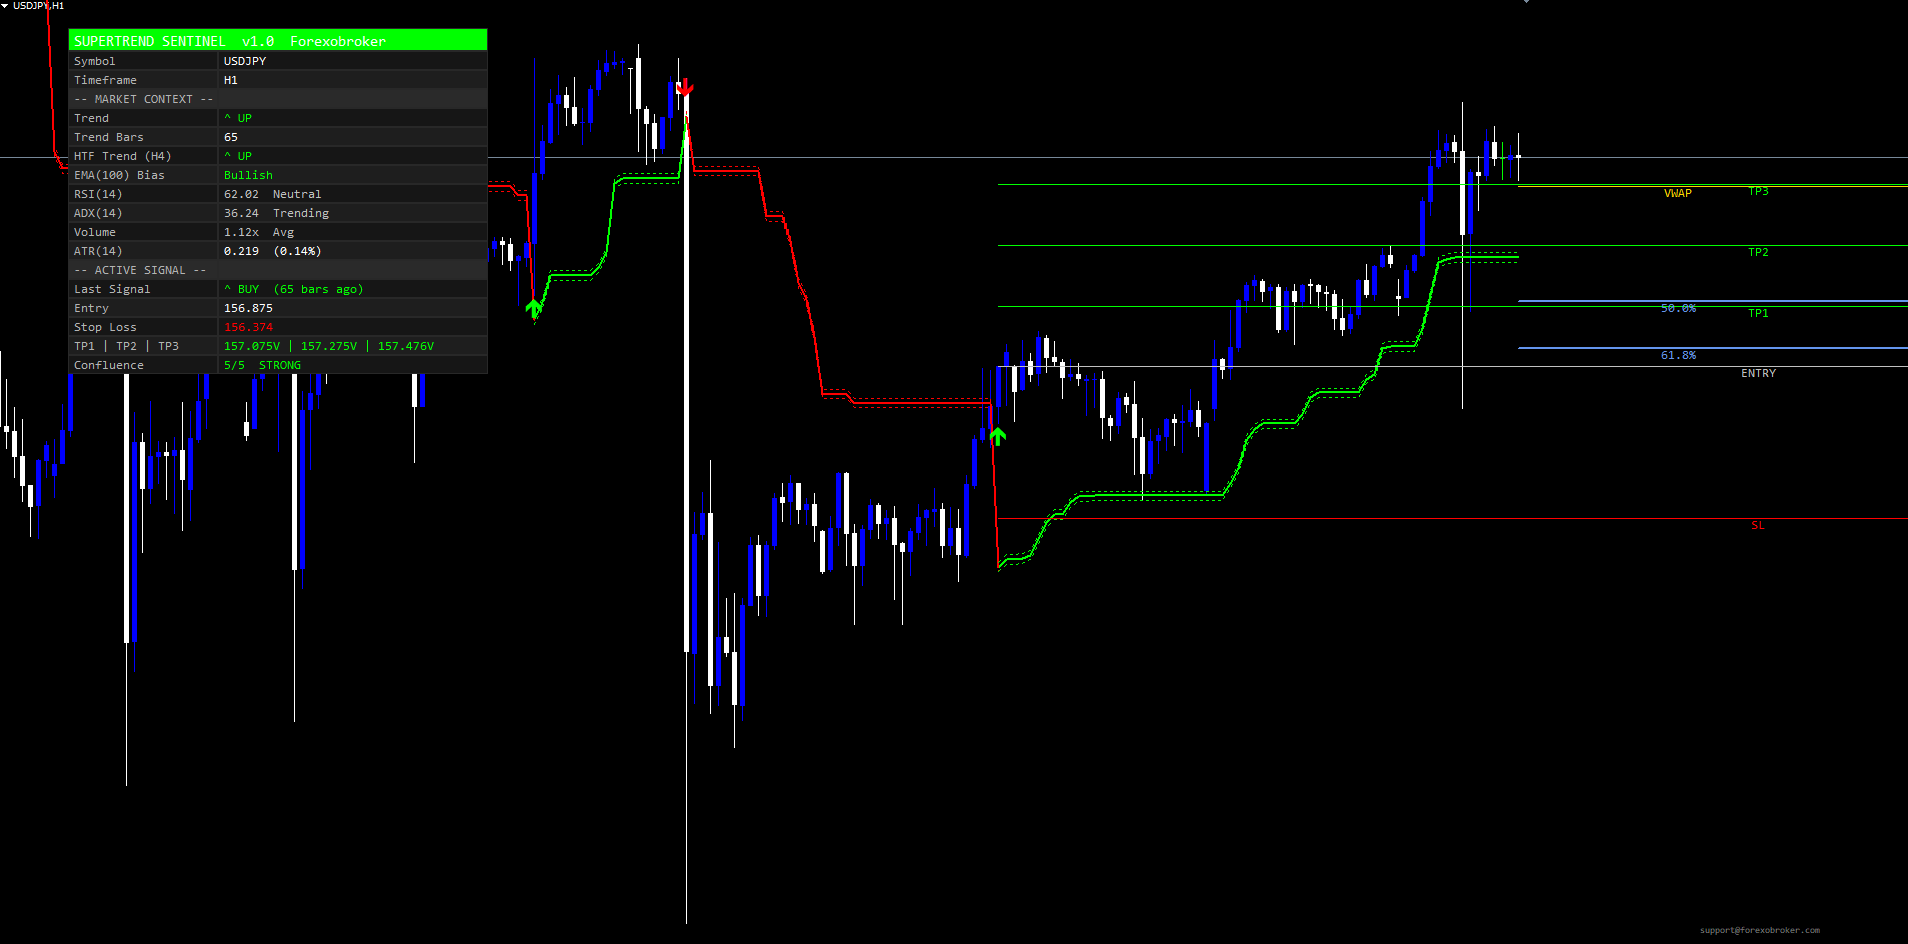
The 18-Row Confirmation Dashboard
The dashboard is the trader's heads-up display. It sits at any of six corner positions (Top Right / Top Left / Bottom Right / Bottom Left / Middle Right / Middle Left) with user-tunable horizontal and vertical pixel offsets to clear price scales, navigators, or other indicators. The text size is selectable from Tiny / Small / Normal / Large / Huge, and the column widths can be set manually or left on auto.
The 18 rows are organized into three sections:
Header
- Row 0: "SUPERTREND SENTINEL v1.0 Forexobroker" -- a bright bull-color band that doubles as a quick visual brand marker.
Identification
- Row 1: Symbol -- e.g., USDJPY
- Row 2: Timeframe -- e.g., M15
- Row 3: Separator -- "-- MARKET CONTEXT --"
Market Context
- Row 4: Trend -- "^ UP" in bull color or "v DOWN" in bear color (current closed-bar trend state)
- Row 5: Trend Bars -- count of consecutive bars in the current trend direction
- Row 6: HTF Trend -- "^ UP" / "v DOWN" / "-" for the higher timeframe (label shows the HTF timeframe)
- Row 7: EMA(100) Bias -- Bullish / Bearish / Neutral
- Row 8: RSI(14) -- value plus zone label (Overbought / Neutral / Oversold)
- Row 9: ADX(14) -- value plus strength label (Strong / Trending / Weak)
- Row 10: Volume -- ratio (current / N-bar average) plus label (High / Avg / Low)
- Row 11: ATR(N) -- value plus percent of price
- Row 12: Separator -- "-- ACTIVE SIGNAL --"
Active Signal
- Row 13: Last Signal -- "^ BUY" / "v SELL" with "(N bars ago)" age stamp
- Row 14: Entry -- entry price
- Row 15: Stop Loss -- price plus optional "X HIT" flag
- Row 16: TP1 | TP2 | TP3 -- three prices separated by pipes, each with optional "V" hit mark
- Row 17: Confluence -- live gate-pass count (e.g., "4/5 OK", "5/5 STRONG", "2/5 WEAK", "0/5 NONE")
The Confluence row colors itself dynamically: green for STRONG and OK, gray for WEAK, red for NONE. The trader reads this row at a glance to judge whether the current signal is alert-worthy under the chosen Filter Mode.
The dashboard repaints on every tick (via OnTimer in MT5, every OnCalculate pass in MT4) so values stay current. The footer at the chart's bottom-right corner shows support@forexobroker.com for quick contact.
The 11-Channel Alert Package
SuperTrend Sentinel Levels exposes 11 distinct alert conditions, each routed through the four delivery modes (popup, sound, email, mobile push) according to the trader's input toggles:
- BUY -- raw trend flip from bearish to bullish that passes the configured filter mode
- SELL -- raw trend flip from bullish to bearish that passes the filter mode
- STRONG BUY -- BUY signal where all enabled confluence gates pass (regardless of filter mode setting)
- STRONG SELL -- SELL signal where all enabled gates pass
- Trend Flip Up -- the underlying SuperTrend state flipped to +1 on the latest closed bar (fires regardless of gates)
- Trend Flip Down -- the SuperTrend state flipped to -1
- TP1 Hit -- price touched TP1 since the active signal opened
- TP2 Hit -- price touched TP2
- TP3 Hit -- price touched TP3
- SL Hit -- price touched the Stop Loss
- Any Signal -- convenience alert that fires on any BUY or SELL
A per-bar one-shot guard prevents the same alert from firing twice on the same closed bar. Alert messages include the symbol, timeframe, and closing price -- the popup and email alerts read for example:
STSL: BUY @ 1.08245 EURUSD H1 STSL: TP2 hit EURUSD H1 STSL: Trend flipped UP EURUSD H1
The Strong Buy and Strong Sell alerts fire in addition to the regular Buy/Sell, not instead -- a STRONG BUY signal also fires a BUY alert at the same moment. This lets traders subscribe to either channel depending on whether they want every passable signal or only the high-confluence ones.
The Email and Push delivery modes require MetaTrader configuration before they will fire. Email requires SMTP server credentials in Tools > Options > Email . Push requires the trader's MetaQuotes ID in Tools > Options > Notifications . Once configured, every alert routes through all enabled modes simultaneously.
VWAP and Fibonacci Levels
Two additional visual layers run independently of the SuperTrend signal logic:
VWAP -- A daily-session Volume-Weighted Average Price is computed cumulatively from the start of the current day's bar. The VWAP is drawn as a single ray-right horizontal line with a label, colored gold by default. The session boundary is detected via iTime(_, PERIOD_D1, 0) so the line resets at each daily candle open. VWAP is widely used as an institutional reference price and as a magnet for intraday mean reversion.
Fibonacci Golden Zone -- Two horizontal lines mark the 61.8% and 50% retracement levels of the highest high and lowest low over a configurable lookback window (default 50 bars). These are drawn as ray-right horizontal lines colored cornflower blue with percentage labels. The golden zone is one of the most-watched retracement areas in retail technical analysis.
Both layers are independently toggleable via input parameters. When toggled off, the lines and labels are removed from the chart and no resources are consumed.
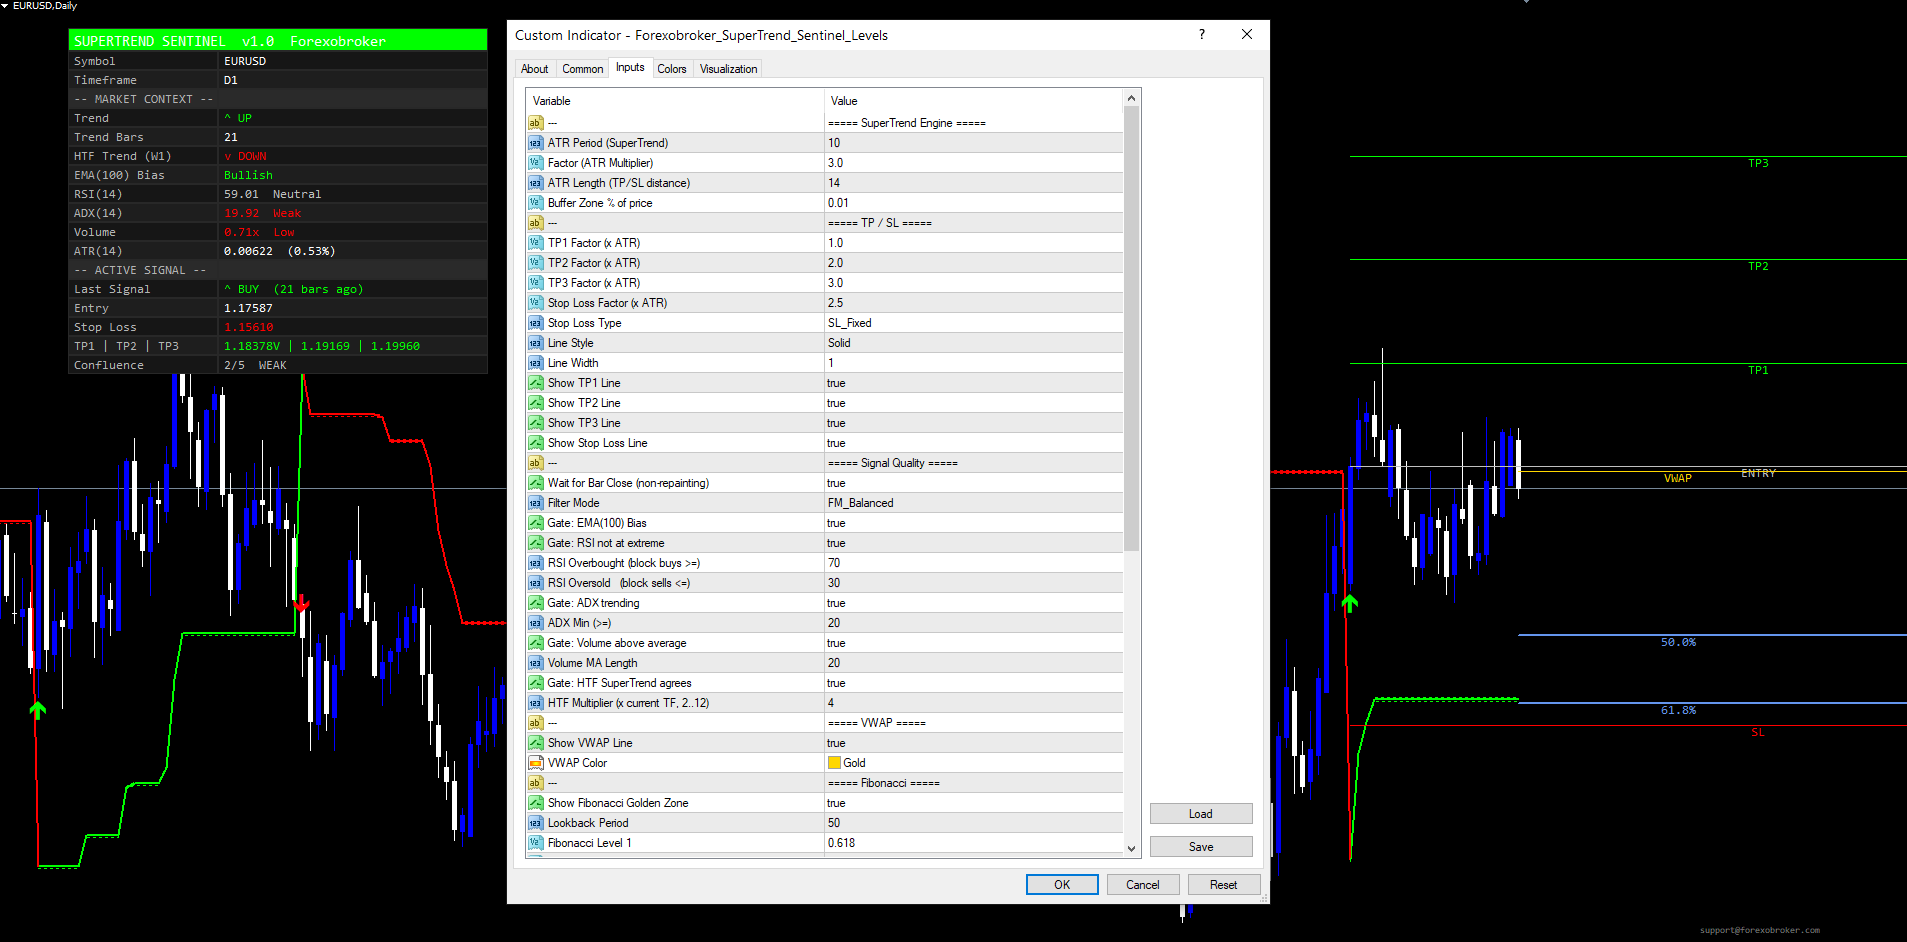
Parameter Reference
SuperTrend Engine
| Input | Default | Range | Description |
|---|---|---|---|
| ATR Period (SuperTrend) | 10 | 1..1000 | ATR length for the SuperTrend trail |
| Factor (ATR Multiplier) | 3.0 | 0.1..100 | Band width multiplier |
| ATR Length (TP/SL distance) | 14 | 1..1000 | ATR length for TP and SL spacing |
| Buffer Zone % | 0.01 | 0..10 | Buffer expressed as percent of SuperTrend value |
TP / SL
| Input | Default | Description |
|---|---|---|
| TP1 Factor (x ATR) | 1.0 | TP1 distance |
| TP2 Factor (x ATR) | 2.0 | TP2 distance |
| TP3 Factor (x ATR) | 3.0 | TP3 distance |
| Stop Loss Factor (x ATR) | 2.5 | SL distance |
| Stop Loss Type | Fixed | Fixed or Trailing |
| Line Style | Solid | Solid / Dashed / Dotted |
| Line Width | 1 | TP/SL line width |
| Show TP1 / TP2 / TP3 / SL | true | Individual visibility toggles |
Signal Quality
| Input | Default | Description |
|---|---|---|
| Wait for Bar Close | true | Non-repaint guard |
| Filter Mode | Balanced | Loose / Balanced / Strict |
| Gate: EMA(100) Bias | true | Block longs below / shorts above EMA(100) |
| Gate: RSI not at extreme | true | Block longs at OB / shorts at OS |
| RSI Overbought | 70 | Block buys above this RSI value |
| RSI Oversold | 30 | Block sells below this RSI value |
| Gate: ADX trending | true | Block signals when ADX is below threshold |
| ADX Min | 20 | ADX threshold |
| Gate: Volume above average | true | Block signals on weak-volume bars |
| Volume MA Length | 20 | Volume moving average period |
| Gate: HTF SuperTrend agrees | true | Block signals against the HTF trend |
| HTF Multiplier | 4 | HTF = current x mult (2..12) |
VWAP and Fibonacci
| Input | Default | Description |
|---|---|---|
| Show VWAP Line | true | Daily session VWAP |
| VWAP Color | Gold | VWAP line color |
| Show Fibonacci (Golden Zone) | true | 50% and 61.8% levels |
| Lookback Period | 50 | Bars used to find swing high/low |
| Fibonacci Level 1 | 0.618 | First retracement level |
| Fibonacci Level 2 | 0.50 | Second retracement level |
| Fib Color 1 / Color 2 | Cornflower Blue | Fib line colors |
Dashboard
| Input | Default | Description |
|---|---|---|
| Show Dashboard | true | Master toggle |
| Dashboard Position | Top Right | Six options |
| Dashboard Text Size | Normal | Tiny / Small / Normal / Large / Huge |
| Dashboard X Offset | 70 | Horizontal padding (px) |
| Dashboard Y Offset | 30 | Vertical padding (px) |
| Dashboard Label Col Width | 0 | 0 = auto, or custom px |
| Dashboard Value Col Width | 0 | 0 = auto, or custom px |
Alerts
| Input | Default | Description |
|---|---|---|
| Alerts: Popup | true | MetaTrader popup dialog |
| Alerts: Sound | true | Play sound file |
| Alert Sound File | alert.wav | Custom sound filename |
| Alerts: Email | false | Send email |
| Alerts: Push Notification | false | Mobile push |
Appearance
| Input | Default | Description |
|---|---|---|
| Bull Color | Lime | Bullish trend and BUY arrow color |
| Bear Color | Red | Bearish trend and SELL arrow color |
| Neutral Color | Silver | Neutral state color |
| Dashboard Background | Dark Obsidian | Dashboard cell background |
Conclusion
SuperTrend Sentinel Levels takes the classic SuperTrend trend-following engine, wraps it in a five-gate confluence filter, and pairs it with a full ATR-anchored risk architecture and a comprehensive 18-row confirmation dashboard. The five gates -- EMA(100) bias, RSI extreme filter, ADX trending, volume above average, and HTF SuperTrend agreement -- each capture a different structural condition that distinguishes genuine trend starts from range chops and counter-trend reversals.
The non-repaint guarantee, the closed-bar signal evaluation, the auto-arming alert guards, and the chart-visuals-always-draw design all serve a single goal: give the trader a tool that records its decisions transparently, never lies about historical signals, and never floods the trader with alerts the moment the indicator attaches to a new chart.
For traders who already use SuperTrend in their workflow, Sentinel Levels is a drop-in upgrade that adds the confluence and risk architecture without changing the underlying state machine. For traders who have abandoned SuperTrend due to whipsaws and counter-trend losses, the confluence filter turns the indicator into a usable tool again.
Download the indicator:
- MetaTrader 5: SuperTrend Sentinel Levels MT5
- MetaTrader 4: SuperTrend Sentinel Levels MT4
CONTACT & SUPPORT
- Email: info@forexobroker.com
- Questions: Use the Comments section on the product page or send a private message
- Bug Reports: Please include your broker name, account type, and a screenshot
-
✅ All MQL Tools: https://www.mql5.com/en/users/forexobroker/ ✅
--------------------------------------------------------------------------------------------------------------
🏦 **Broker I use**: https://icmarkets.com/?camp=55869
🏦 **Broker For EU Traders I use 1**: https://www.ictrading.com?camp=91414
🏦 **Broker I use 2**: https://one.exnessonelink.com/boarding/sign-up/a/c_thuv62ocfq
💻 **VPS**: https://chocoping.com/processing/aff.php?aff=738
💼 **Companies I use for getting funded**:
Fundednext: https://fundednext.com/?fpr=kestutis39
The5ers: https://www.the5ers.com/?afmc=16kl
FTMO: https://trader.ftmo.com/?affiliates=nRAyOhmFRnEnFdOpdLeh
Risk Disclaimer
Trading foreign exchange and CFDs on margin carries a high level of risk and may not be suitable for all investors. You may sustain a loss exceeding your initial investment. Trend Quorum is a technical analysis tool and does not guarantee profitable trades. Past performance is not indicative of future results. The authors accept no liability for any loss arising from use of the indicator. By using Trend Quorum you acknowledge sole responsibility for your trading decisions.


