
Momentum Tidebreaker: Three-Class Momentum Confluence Indicator With ATR-Based TP/SL for MT4 and MT5

Introduction
Momentum trading remains one of the most studied approaches in technical analysis, yet the everyday tools for it are deceptively simple. A moving average crossover, an RSI breach of 50, a divergence diamond. Each one captures a different fragment of what we mean by momentum, and each one in isolation fires too often or too late. A trader who acts on every EMA crossover gets whipsawed in ranging markets. A trader who acts only on divergence misses the entire continuation phase of a trend. The result, for most retail traders, is a chart cluttered with single-condition signals that have no built-in stop loss, no take profit, and no consistent rule for when to act and when to wait.
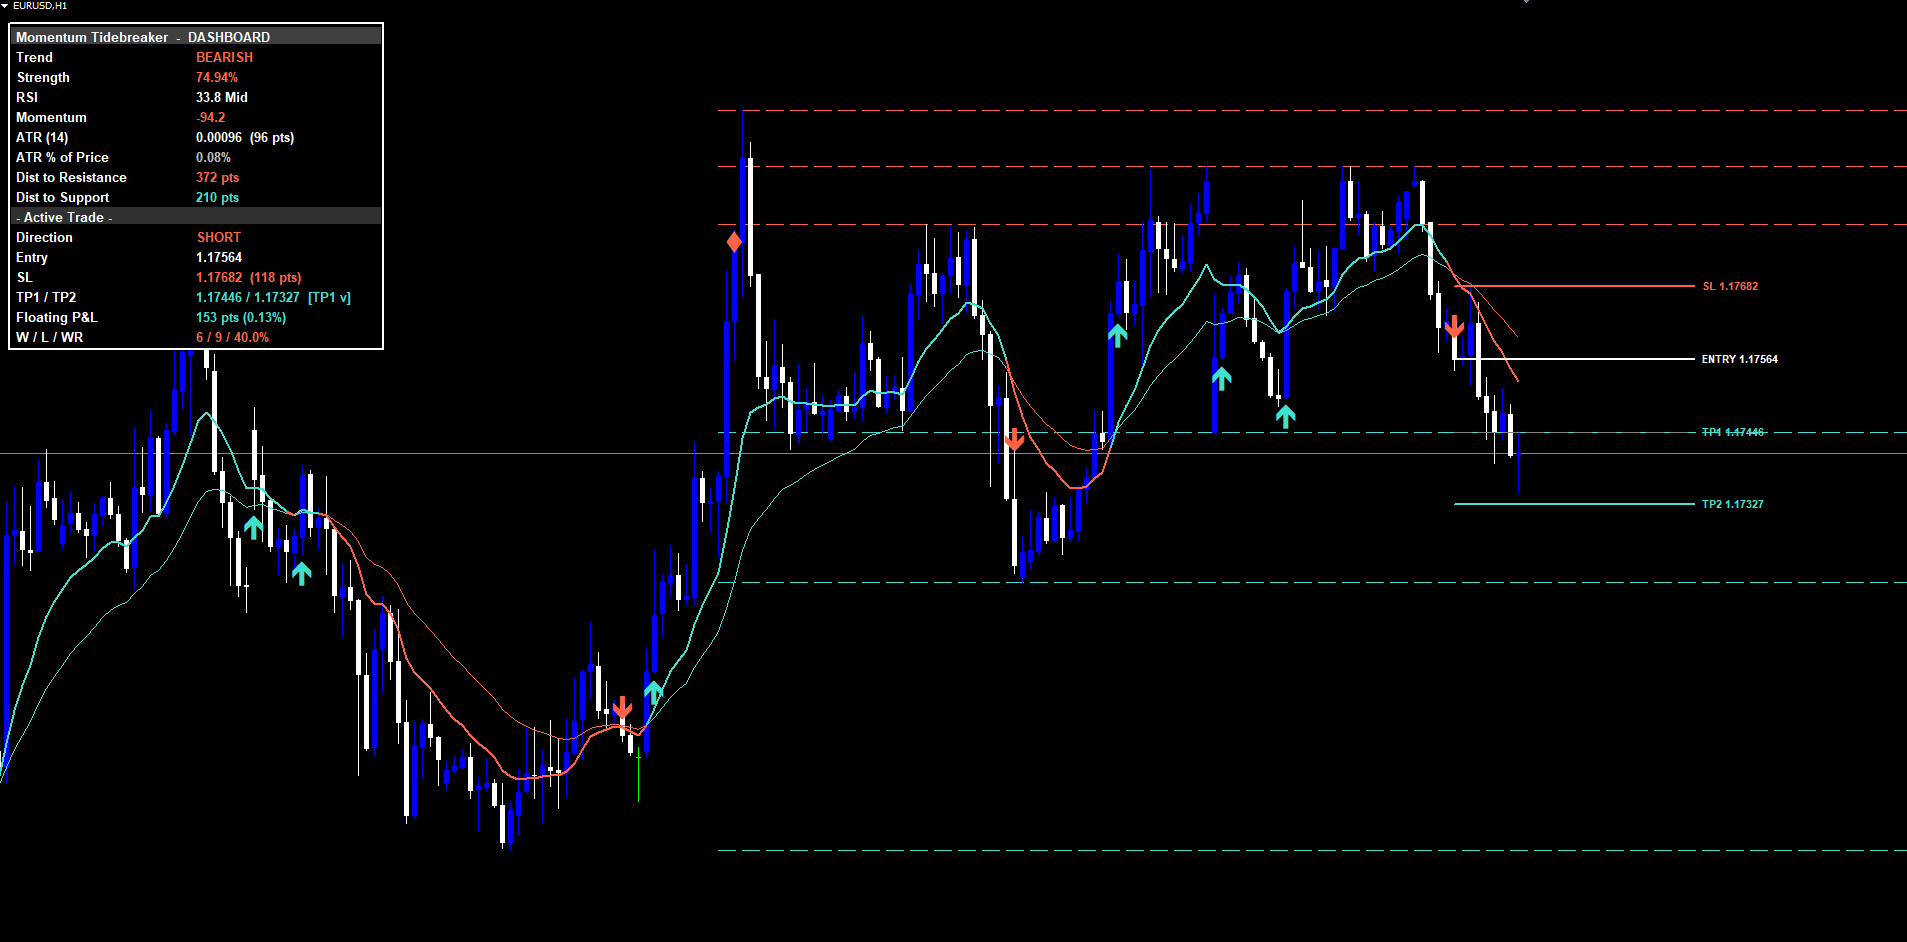
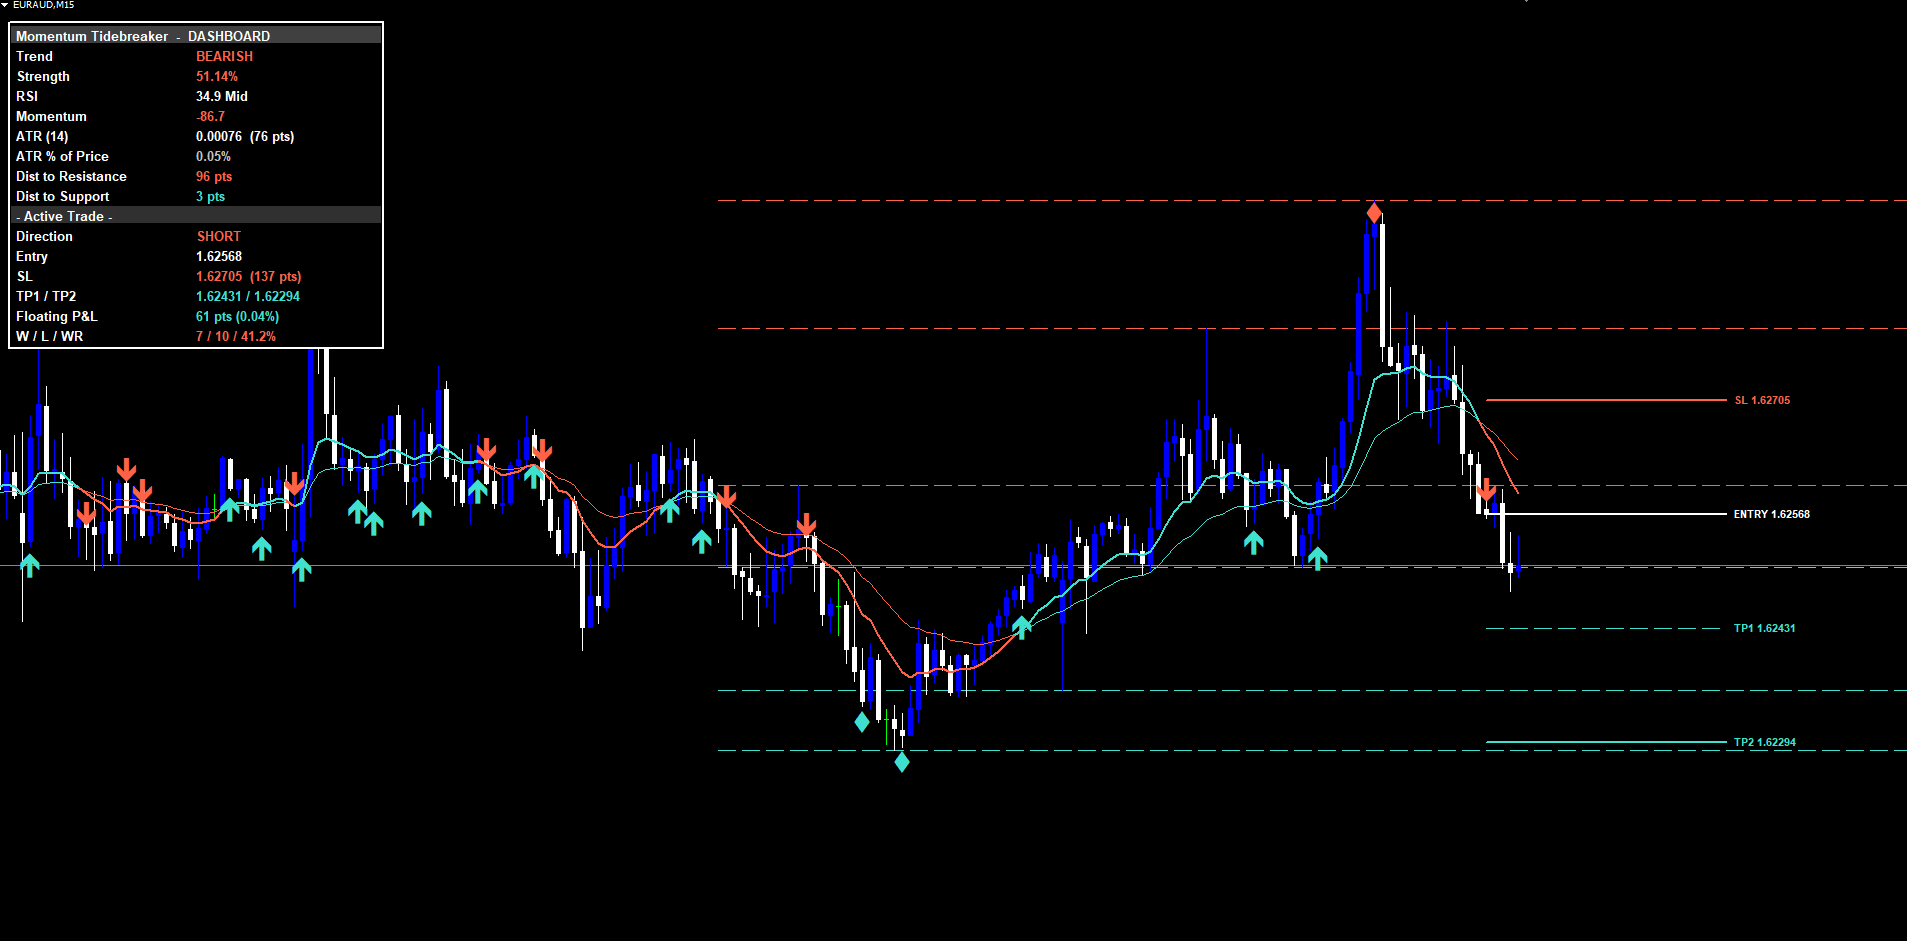
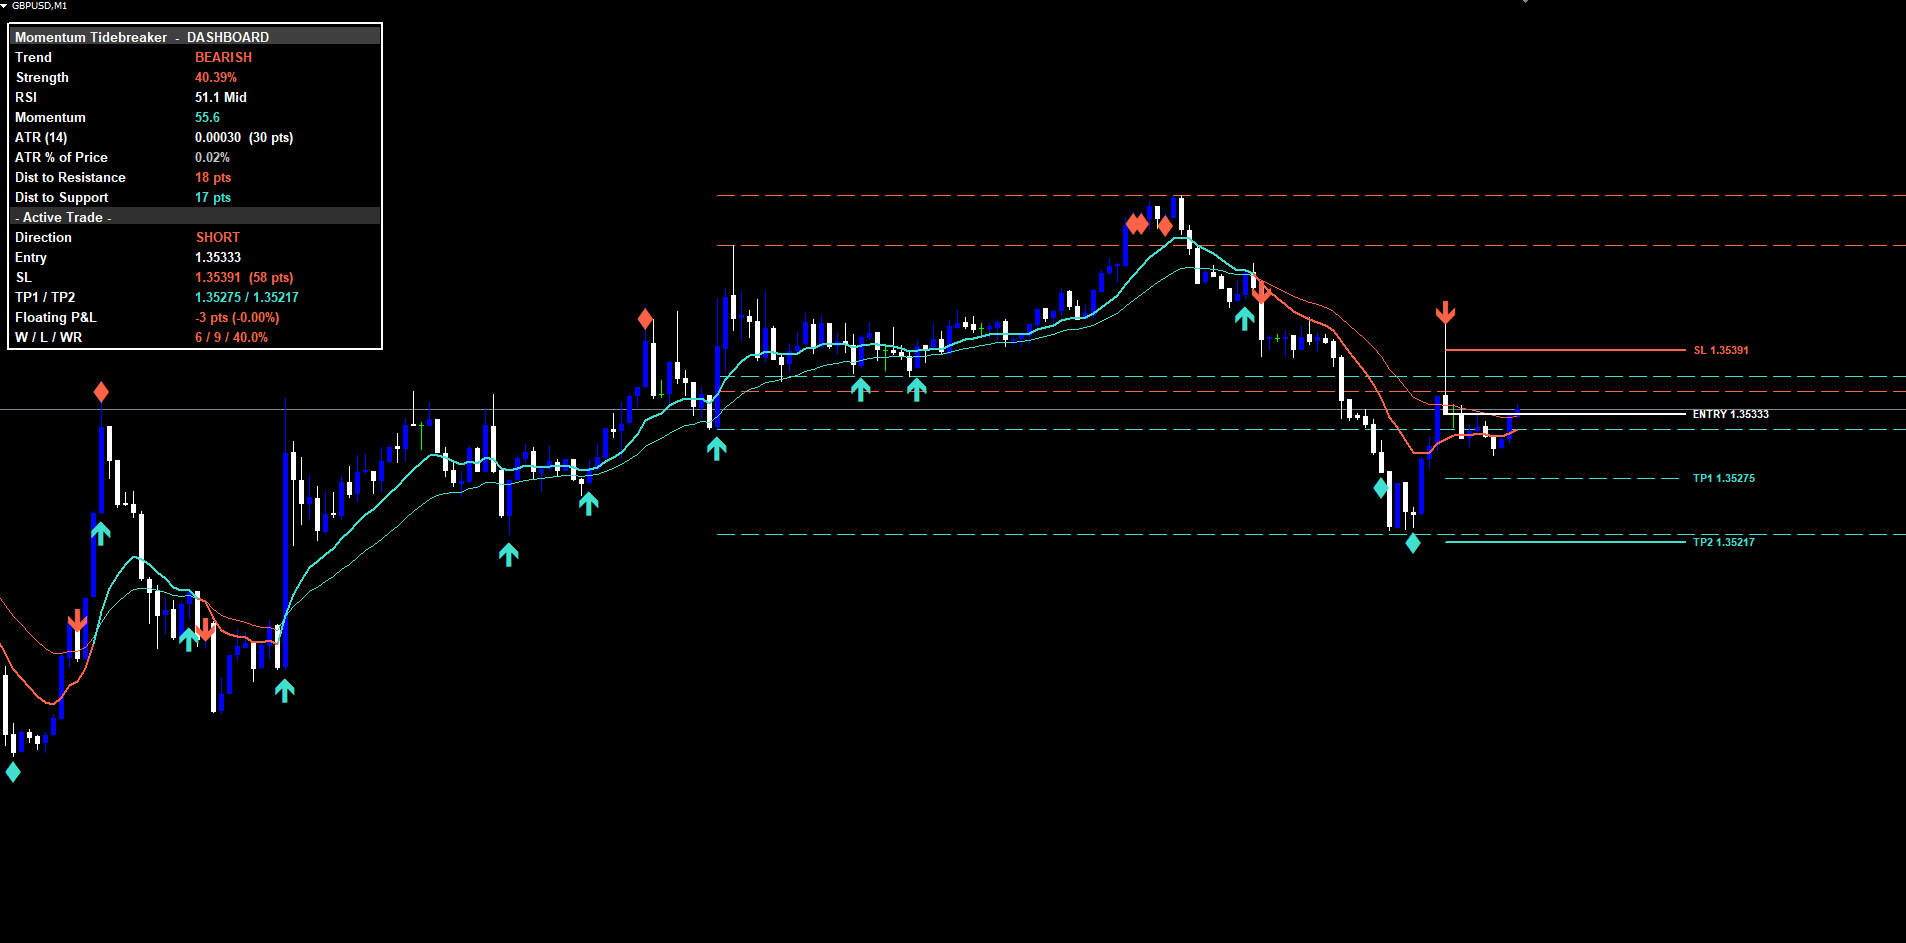
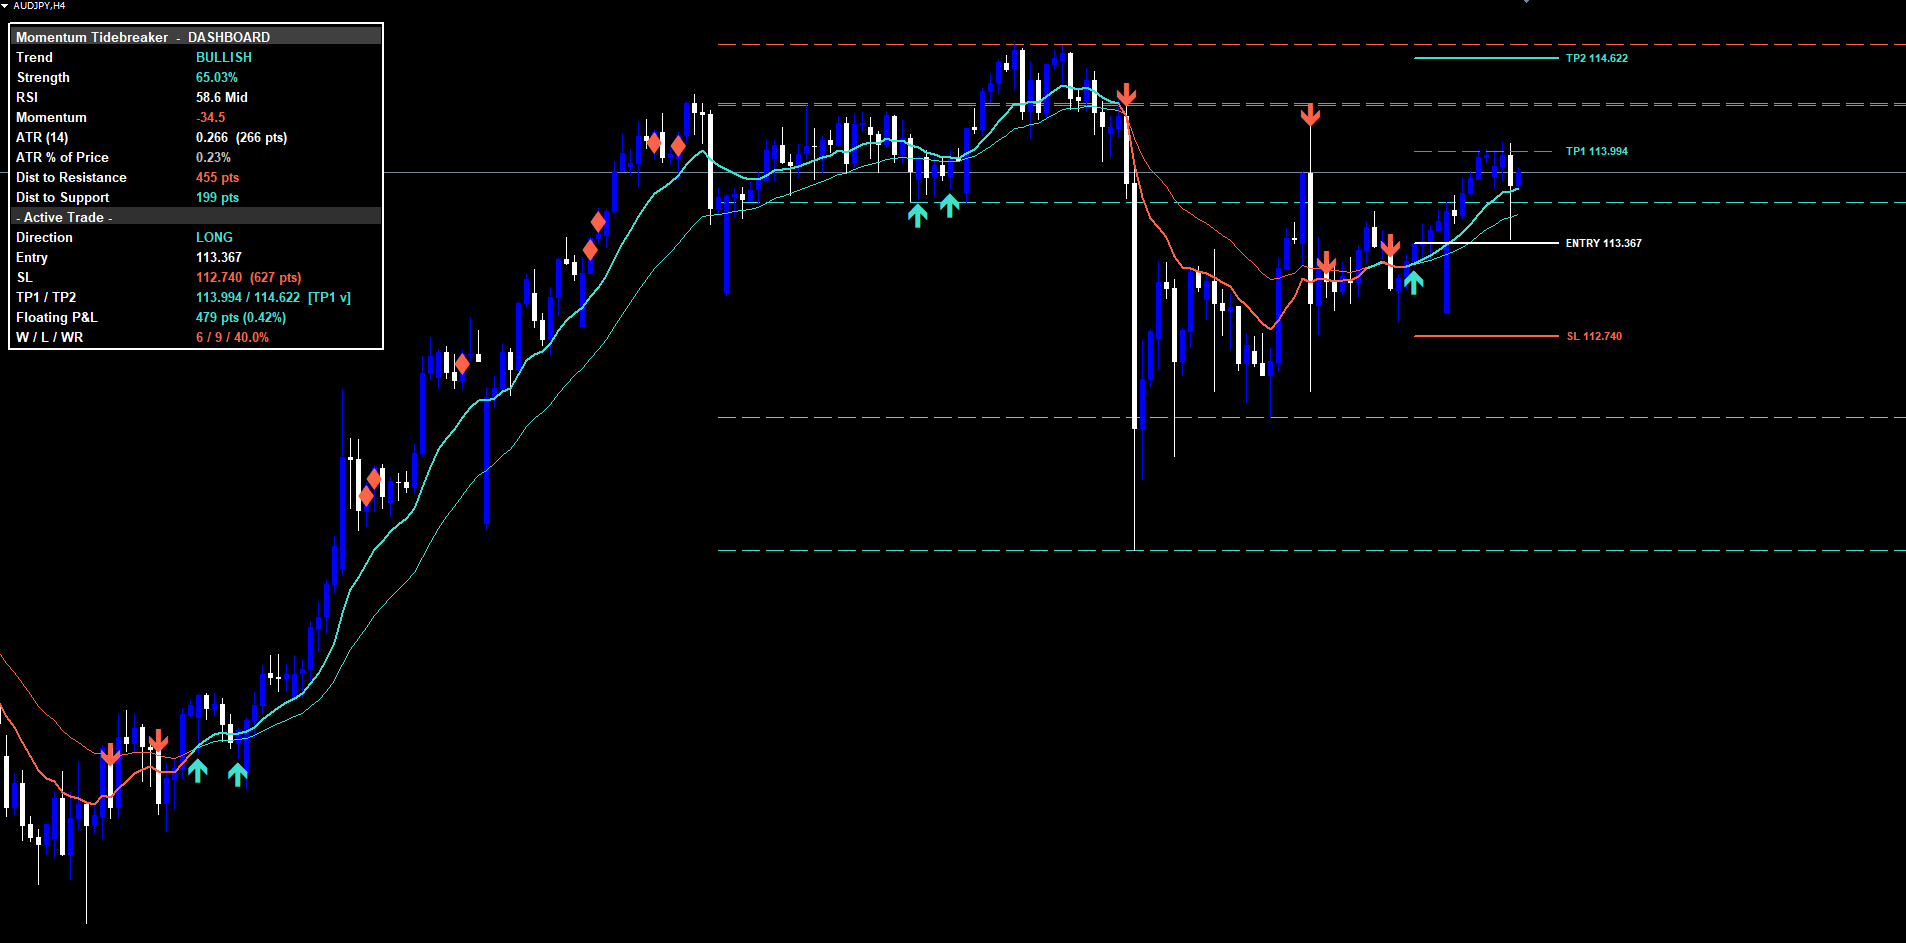
Momentum Tidebreaker addresses these limitations by combining three independent momentum signal classes into a single non-repainting decision engine. It evaluates each closed bar against three separate models -- an EMA crossover detector with RSI and momentum confluence, an RSI midline reclaim detector aligned with the EMA trend, and an RSI divergence detector at overbought/oversold extremes -- and fires only when at least one model produces a confirmed signal. When two of the three models agree on the same closed bar, the signal is upgraded to a Strong Signal and marked separately. Every signal automatically draws a four-line risk architecture on the chart (Entry, ATR-anchored Stop Loss, TP1 at exactly 1R, and TP2 at a configurable Risk:Reward ratio), and a 16-row dashboard tracks live floating P&L, partial-profit milestones, and a running Wins/Losses/Win-Rate counter.
The indicator is available for both MetaTrader 4 and MetaTrader 5 with identical signal logic and visual identity across both platforms.
Download the indicator:
- MetaTrader 5: Momentum Tidebreaker MT5
- MetaTrader 4: Momentum Tidebreaker MT4
This article explains the technical concepts behind each signal class, walks through the ATR-based risk architecture, describes the dashboard layout and alert configuration, and provides a complete parameter reference. The intent is to give traders the conceptual grounding to configure Momentum Tidebreaker for their own markets and timeframes, not just to list features.
What Momentum Confluence Actually Means
The phrase "confluence" gets used loosely in retail trading, often as a synonym for "I am more confident about this trade". A more useful definition is that confluence occurs when several statistically independent conditions all produce the same directional signal at the same point in time. Independence is the key word -- two indicators that are mathematically related (for example, the 14-period RSI and the 14-period Stochastic) do not produce confluence when they agree, because they are essentially measuring the same underlying quantity. Genuine confluence requires that each condition captures a different aspect of price behavior.
Momentum Tidebreaker treats three aspects of momentum as independent signal classes:
The first is directional commitment. When the fast moving average crosses the slow moving average, the indicator captures a structural change in short-term versus medium-term price action. The cross by itself is noisy, particularly in ranging conditions, but when combined with the requirement that RSI is on the matching side of 50 and momentum direction agrees, the false positive rate drops significantly.
The second is continuation after pullback. After a trend establishes, RSI typically dips back toward 50 during normal retracements, then recovers as the trend resumes. The exact moment that RSI crosses back over 50 in the direction of the prevailing EMA trend is a high-quality continuation entry, distinct from the initial crossover. A trader who waits only for the next EMA cross misses these entries entirely.
The third is reversal at exhaustion. When price reaches an overbought or oversold extreme on RSI, the next move is statistically more likely to be a mean reversion than a continuation. If momentum begins to diverge from price during this extreme reading, and the close subsequently crosses back over the fast EMA, the conditions are right for a reversal entry. This is distinct from both the crossover signal and the reclaim signal -- it fires at exactly the points where the other two models would either remain silent or actively block a trade.
By treating these as three independent classes rather than three filters of a single signal, Momentum Tidebreaker increases the count of valid entries without inflating the false positive rate. Each class fires on a different market structure. A trader using only crossover signals captures roughly the same statistical edge but with fewer opportunities. A trader using all three classes captures the same edge with substantially more entries per month per instrument.
Class 1: Trend Cross
The Trend Cross signal fires when four conditions hold simultaneously on a confirmed bar:
-
The fast EMA crosses the slow EMA. By default the fast EMA is 12-period and the slow EMA is 26-period -- the classical MACD-style configuration. Both EMAs are calculated on close price. A buy cross occurs when the fast EMA closes above the slow EMA on a bar where it had previously been below; a sell cross is the mirror image.
-
The 14-period RSI is on the matching side of 50. For buy signals, RSI must read above 50 on the signal bar. For sell signals, RSI must read below 50. This single condition eliminates the bulk of false crossovers that occur during sideways consolidation, where the EMAs cross briefly but momentum has not committed to the direction.
-
Momentum direction agrees (optional, controlled by InpRequireMomConfluence ). The momentum value is calculated as the 5-bar close change divided by the 10-period ATR, multiplied by 100. This produces a volatility-normalized rate-of-change metric. For buy signals, the momentum value must be positive; for sell signals, negative. When this filter is disabled, the Trend Cross signal can fire with momentum still pointing against the direction, which catches the very earliest part of a turn but allows more false signals.
-
The trend strength exceeds the threshold. Trend strength is calculated as the absolute distance between the fast and slow EMAs, divided by the 14-period ATR, multiplied by 100. The threshold (default 1.0) ensures that the crossover represents a meaningful separation rather than two EMAs grazing each other during low-volatility periods. The strength value is displayed live in the dashboard.
When all four conditions match on a confirmed bar, the indicator prints a triangle marker (BUY below the bar for longs, SELL above for shorts), draws the four-line risk architecture extending forward, fires the BUY/SELL alert, and updates the dashboard's Active Trade section.
Class 2: RSI Reclaim
The RSI Reclaim signal addresses continuation entries that the Trend Cross class misses by design.
Consider a typical bullish trend. The Trend Cross fires once when the fast EMA initially crosses the slow EMA. After that initial signal, RSI typically rises into the 60-70 range during the impulse leg, then pulls back toward 50 (or briefly below) during the correction phase. As the trend resumes, RSI crosses back over 50 from below. This is the moment the RSI Reclaim signal fires.
The conditions for an RSI Reclaim are:
-
RSI crosses 50 in the direction of the existing EMA trend. For buy signals, RSI must close above 50 on the signal bar after closing at or below 50 on the previous bar; the fast EMA must already be above the slow EMA. For sell signals, RSI crosses 50 from above while the fast EMA is below the slow EMA.
-
The close is on the trend side of the slow EMA. This second filter ensures that price has not simultaneously broken back through the structural moving average. An RSI cross that occurs while price is collapsing through the slow EMA is not a continuation -- it is typically a failure pattern.
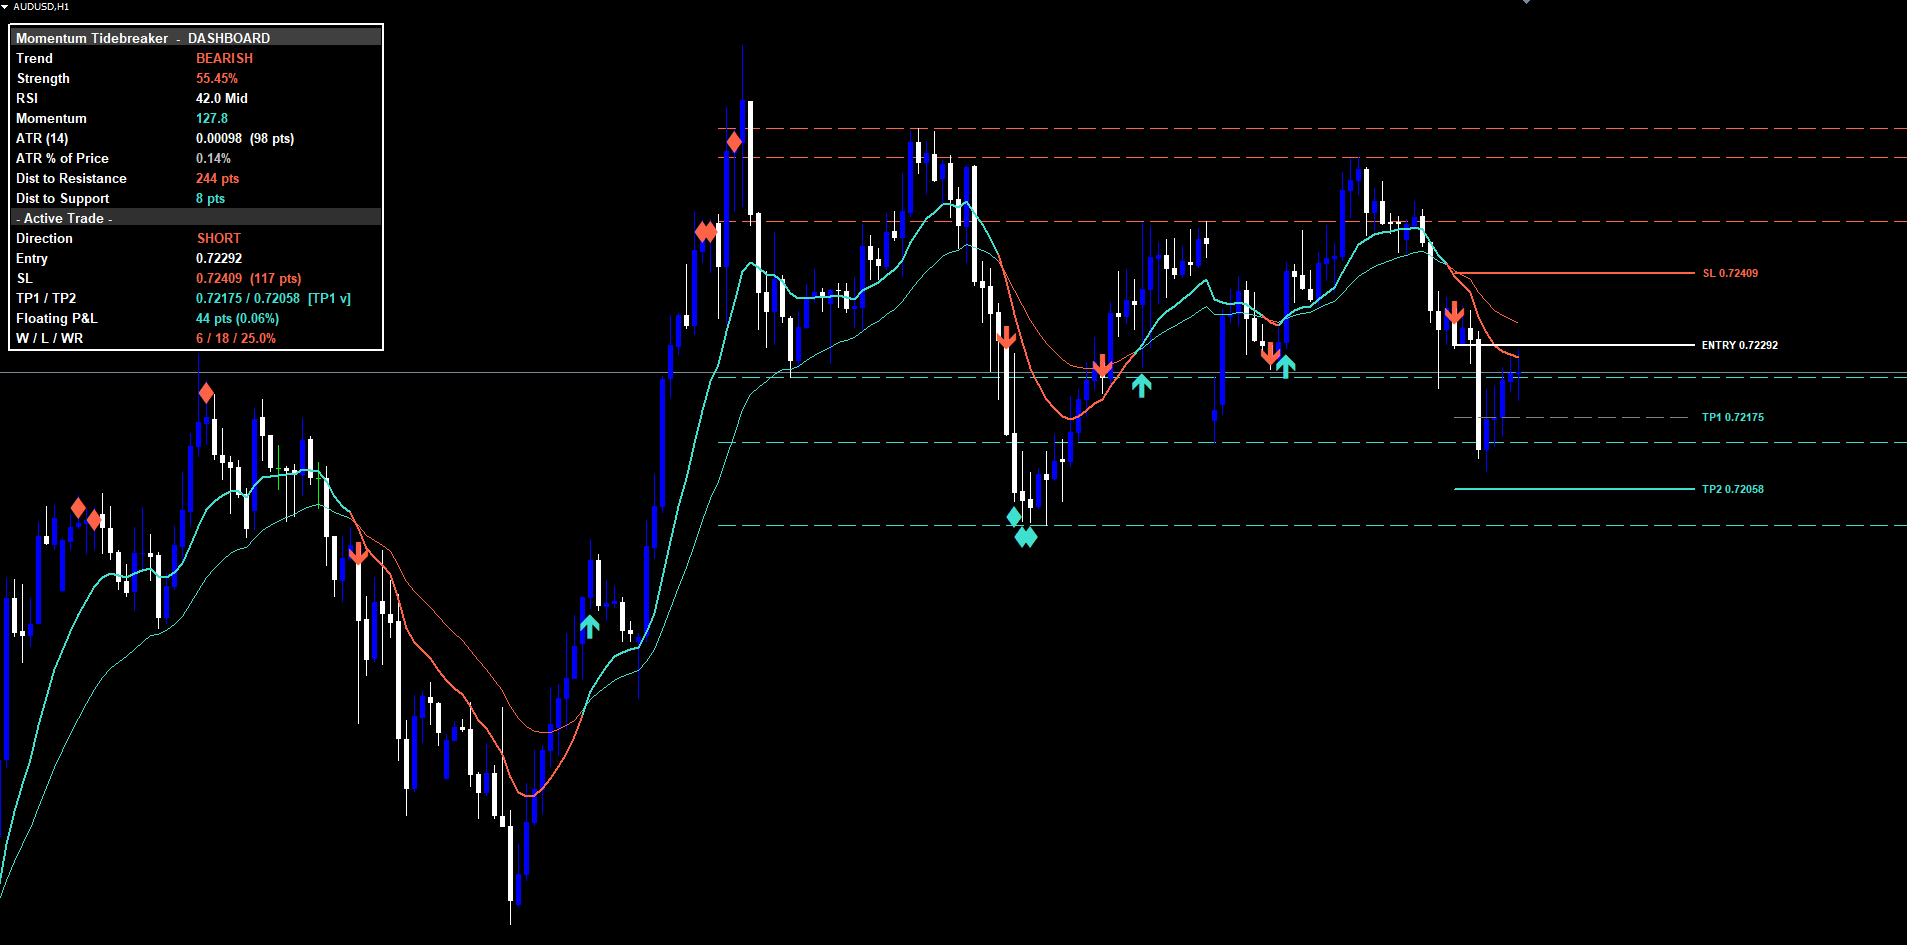
The RSI Reclaim class is particularly valuable on H1 and H4 timeframes for Forex pairs, where extended trends often produce multiple Reclaim opportunities between Trend Cross events. A trader who scales out at TP1 on the initial Trend Cross can use subsequent Reclaim signals to re-enter at controlled risk levels.
Class 3: Divergence
The Divergence signal fires at potential reversal points where the other two classes would remain silent or actively reject the trade.
A bullish divergence occurs when price makes a lower low while momentum makes a higher low. A bearish divergence is the mirror: price makes a higher high while momentum makes a lower high. By itself, divergence is a notoriously imprecise signal -- it can persist for many bars before any reversal materializes, and many divergences do not result in reversals at all. Momentum Tidebreaker addresses this by requiring two additional conditions before firing the Divergence signal:
-
RSI must be in the overbought or oversold zone. A bullish divergence is only valid when RSI is below the oversold threshold (default 30). A bearish divergence is only valid when RSI is above the overbought threshold (default 70). This zone requirement filters out random momentum oscillations in mid-range conditions, focusing on divergences that occur at statistically meaningful extremes.
-
The close must cross back across the fast EMA in the divergence direction. A bullish divergence at oversold is confirmed only when the close on the signal bar is above the fast EMA. A bearish divergence at overbought is confirmed only when the close is below the fast EMA. This third filter waits for the actual reversal to begin rather than firing as soon as the divergence pattern appears.
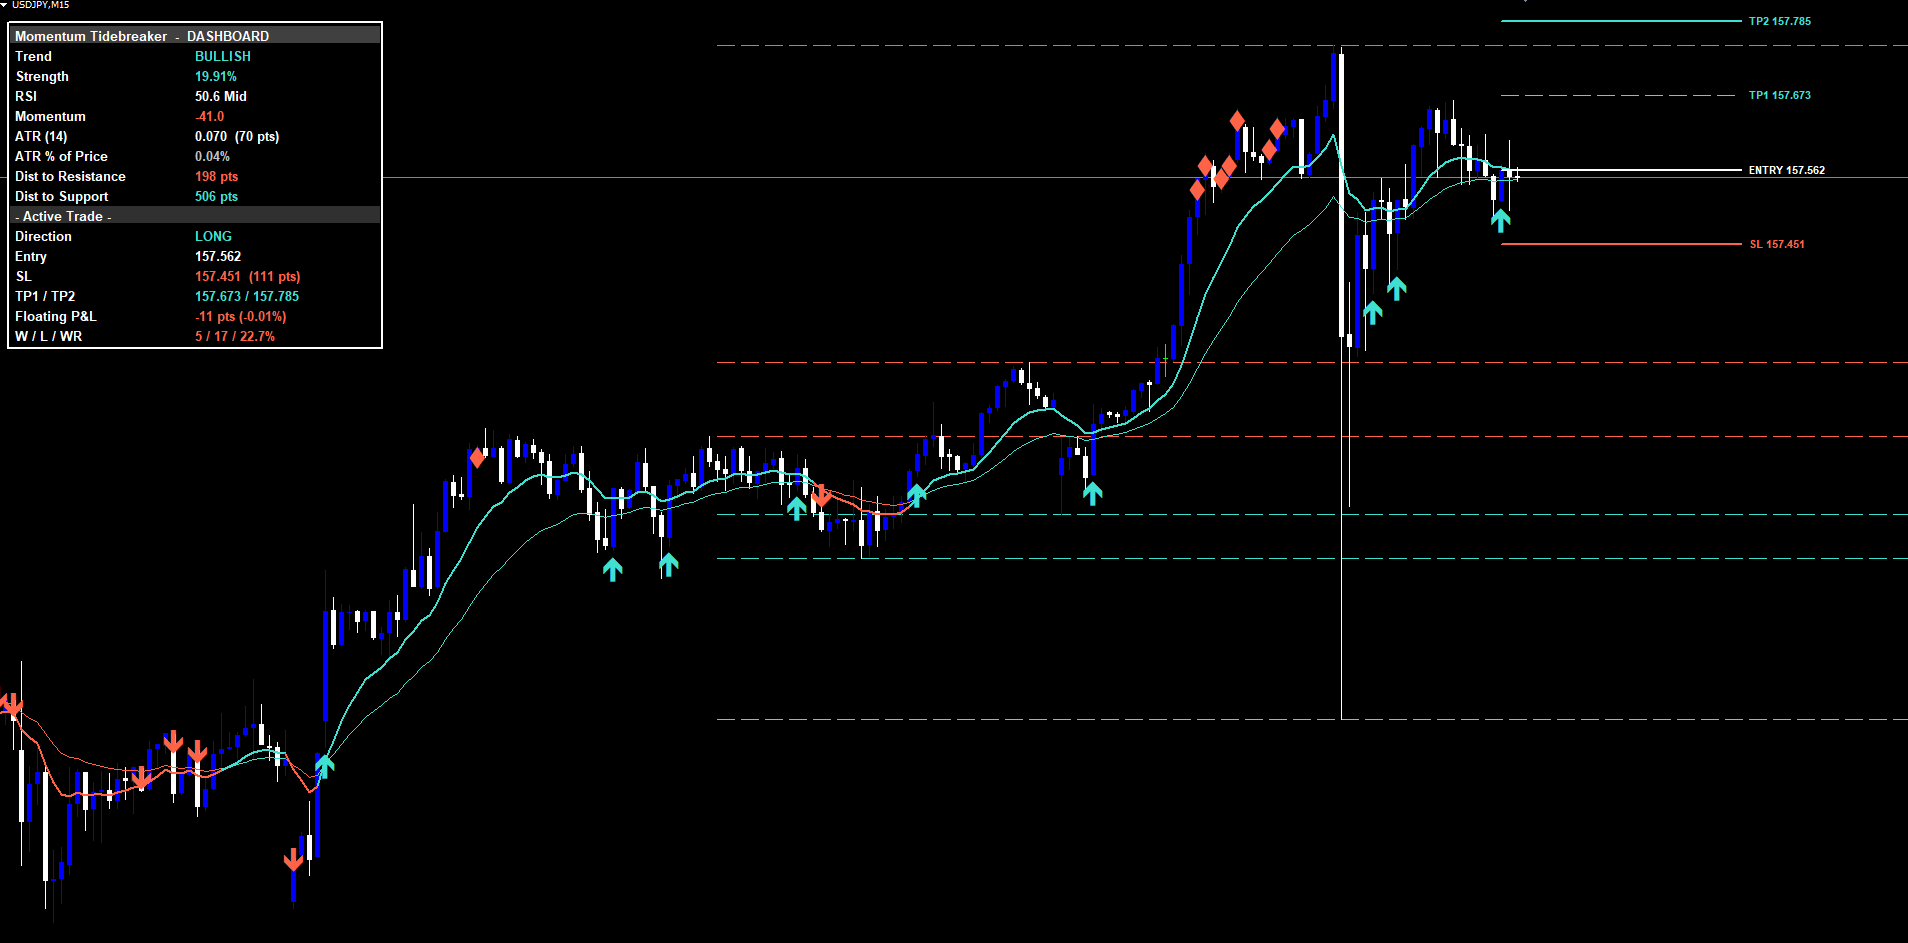
The Divergence class fires less frequently than the other two but catches reversal entries that crossover-based indicators miss entirely. On lower timeframes such as M15 and M30, Divergence signals tend to coincide with intraday reversal points; on H4 and Daily, they tend to mark medium-term turning points.
Strong Signals: When Two Tides Align
The three signal classes are designed to fire on different market structures, but occasionally two of them produce the same directional signal on the same closed bar. When the Trend Cross class and the Divergence class both fire on the same bar, the indicator records a Strong Signal.
This confluence is rare and statistically meaningful. The Trend Cross alone requires structural EMA crossover, RSI direction, and trend strength. The Divergence alone requires RSI at an extreme plus a close back across the fast EMA. The probability of both classes firing simultaneously on the same bar by random coincidence is low. When they do agree, the trader is seeing both a structural breakout (the cross) and a reversal-from-extreme (the divergence) at the same instant -- which typically corresponds to a high-conviction inflection point.
Strong Signals are marked with an additional amber star above the BUY triangle (or below the SELL triangle), and a separate alert condition (STRONG BUY or STRONG SELL) fires alongside the standard BUY/SELL alert. The dashboard's Active Trade direction cell displays the standard LONG/SHORT, but the trader has an explicit confirmation that the signal had Strong Signal status when it fired.
The Strong Signal designation does not change the risk architecture. The TP1, TP2, and SL levels are calculated identically. The intent is to give the trader an explicit, additional confidence signal, not to claim that Strong Signals always win.
Non-Repainting Architecture
Repainting is one of the most common problems with momentum indicators and one of the most misunderstood. An indicator that evaluates conditions on the current, still-forming bar can show a signal that disappears when the bar closes at a different price. During the bar's formation, an EMA cross might briefly occur, causing the indicator to display a buy arrow. If price then retracts before bar close, the arrow vanishes. This creates a false impression of accuracy in backtesting: every signal shown on the historical chart appears perfectly timed, because all the failed mid-bar signals were silently removed.
Momentum Tidebreaker eliminates repainting through a strict evaluation rule applied to all three signal classes. The Pine Script version gates every signal on barstate.isconfirmed , which is true only on the final tick of a bar. The MT4 and MT5 versions only evaluate the signal logic on shift==1 (the just-closed bar) when the bar's timestamp differs from the previously processed timestamp. In both cases, signals are evaluated exactly once per closed bar, and once printed they are permanent on the chart.
This design has one practical consequence: signals appear at the close of the trigger bar, not at the moment the condition first becomes true intrabar. A trader using Momentum Tidebreaker will see the BUY/SELL triangle on the bar that just closed, with the entry price corresponding to that close. A trader expecting signals to fire the moment price crosses a level will find this slightly slower, but they receive in exchange a signal that will never disappear during live trading.
A second mechanism prevents the same direction from firing more than once per bar. The indicator stores the bar time of the last buy and the last sell, and rejects subsequent signals on the same bar even if multiple signal classes match. This prevents triangle clustering during volatile bars where multiple classes might briefly satisfy their conditions.
A third mechanism, the history scan, runs when the indicator first loads on a chart. The scan walks backward from the most recent closed bar to a configurable lookback distance (default 500 bars), replaying every confirmed bar to detect historical signals, simulate TP/SL fills, and populate the Wins/Losses/Win-Rate counter. The result is that a freshly attached chart shows the most recent active trade (if any) plus a historical win-rate immediately, rather than waiting for new signals to accumulate.
ATR-Based Risk Architecture
Every signal printed by Momentum Tidebreaker includes a complete risk management framework computed from the Average True Range. ATR measures the average range between the high and low of each bar over a given period, factoring in overnight gaps. It is the standard adaptive volatility metric in technical analysis, and using it for stop loss and take profit distances means that the risk parameters automatically adjust to each instrument's price scale and current market regime.
The stop loss is placed at the entry price plus or minus 1.5 times the 14-period ATR ( InpSLPadding = 1.5, InpAtrLenRisk = 14). For a buy signal, the stop is below the entry; for a sell signal, it is above. On EURUSD H1 with an ATR of 30 pips, the stop sits 45 pips from entry. On a more volatile instrument with an ATR of 100 pips, the stop sits 150 pips from entry. This adaptive scaling is what allows the same parameters to work across forex majors, gold, crude oil, indices, and crypto without manual retuning.
TP1 is placed at exactly the same distance as the stop loss, in the profit direction. This is the 1R level -- a take profit equal to the risk. Hitting TP1 represents a one-to-one risk-reward outcome. In Momentum Tidebreaker, hitting TP1 does not close the trade. Instead, the TP1 line on the chart dims, the dashboard marks a partial-profit flag in the TP1/TP2 row, and the trade continues running toward TP2.
TP2 is placed at the configurable Risk:Reward ratio ( InpRRRatio , default 2.0) times the stop distance, in the profit direction. With the default settings, TP2 is twice the distance of the stop, representing a 1:2 risk-reward outcome. Hitting TP2 closes the trade: the Wins counter increments by one, all four lines (Entry, SL, TP1, TP2) are deleted from the chart, the dashboard returns to a flat state, and the TP2 Hit alert fires.
If the stop loss is hit before TP2, the trade closes as a loss: the Losses counter increments, all four lines are deleted, and the SL Hit alert fires. The Win-Rate cell in the dashboard updates to reflect the new total.
This three-state risk lifecycle (open / partial profit / closed) is tracked entirely by the indicator. No manual position management is required, and no external trade journal is needed to maintain the win-rate calculation. The dashboard reflects the actual outcome of every signal the indicator has produced on the current chart.
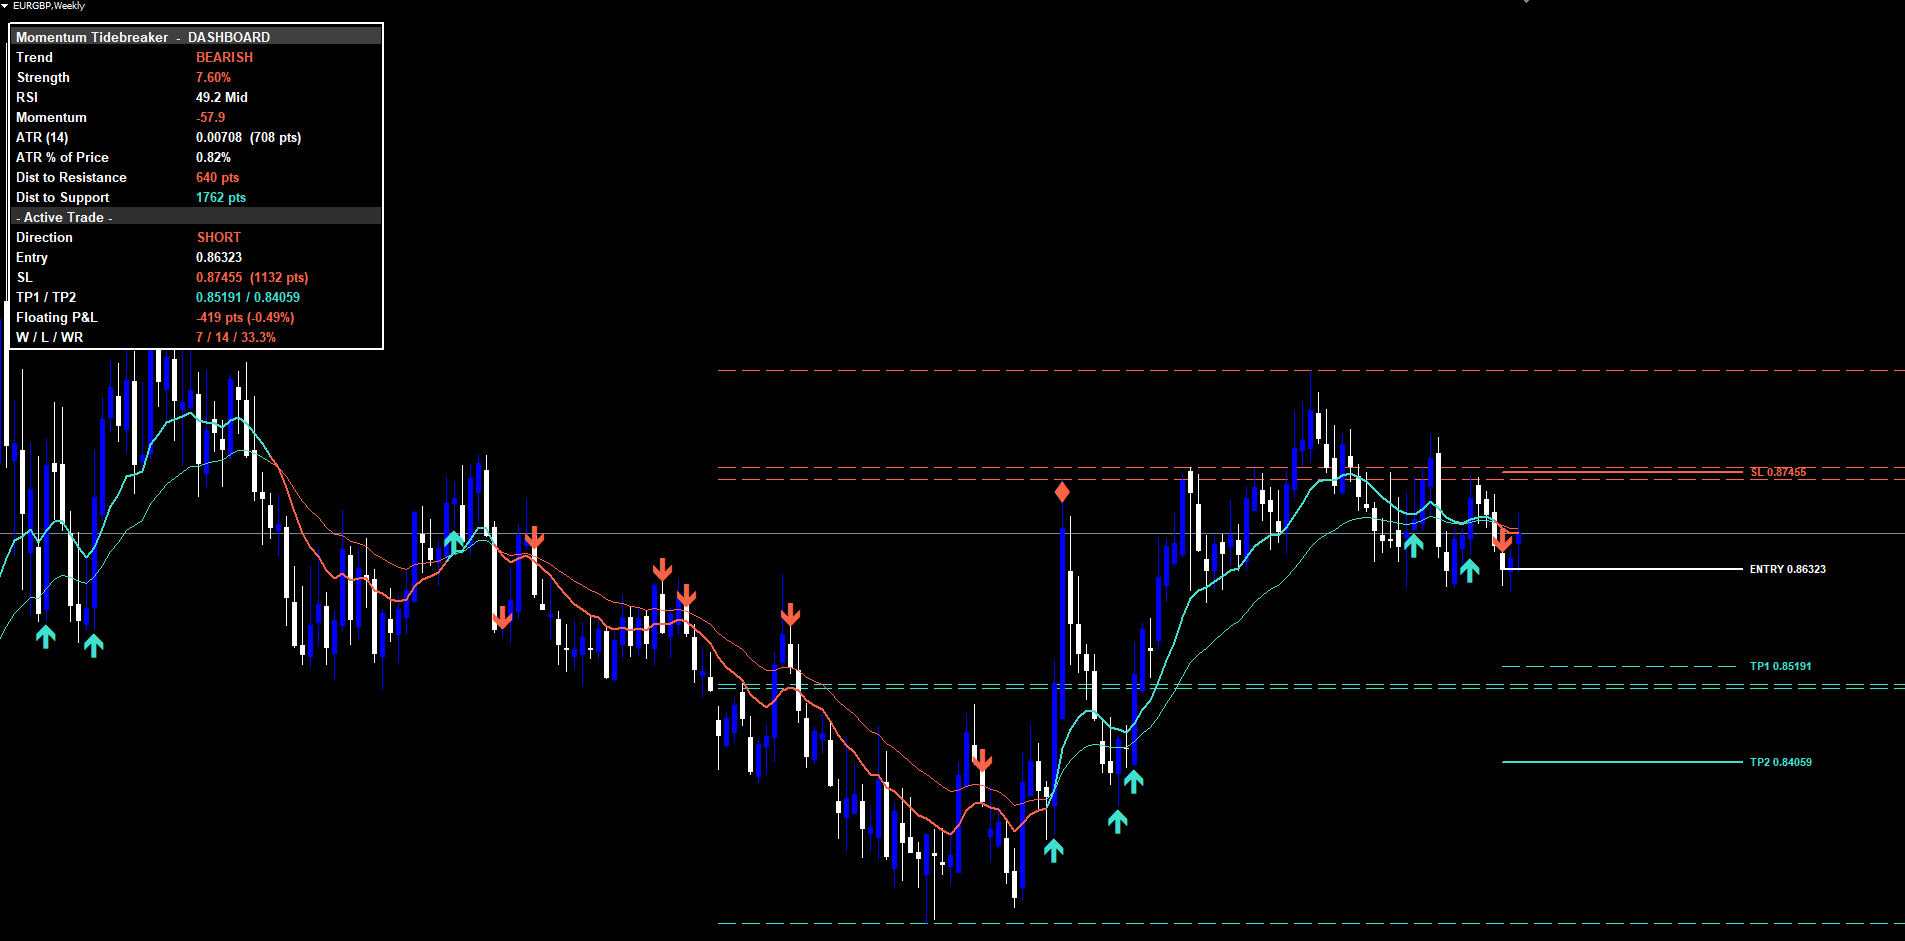
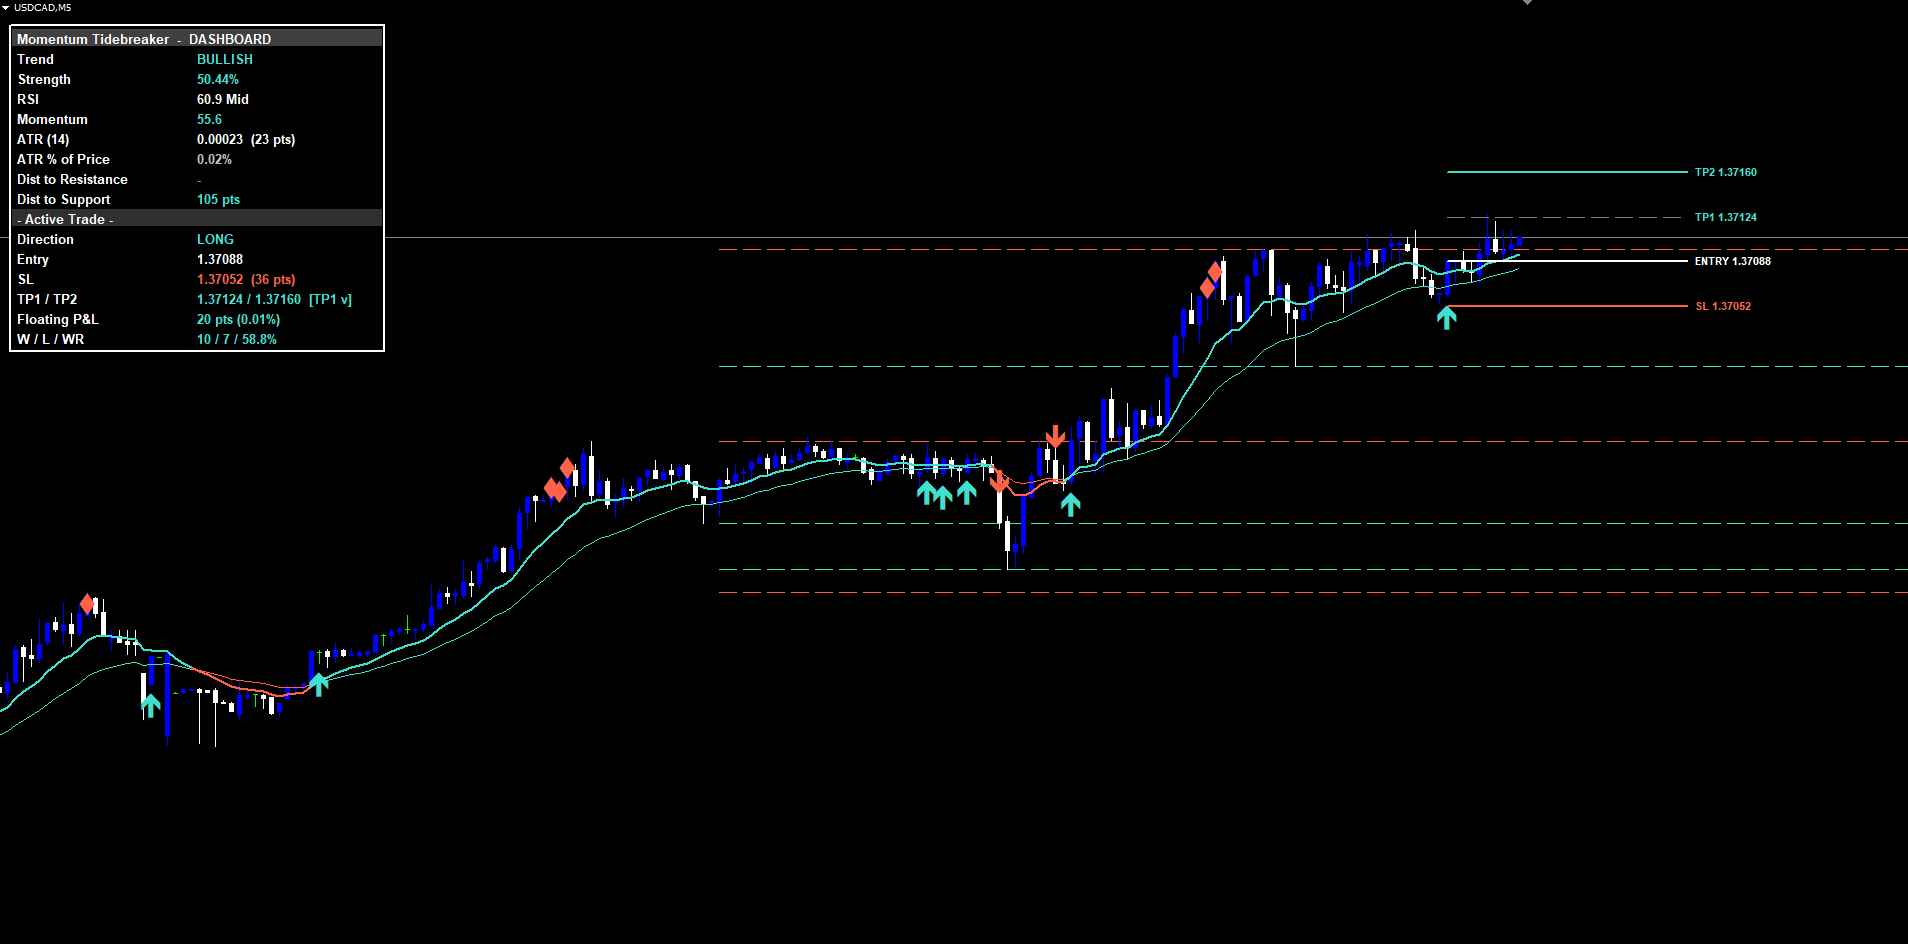
The 16-Row Dashboard
The dashboard is a persistent panel rendered in any of the four chart corners (controlled by InpDashCorner , an enum input with options Top Right, Top Left, Bottom Right, Bottom Left). It uses an absolute pixel positioning system anchored to the upper-left corner of the chart, with x and y coordinates computed from the chart's pixel dimensions to simulate any corner without losing visibility on narrow charts.
The 16 rows are organized into three logical sections plus a header.
Header row (row 0): spans the full panel width and displays "Momentum Tidebreaker - DASHBOARD" on a lighter grey background. The single-cell layout prevents the bold title text from colliding with a value cell.
Market Snapshot section (rows 1 through 8):
- Row 1, Trend: BULLISH / BEARISH / FLAT, colored by direction (aqua green for bullish, coral red for bearish, silver for flat).
- Row 2, Strength: the EMA distance divided by ATR, expressed as a percentage. Colored to match the trend direction when above the threshold, neutral otherwise.
- Row 3, RSI: current 14-period RSI reading with an OB/OS/Mid state marker. Colored red when overbought, green when oversold, white in the middle zone.
- Row 4, Momentum: 5-bar close change normalized by ATR(10), times 100. Colored green when positive, red when negative.
- Row 5, ATR (14): absolute ATR value in price units plus the equivalent point count.
- Row 6, ATR % of Price: the volatility regime gauge. Above 1.0% indicates elevated volatility; below 0.3% indicates a quiet market.
- Row 7, Dist to Resistance: distance in points to the nearest pivot-high that sits above the current price.
- Row 8, Dist to Support: distance in points to the nearest pivot-low below current price.
Active Trade section (rows 9 through 15):
- Row 9: section divider "- Active Trade -" on a darker grey background.
- Row 10, Direction: LONG / SHORT / -- with color matching the direction.
- Row 11, Entry: the entry price of the active trade, or "-" if flat.
- Row 12, SL: the stop loss price plus the SL distance in points.
- Row 13, TP1 / TP2: both target prices, with a partial-profit flag appended after TP1 has been hit.
- Row 14, Floating P&L: live unrealized P&L in points and percent. Colored green when positive, red when negative.
- Row 15, W / L / WR: wins, losses, and win-rate percentage. The WR cell flips green when the rate is at or above 50%, red below.
The dashboard updates on a 1-second timer in MT4/MT5 (matching the standard CSBB pattern for pixel-anchored widgets) and on every closed bar in Pine. On chart resize or symbol switch, the panel repositions automatically.
The Alert System
Momentum Tidebreaker fires nine distinct alert conditions, each covering a critical moment in the lifecycle of a signal or active trade:
- BUY -- any of the three signal classes produces a long signal on a confirmed bar.
- SELL -- any of the three signal classes produces a short signal on a confirmed bar.
- STRONG BUY -- Trend Cross and Divergence both fire long on the same closed bar.
- STRONG SELL -- Trend Cross and Divergence both fire short on the same closed bar.
- TP1 Hit -- price reaches the first take profit (1R distance) on the active trade.
- TP2 Hit -- price reaches the second take profit (configurable RR) and the trade closes in profit.
- SL Hit -- price reaches the stop loss and the trade closes at a loss.
- Bullish Divergence -- RSI bullish divergence detected at oversold (without requiring the EMA cross-back filter, so it fires whenever the underlying pattern appears).
- Bearish Divergence -- RSI bearish divergence at overbought, same notes.
Each alert message includes the symbol, the timeframe, the signal class label (for entry alerts), and (for entry alerts) the entry price plus the SL/TP1/TP2 levels. Trade-management alerts (TP1/TP2/SL Hit) include the original entry price for reference.
Four delivery channels can be configured independently per channel:
| Channel | Default | Parameter |
|---|---|---|
| Popup (in-terminal dialog) | Enabled | InpAlertPopup |
| Sound (alert.wav by default) | Enabled | InpAlertSound |
| Push notification (mobile MT4/MT5 app) | Disabled | InpAlertPush |
| Disabled | InpAlertEmail |
All alerts are guarded by a once-per-bar mechanism. Each of the nine conditions stores the bar time of its last fire. If the same condition triggers again on the same bar, the alert is suppressed. This prevents duplicate notifications during volatile bars where price might briefly cross and recross a TP level.
The master switch ( InpEnableAlerts ) must be active for any alerts to fire. When disabled, all nine conditions are suppressed regardless of individual channel settings.
Practical Trading Workflow
Understanding each component is necessary but not sufficient for consistent results. The following six-step workflow describes how to use Momentum Tidebreaker in daily trading.
Step 1: Add the indicator to a chart. Open MetaTrader 4 or MetaTrader 5. Find Momentum Tidebreaker in the Navigator under Indicators > Market. Drag it onto the chart. The default settings work on most Forex pairs, gold, indices, and crypto. Start with H1 or H4 to see clean signal density.
Step 2: Decide which signal classes to enable. All three classes are enabled by default. Some traders prefer a more conservative configuration with only Trend Cross enabled (fewer but more structural signals). Others run all three but disable the optional momentum confluence filter on Trend Cross ( InpRequireMomConfluence = false) for earlier entries at the cost of more false positives. Choose your configuration once for a given market and timeframe.
Step 3: Pick a dashboard corner. Use InpDashCorner to slot the panel into whichever corner does not overlap with your chart price action. Top Right and Bottom Left are most common; the exact choice depends on whether your charts have order entry panels, sub-windows, or other overlays.
Step 4: Wait for a signal. Do not anticipate signals before bar close. The indicator deliberately waits for confirmation. When a triangle appears on the chart with the four-line risk architecture, check the dashboard: the Direction row should now read LONG or SHORT, the Entry / SL / TP1 / TP2 rows should populate, and the Floating P&L row should start ticking.
Step 5: Manage the trade through the dashboard. As price moves, watch the Floating P&L cell. If TP1 is hit, the TP1 line dims and the dashboard appends a partial-profit flag. Many traders close a portion of their position at this point and move their broker-level stop loss to the entry price, then let the remainder run to TP2. If you are using the indicator purely for signal generation and managing positions manually, the dashboard's TP/SL prices give you exact levels to use in your broker's order ticket.
Step 6: Track win-rate over time. The W/L/WR row updates after every closed trade. A growing rate above 50% on the configured settings suggests the indicator is performing well on the current symbol and timeframe. A persistently low rate suggests either a parameter mismatch with the current regime or that the indicator's edge is muted on this particular instrument. Most traders find that the default settings perform well on majors, gold, and indices, while crypto pairs benefit from a higher InpRRRatio (e.g., 2.5 or 3.0) to capture the typically wider moves.
Timeframe Considerations
The indicator adapts to any timeframe, but different timeframes produce different signal characteristics.
On lower timeframes (M5, M15, M30), signals are more frequent and individual TP/SL distances are smaller in absolute terms (though larger in ATR-multiples). These timeframes suit short-duration intraday trades or scalping setups. Be aware that on the lowest timeframes (M1, M5), the 14-period ATR window may produce noisy stop distances; many traders increase InpAtrLenRisk to 21 or 28 on these timeframes for smoother SL placement.
On medium timeframes (H1, H4), signal frequency is moderate, individual setups develop over hours, and the four-line risk architecture occupies a comfortable portion of the chart. This is the recommended range for most swing traders using Momentum Tidebreaker.
On higher timeframes (D1, W1), signals are infrequent but carry substantial weight. The W/L tracker rebuilds slowly on these timeframes because TP1/TP2 hits or SL hits take days to materialize.
Multi-Chart Setup
Because the indicator operates independently on each chart, traders can run it simultaneously on many symbols and timeframes. Each instance maintains its own active trade, history scan, and W/L counter. Combined with mobile push notifications ( InpAlertPush = true), this enables monitoring 10+ instruments without manually flipping between charts. A common practice is to apply the indicator to a watchlist of majors on H1, push notifications enabled, with the desktop terminal showing whichever chart has the most recent active trade.
Parameter Reference
All parameters are listed below, grouped by function. Default values match the source exactly.
Trend
| Parameter | Default | Description |
|---|---|---|
| InpEmaFastLen | 12 | Fast EMA length |
| InpEmaSlowLen | 26 | Slow EMA length |
| InpTrendStrengthLen | 14 | ATR period for trend strength calculation |
Support and Resistance
| Parameter | Default | Description |
|---|---|---|
| InpPivotLength | 10 | Bars on each side for pivot confirmation |
| InpMaxLevels | 3 | Maximum S/R levels stored and displayed (1-5) |
| InpShowSRLevels | true | Draw S/R lines on the chart |
Momentum
| Parameter | Default | Description |
|---|---|---|
| InpRsiLength | 14 | RSI calculation period |
| InpOversoldLevel | 30 | RSI oversold threshold |
| InpOverboughtLevel | 70 | RSI overbought threshold |
Signals
| Parameter | Default | Description |
|---|---|---|
| InpEnableTrendCross | true | Enable the Trend Cross signal class |
| InpEnableRSIReclaim | true | Enable the RSI Reclaim signal class |
| InpEnableDivergence | true | Enable the Divergence signal class |
| InpRequireMomConfluence | true | Require momentum direction match on Trend Cross |
Risk Management
| Parameter | Default | Description |
|---|---|---|
| InpShowSLTP | true | Show TP/SL lines on the chart |
| InpAtrLenRisk | 14 | ATR length used for SL distance |
| InpSLPadding | 1.5 | Stop loss distance as ATR multiplier |
| InpRRRatio | 2.0 | TP2 Risk:Reward ratio |
| InpLineExtend | 30 | TP/SL line extension in bars |
Visual
| Parameter | Default | Description |
|---|---|---|
| InpBullColor | clrTurquoise | Bullish elements color |
| InpBearColor | clrTomato | Bearish elements color |
| InpNeutralColor | clrSilver | Flat / inactive color |
| InpSignalArrowSize | 3 | Triangle marker width |
Dashboard
| Parameter | Default | Description |
|---|---|---|
| InpShowDashboard | true | Show the dashboard panel |
| InpDashCorner | DASH_TOP_RIGHT | Dashboard corner (4 options) |
| InpDashFontSize | 10 | Dashboard font size |
| InpDashHOffset | 10 | Horizontal offset from chosen corner (px) |
| InpDashVOffset | 24 | Vertical offset from chosen corner (px) |
Alerts
| Parameter | Default | Description |
|---|---|---|
| InpEnableAlerts | true | Master alert switch |
| InpAlertPopup | true | In-terminal popup dialog |
| InpAlertSound | true | Play sound file on alert |
| InpAlertPush | false | Mobile push notification |
| InpAlertEmail | false | Email alert |
| InpSoundFile | alert.wav | Sound file to play |
History
| Parameter | Default | Description |
|---|---|---|
| InpHistoryScanBars | 500 | Bars to scan backwards on chart load |
Recommended Configuration Profiles
Conservative (fewer signals, higher quality): Enable only InpEnableTrendCross and InpEnableDivergence . Leave InpRequireMomConfluence = true. Increase InpSLPadding to 2.0 for wider stops. Increase InpRRRatio to 2.5 for asymmetric profit targets. Best for D1 swing trading.
Default (balanced): All defaults. Three signal classes enabled, momentum confluence required, SL at 1.5 ATR, TP2 at 2.0R. Best for H1 and H4 on Forex majors, gold, and indices.
Aggressive (more signals, broader capture): Set InpRequireMomConfluence = false to allow early Trend Cross entries. Reduce InpSLPadding to 1.0 for tighter stops. Reduce InpRRRatio to 1.5 for quicker profits. Best for M15 and M30 scalping. Expect a lower win-rate but more opportunities per session.
Installation
Momentum Tidebreaker is distributed through the MQL5.com Market and installs automatically after purchase.
- Purchase the indicator from the MQL5.com Market product page.
- The indicator downloads and installs automatically into MetaTrader.
- Open the Navigator panel (Ctrl+N) and expand the Indicators section.
- Find Momentum Tidebreaker under Indicators > Market.
- Drag the indicator onto any chart.
- Adjust input parameters if needed, then click OK.
The indicator works on all timeframes and all instruments supported by your broker. No manual file copying is required.
Allow a moment on first attach for the history scan to complete. The scan walks backward up to InpHistoryScanBars bars (default 500) to detect prior signals and populate the W/L counter. After the initial scan, subsequent ticks process incrementally with no noticeable delay.
The indicator creates graphical objects with the MTB_ prefix for the dashboard, signal arrows, TP/SL lines, and S/R levels. All objects are automatically cleaned up when the indicator is removed from the chart, on symbol switch, and on timeframe switch.
Conclusion
Momentum Tidebreaker provides a structured, three-class approach to momentum signal generation, replacing the single-condition signals typical of generic EMA-cross or RSI indicators. Each of the three classes -- Trend Cross, RSI Reclaim, and Divergence -- captures a different aspect of momentum behavior, and the Strong Signal flag identifies confluence points where two classes agree on the same closed bar.
The ATR-based risk architecture provides Entry, Stop Loss, TP1, and TP2 levels on every signal, and the integrated hit-detection plus W/L tracking removes the need for separate position-management tooling on the chart. The 16-row dashboard renders in any of the four chart corners and updates in real time, providing a single-pane view of market state and active trade status.
The indicator works on all symbols and timeframes available in MetaTrader, with the ATR-based math automatically scaling to each instrument's volatility. It is suitable for swing trading on H1 through D1 with the default parameters, and adapts to scalping or position-trading configurations through documented parameter changes.
Download the indicator:
- MetaTrader 5: Momentum Tidebreaker MT5
- MetaTrader 4: Momentum Tidebreaker MT4
CONTACT & SUPPORT
- Email: info@forexobroker.com
- Questions: Use the Comments section on the product page or send a private message
- Bug Reports: Please include your broker name, account type, and a screenshot
-
✅ All MQL Tools: https://www.mql5.com/en/users/forexobroker/ ✅
--------------------------------------------------------------------------------------------------------------
🏦 **Broker I use**: https://icmarkets.com/?camp=55869
🏦 **Broker For EU Traders I use 1**: https://www.ictrading.com?camp=91414
🏦 **Broker I use 2**: https://one.exnessonelink.com/boarding/sign-up/a/c_thuv62ocfq
💻 **VPS**: https://chocoping.com/processing/aff.php?aff=738
💼 **Companies I use for getting funded**:
Fundednext: https://fundednext.com/?fpr=kestutis39
The5ers: https://www.the5ers.com/?afmc=16kl
FTMO: https://trader.ftmo.com/?affiliates=nRAyOhmFRnEnFdOpdLeh
Risk Disclaimer
Trading foreign exchange and CFDs on margin carries a high level of risk and may not be suitable for all investors. You may sustain a loss exceeding your initial investment. Trend Quorum is a technical analysis tool and does not guarantee profitable trades. Past performance is not indicative of future results. The authors accept no liability for any loss arising from use of the indicator. By using Trend Quorum you acknowledge sole responsibility for your trading decisions.


