

Introduction
Supertrend is one of the most popular trend-following overlays in retail trading, and for good reason: a single colored line that flips on meaningful breakouts is intuitive, fast to read, and ports cleanly across platforms. But anyone who has run it on a live chart for more than a few sessions has felt its weak spot. Vanilla Supertrend uses a fixed ATR multiplier, which means the bands are the same width in a clean steady trend as they are in a choppy range. The result is the familiar whipsaw pattern — a flip, a small reversal, another flip, then a third flip — even when the underlying volatility regime has not actually changed. The indicator cannot tell whether the market is trending cleanly or churning sideways, so it reacts to noise the same way it reacts to signal.
Algo Shadow Matrix is built around a single answer to that problem: instead of treating every price break the same, the indicator measures the quality of the underlying trend on every bar and modulates its band-width and flip-threshold accordingly. The mechanism is a continuous Trend Quality Index (TQI) scored 0 to 1, computed from four independent factors — Kaufman Efficiency Ratio, volatility/volume regime, structural position within the recent range, and momentum persistence. When TQI is high (clean directional move), the bands compress to track price tightly; when TQI is low (chop), they expand to absorb noise and avoid flips. The indicator becomes self-aware: it knows whether what it is looking at deserves a tight or loose response.
On top of the TQI engine sits an asymmetric-band mechanism (the active side tightens, the passive side widens, producing a ratchet-with-leverage effect), a character-flip detector that triggers regime changes on TQI collapse before price even breaks the band, a 6-factor confluence scorer (0–102 with on-chart star rating), automatic SL plus three configurable R-multiple take-profit targets, a 100-trade rolling performance buffer with a 3×3 regime grid, and a multi-section dashboard. Everything is non-repainting and built for production deployment on MQL5.com Market. This article walks through every component in detail.
Download the indicator:
- MetaTrader 5: Algo Shadow Matrix MT5
- MetaTrader 4: Algo Shadow Matrix MT4
TIP: Algo Shadow Matrix runs on any symbol and timeframe. The default Auto preset selects parameters by timeframe — Scalping on M5 and below, Default on M15–H4, Swing above H4. Override with explicit presets or Custom when you need full control.
The Vanilla Supertrend Problem
Standard Supertrend computes upper and lower bands as close +/- multiplier * ATR(N) and uses a small state machine to track whether the most recent close broke through one band or the other. The state-machine logic is sensible enough: once the band breaks, the trend regime is considered flipped until the opposite band is broken in turn. The flaw is in the band-width formula itself. The ATR multiplier is a single fixed number, configured at attachment and never touched again. The bands stay the same width whether the next 50 bars are a textbook uptrend or a featureless range.
This produces two predictable failure modes. In strong trending markets, the fixed multiplier tends to be too wide — the indicator stays in its current regime through pullbacks that the trader would have wanted to enter on, and by the time price breaks the band the entry is far from the swing low. In choppy markets, the fixed multiplier tends to be too narrow — every meaningless 1-ATR move breaks the band, the indicator flips, the next reversal flips it back, and you collect three or four whipsaw losses in a row before the chop resolves. Traders compensate by manually toggling the multiplier between symbols or timeframes, but the toggle is static and the market is dynamic.
The deeper issue is that Supertrend has no internal sense of whether the current bar is part of a clean directional move or part of noise. It treats them identically. Algo Shadow Matrix's design philosophy is to give the indicator that sense — to measure trend quality continuously and let the measurement drive the band-width and flip-threshold in real time. The next section covers how that measurement is computed.
The Trend Quality Index (TQI)
The TQI is a single number between 0 and 1 produced on every confirmed bar from four independent factors. Each factor is normalized to its own 0..1 range and then combined with a configurable weight. The default weights sum to 1.0: ER weighted 0.35, volatility regime weighted 0.20, structural position weighted 0.25, momentum persistence weighted 0.20. Every weight is exposed as an input and the indicator auto-renormalizes when the user changes them.
Factor 1 — Efficiency Ratio (ER). Kaufman's efficiency ratio is the classic measure of how directional a recent move has been. The formula is ER = |close - close[N]| / sum(|close[i] - close[i-1]| for i in 1..N) . The numerator is the net move over N bars; the denominator is the total path length traveled. The ratio is 1 when every bar moves in the same direction (perfect efficiency) and approaches 0 when bars cancel each other out (pure chop). The default window is 20 bars, which matches the typical Kaufman setting.
Factor 2 — Volatility / Volume Regime. When tick volume is available (most broker feeds, all crypto and stock feeds), the indicator computes a 20-bar rolling Z-score of tick volume and maps it through a clamp from -1 to +2 into 0..1. Bars where volume is at or above its recent average score high; bars where volume is well below average score low. When tick volume is absent (some forex feeds publish zero-volume bars), the indicator falls back to an ATR-ratio computation: the current 14-bar ATR divided by a 100-bar baseline ATR, mapped through the same 0..1 clamp. Either way, the factor captures whether the market is actively participating.
Factor 3 — Structure Position. Measures where the current close sits inside the recent 20-bar range. pricePos = (close - lowestN) / (highestN - lowestN) produces a value between 0 (price at recent low) and 1 (price at recent high). Edge-pinning — price close to 0 or close to 1 — indicates a trend; mid-range oscillation indicates a range. The score is the distance from the midline times two: |pricePos - 0.5| * 2 , giving 1 at the edges and 0 at the middle.
Factor 4 — Momentum Persistence. Counts how many of the last N bars (default 10) moved in the same direction as the overall window. If the window went up 30 pips, the count is how many individual bars closed positive. The ratio aligned/N is 1 when every bar agreed with the direction and 0.5 when half went each way. Persistence near 1 means a clean structured advance; persistence near 0.5 means random walk.
The weighted sum is then transformed through a non-linearity to control how strongly low TQI expands bands:
TQI = wER*ER + wVol*VolReg + wStruct*StructPos + wMom*MomPersist qualityDev = (1 - TQI) ^ curve // curve = 1.5 by default tqiMult = 1 - qStrength + qStrength*(0.6 + 0.8*qualityDev) bandWidth = baseATR * legacyAdapt * tqiMult
The curve exponent controls how aggressively the band-width expands as TQI drops. At curve = 1, the expansion is linear; at curve = 2, it is sharply non-linear and bands expand more dramatically on TQI collapse. The default 1.5 is a tested middle ground. The qStrength input (default 0.4) controls how much TQI influences band-width in total — 0 disables TQI entirely (pure legacy Supertrend), 1 makes TQI dominant.
Asymmetric Adaptive Bands
A symmetric Supertrend treats both bands identically. The upper band and the lower band sit at the same ATR-distance from the median. But the relationship between trend direction and the two bands is not symmetric. When the regime is bullish, the lower band (the active trailing stop) is the line that matters — a break below it flips the trend. The upper band (passive) is mostly irrelevant: price punching above it does not signal anything new. The opposite applies when the regime is bearish.
Algo Shadow Matrix exploits this asymmetry. When the UseAsymBandsInput flag is enabled (default), the band on the active side tightens proportionally to TQI, while the band on the passive side widens. Concretely:
activeMultiplier  = 1 - asymStrength * TQI * 0.3
passiveMultiplier = 1 + asymStrength * TQI * 0.4
With asymStrength = 0.5 and TQI = 0.8 (clean trend), the active band sits at (1 - 0.12) = 0.88 of normal width — 12% tighter — while the passive band sits at (1 + 0.16) = 1.16 of normal width — 16% wider. The visible effect: in clean trends, the trailing-stop side hugs price aggressively while the counter-trend side stays out of the way. This is the ratchet-with-leverage pattern: profit lock-in tightens as TQI confirms the move, but a small counter-trend incursion has more room before it can trigger a regime flip.
A naive implementation of this would produce stickiness — the multipliers would change abruptly on each bar's TQI value, and the bands would visibly jump when TQI ticks down briefly. Algo Shadow Matrix smooths both multipliers through an EMA with alpha = 0.15:
smoothedMult = alpha * rawMult + (1 - alpha) * prevSmoothedMult
This produces multipliers that respond to TQI with about 7 bars of lag — enough to filter single-bar TQI noise while still tracking real regime shifts. The smoothed multipliers are then applied to the ATR-derived band-width on every bar.
A note on previous-bar settling: the smoothed multipliers used for band-width on bar N are the values as of bar N-1's close. This is critical for non-repainting behavior. If the multipliers updated on the actively-forming bar, the bands themselves would shift through the bar and signals would repaint when the bar finally closed. Using previous-bar values guarantees that whatever band-width is rendered at any moment is also the band-width that signal logic will use when the bar closes — no surprises.
Character-Flip Detection
Vanilla Supertrend can only detect a regime change after price has already moved enough to break the opposite band. This is fine when bands are tight, but when TQI is low and the bands are wide, the price excursion required to trigger a flip can be enormous. Meanwhile, the underlying character of the market may have already shifted — momentum dying, efficiency collapsing, volatility spiking — long before price gets to the band.
The character-flip mechanism gives Algo Shadow Matrix a second, faster path to regime changes. When all three of the following conditions are met simultaneously, the indicator triggers a regime flip independent of price's position relative to the bands:
- The previous bar's TQI was above the charFlipHigh threshold (default 0.55) — that is, the trend was confirmed clean on the previous bar
- The current bar's TQI dropped below the charFlipLow threshold (default 0.25) — that is, the trend has just collapsed
- The current trend age is at least charFlipMinAge bars (default 5) — that is, we are not flipping immediately after a previous flip
- Price has at least returned past the trend's centerline — that is, momentum is clearly waning
The TQI threshold pair is deliberately asymmetric (high = 0.55, low = 0.25). Lifting from above-0.55 down to below-0.25 in a single bar represents a real character shift, not a small noise dip. The minimum-age requirement prevents whipsaw between consecutive flips when TQI is oscillating near the band boundaries. Together they produce a flip event that is both sensitive (catches regime changes 5–15 bars earlier than a band-break flip) and stable (does not fire on small TQI excursions).
Character flips appear in the on-chart visualization with the same arrow and label style as band-break flips, but their internal signal source is logged differently. Traders who prefer the conservative band-break behavior can disable character-flips via UseCharFlipInput . With character-flips disabled, the indicator falls back to standard band-break flips — still using TQI-modulated band widths, just without the early-warning regime detection.
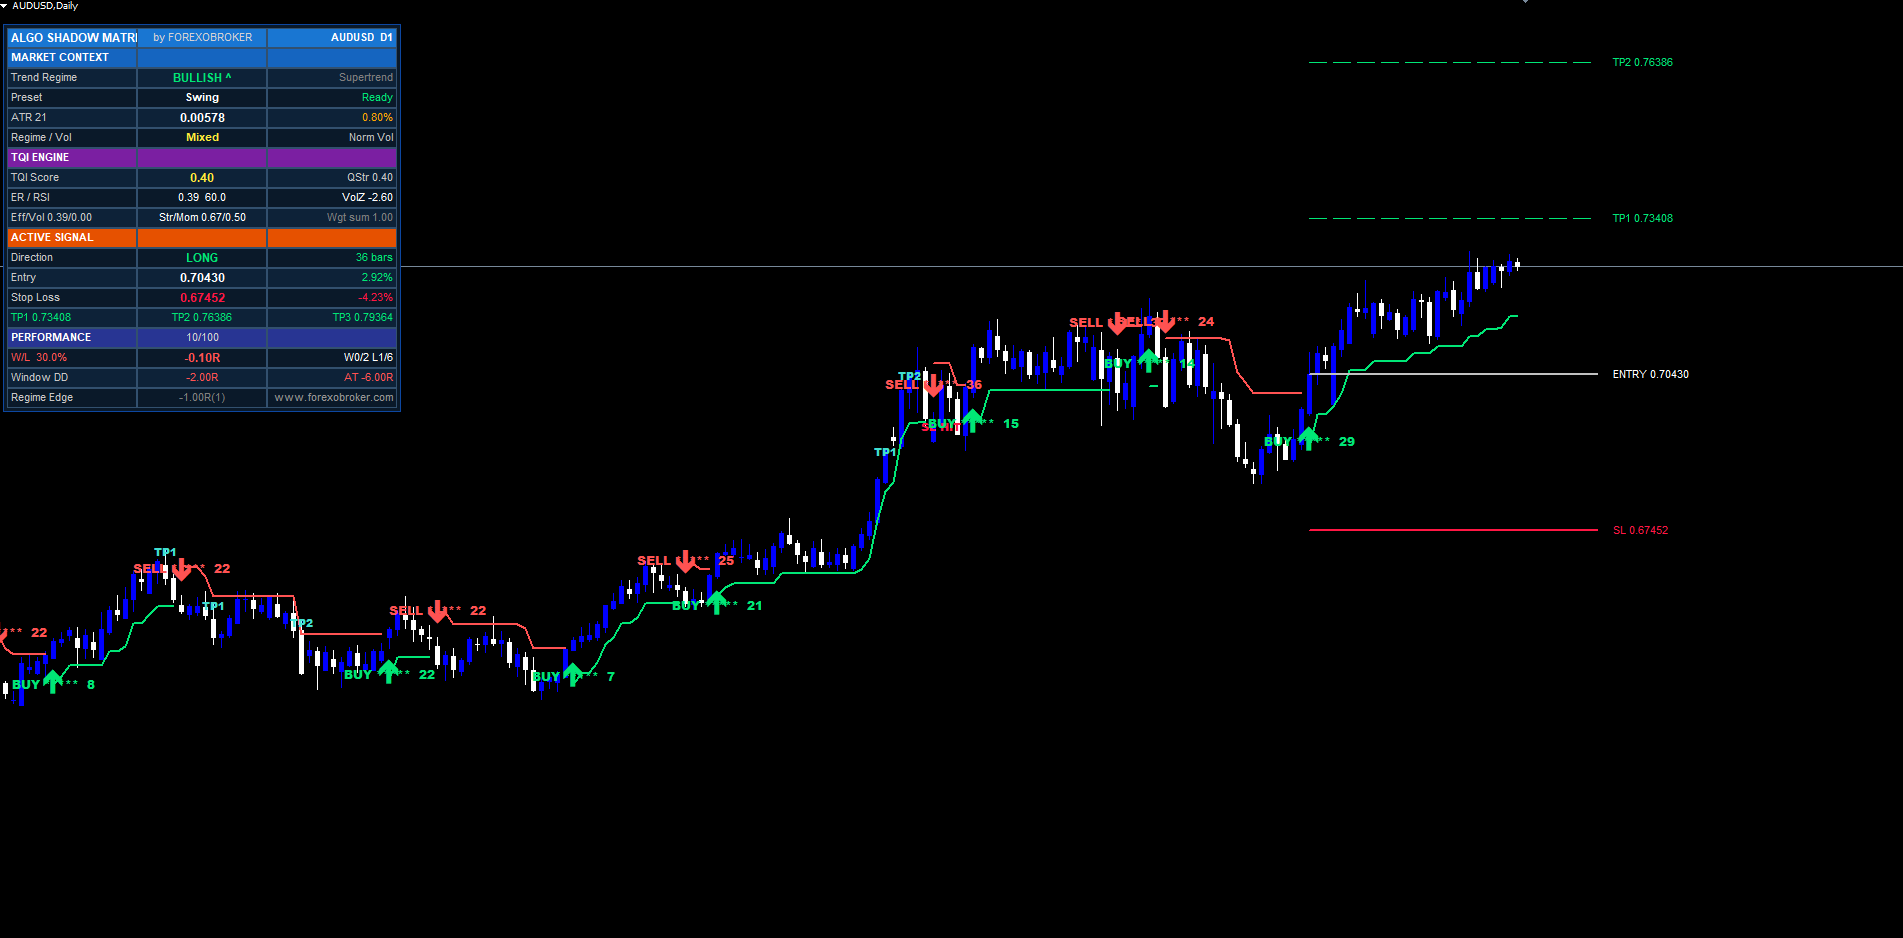
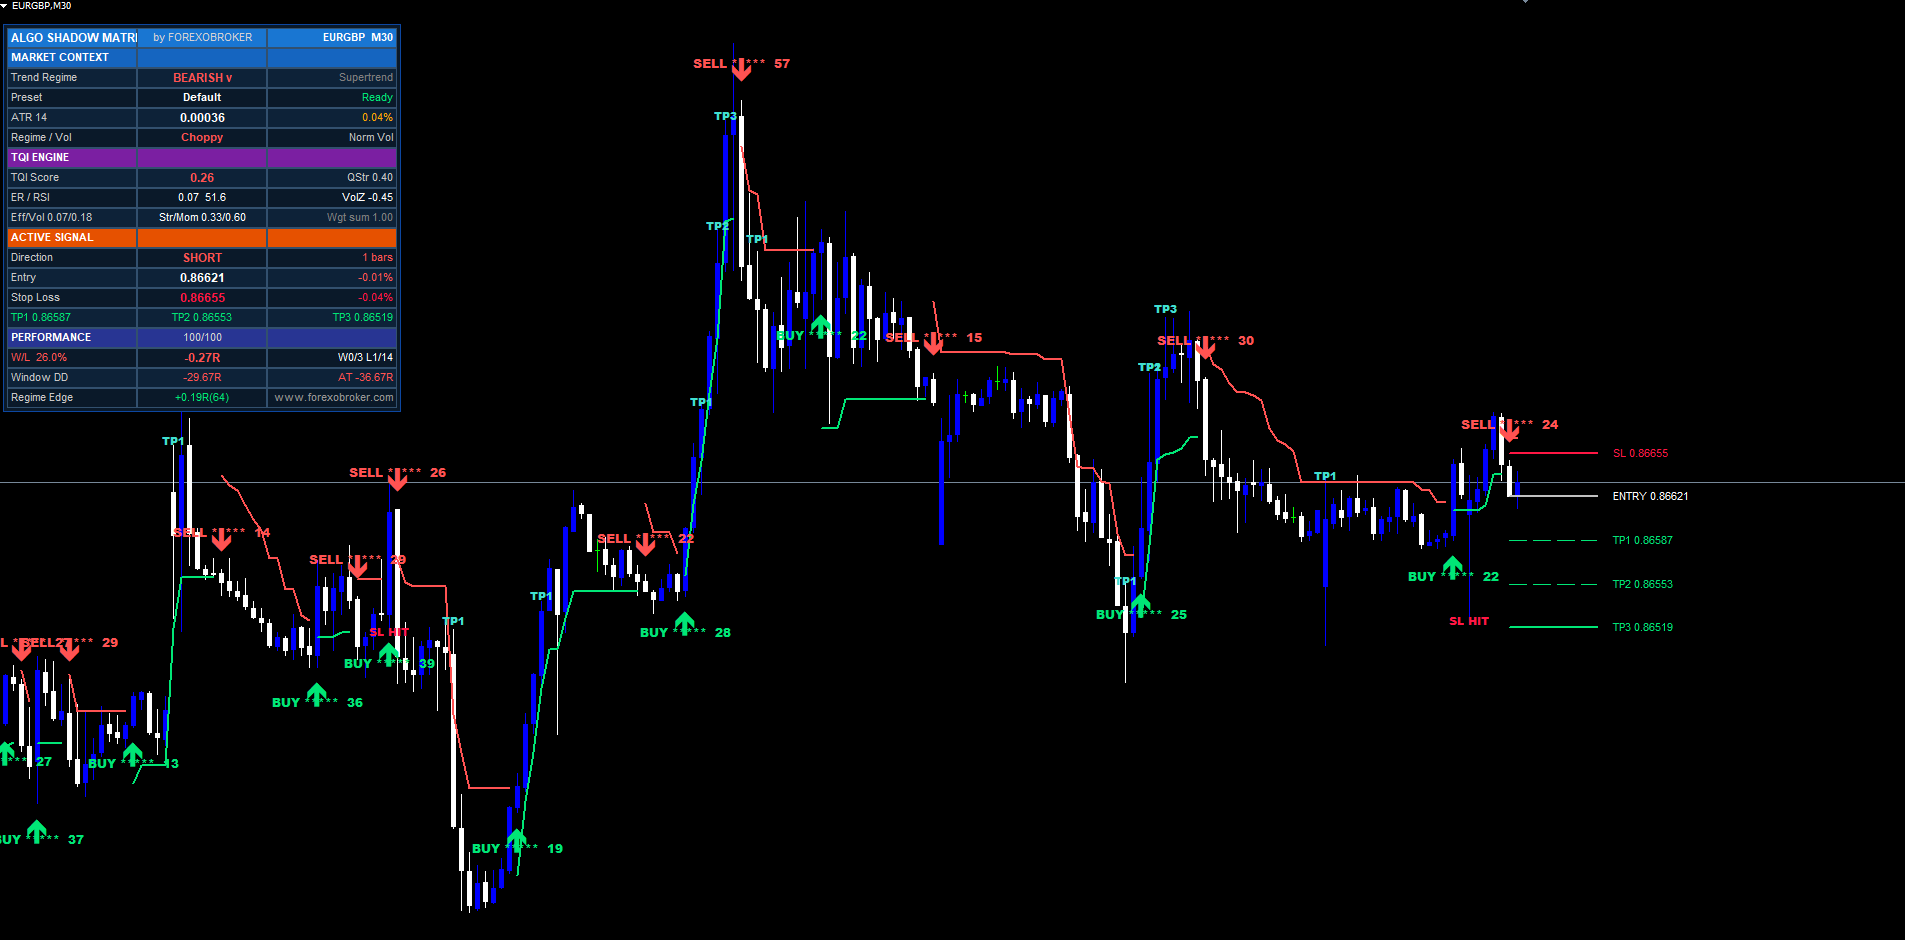
6-Factor Confluence Scoring
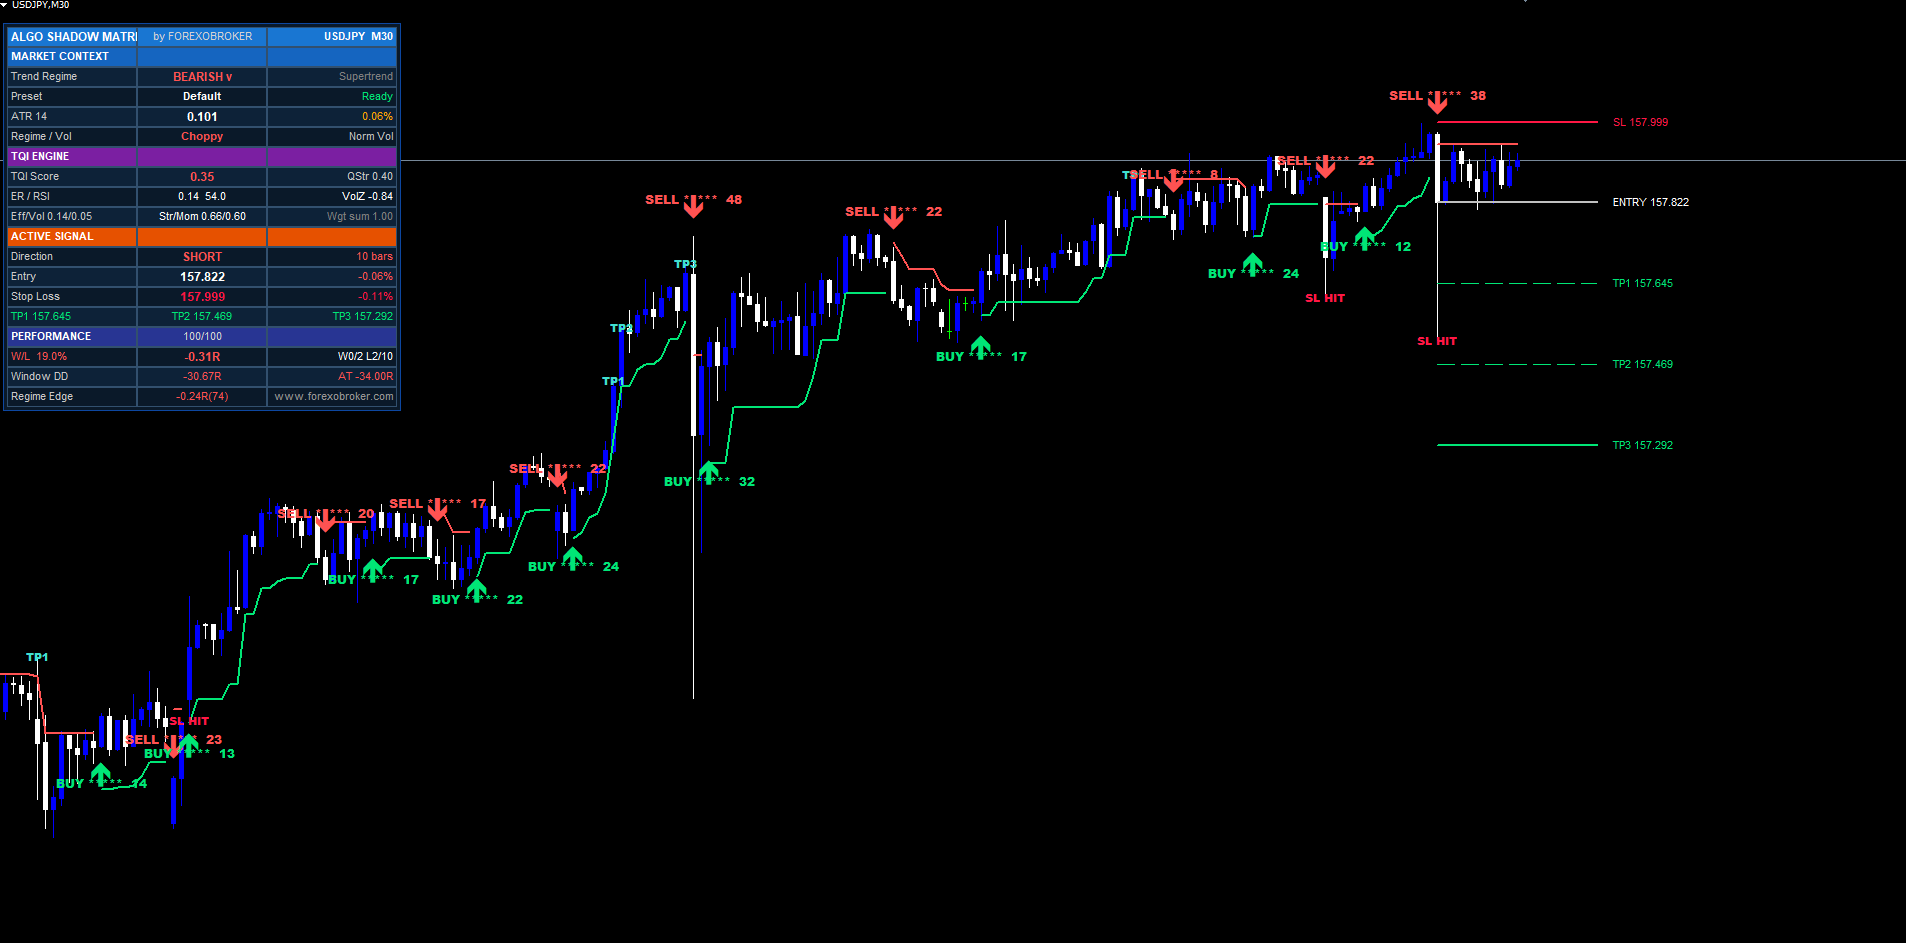
When a trend flip fires — whether from band break or character flip — the indicator does not assume that every flip is equally tradable. A second layer of analysis scores the signal against six independent confluence factors. Each factor produces a score from 0 to 17, and the six scores sum to a total ranging from 0 to 102. If a factor is disabled in the inputs, the indicator awards a fixed BYPASS_SCORE of 12 (a neutral middle value) for that factor so disabled layers do not penalize the signal. Total score 0–25 = 1 star, 26–45 = 2 stars, 46–65 = 3 stars, 66–85 = 4 stars, 86–102 = 5 stars.
Factor 1 — Momentum. Measures how strongly the bar moved into the signal direction. (close[shift] - close[shift+3]) / ATR gives a normalized momentum value; the result is clamped and mapped to 0–17. A 2-ATR move over three bars in the signal direction scores near maximum; a flat or counter-trend close scores near zero.
Factor 2 — Efficiency. Re-uses the ER computation from the TQI engine but mapped to a more aggressive 0.15–0.7 range. Below 0.15 ER (very choppy) scores 0; above 0.7 ER (very clean) scores 17. The range covers where ER actually lives in real markets — values above 0.7 are rare even in strong trends.
Factor 3 — Volume Burst. Uses the same 20-bar volume Z-score from the TQI engine, mapped to 0–3 → 0–17. When tick volume is unavailable, the layer awards BYPASS_SCORE = 12. This prevents the score from collapsing on forex feeds without tick volume — the indicator simply treats volume as neutral.
Factor 4 — RSI Depth. Computes the standard 14-period RSI and measures the deepest excursion into overbought (above 70) or oversold (below 30) zones over the RsiLookback window (default 20 bars). Deep excursions before the signal trigger get higher scores. Signals that fire from neutral RSI zones score lower because they lack the snap-back pressure that overbought/oversold conditions provide.
Factor 5 — Structure. Measures the inverse distance to the nearest pivot. The shorter the distance from the signal bar to a confirmed pivot of the same direction (pivot high for sells, pivot low for buys), the higher the score. Signals firing right at structural support or resistance get top scores; signals firing in the middle of a range get low scores.
Factor 6 — ST-Break. Measures how deeply price broke through the Supertrend band on the bar that triggered the flip. Shallow breaks (price barely closed past the band) score low — they could just be ATR noise. Deep breaks (price closed well past the band, often with a wick beyond it) score high — clear commitment to the new regime.
The sum is the signal's confluence score, displayed as both a numeric value and a star rendering. The label format is BUY 78 **** or SELL 91 ***** . Higher-star signals fire less frequently but historically perform better. The minimum-confluence input does not gate signals (every flip still fires) — instead, low-star signals are still drawn but the trader can use the star count to size or filter discretionarily.
Risk Management — SL Modes and 3 TP Targets
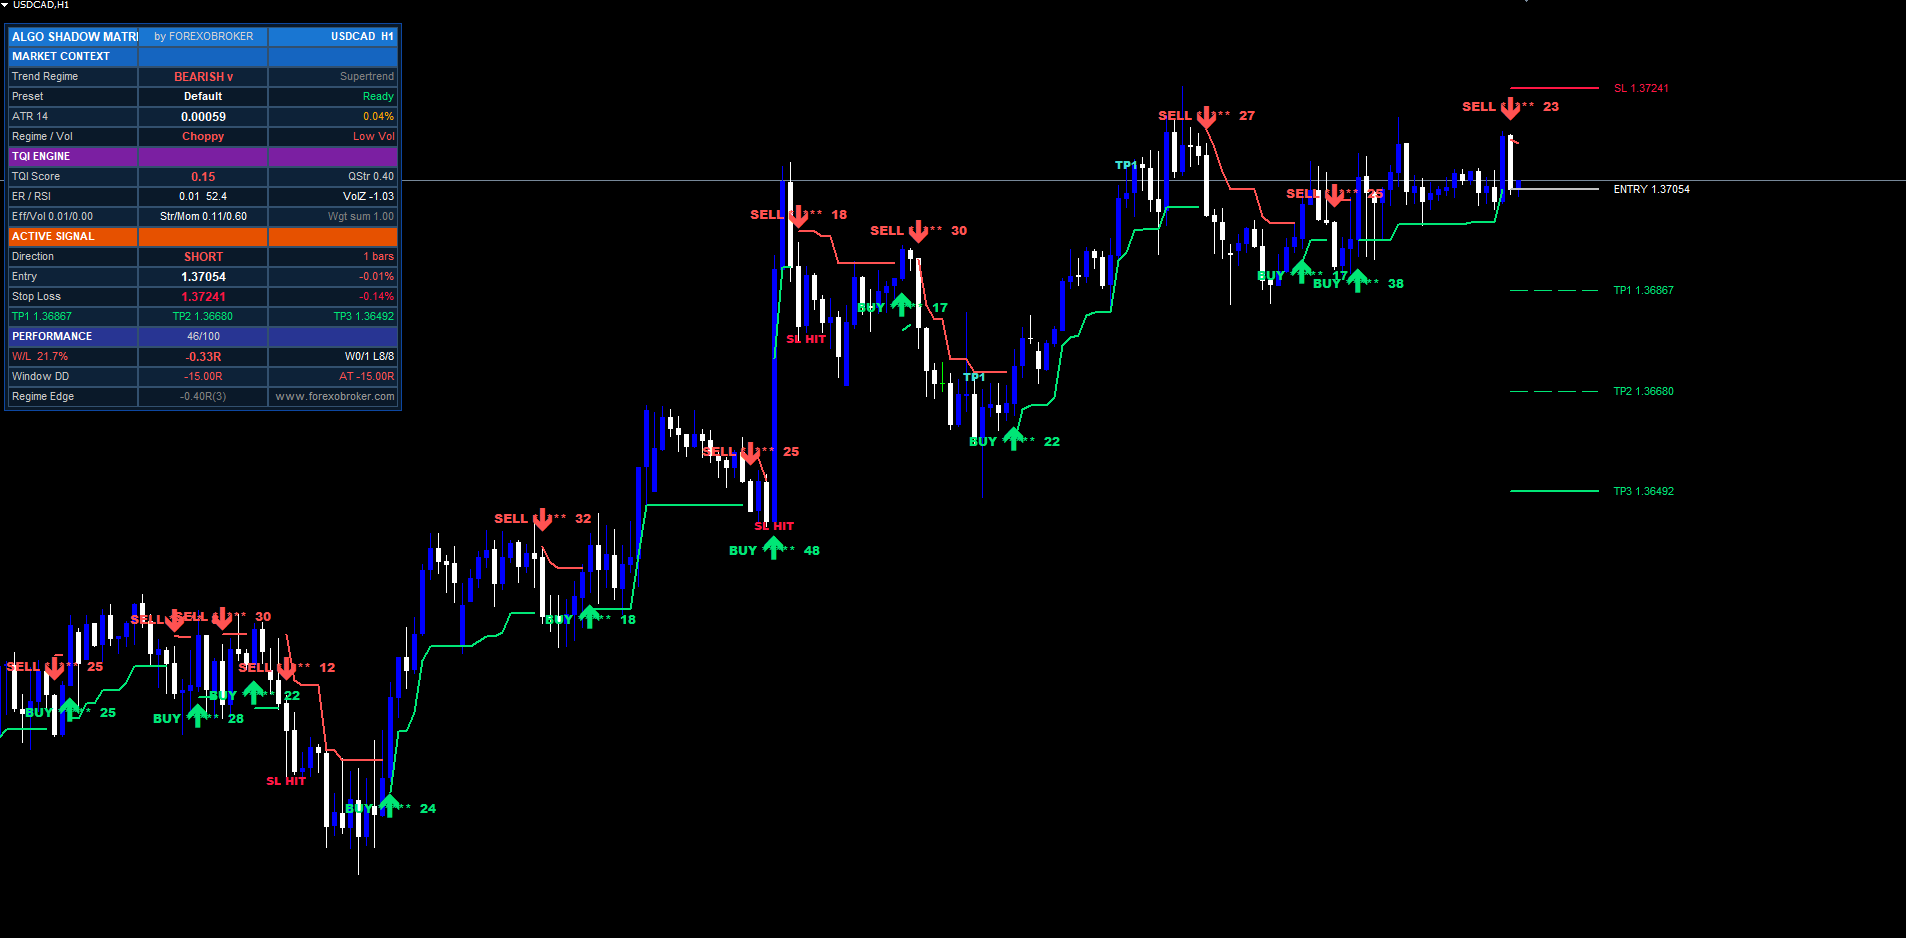
When a signal fires, the indicator immediately calculates four levels: stop loss, TP1, TP2, TP3. All four are drawn on the chart as horizontal lines extending forward by labelOffset bars (default 10) with right-side text labels showing each price and the R-multiple of each TP target.
The stop loss is computed via one of three selectable modes:
Mode 1 — ATR + Pivot (default). Computes two candidate stops: a pure-ATR stop at entry - ATR * SlAtrMult , and a pivot-anchored stop at the most recent confirmed pivot price with an ATR cushion. The mode picks the tighter of the two — for buys, the higher price; for sells, the lower. This combines the predictability of ATR-distance with respect for actual market structure (pivots).
Mode 2 — Pure ATR. Simply entry +/- ATR * SlAtrMult . The simplest and most predictable: SL distance is always exactly the multiplier times current ATR. Best for systematic backtesting where you want symmetric, mechanically computed stops.
Mode 3 — Recent Swing. Walks back 10 bars from entry and finds the most recent swing low (for buys) or swing high (for sells), then places the stop just past it with an ATR cushion. Hugs market structure most aggressively. Tends to produce tighter stops in tight markets and wider stops on high-volatility bars where wicks exceed the 10-bar range.
Once SL is placed, the indicator computes risk: risk = |entry - SL| . The three TPs are then drawn at:
TP1 = entry + risk * Tp1RInput     // default 1.R
TP2 = entry + risk * Tp2RInput     // default 2.R
TP3 = entry + risk * Tp3RInput     // default 3.R
For sell signals, the formula is symmetric (TPs below entry). The R-multiples are configurable and the indicator auto-sorts them ascending — if the user accidentally enters 3.0, 2.0, 1.5, the indicator normalizes to 1.5, 2.0, 3.0 internally so TP1 is always the closest target.
When the efficiency-weighted ATR mode is enabled ( UseEffAtrInput ), the ATR used for SL and TP calculations is multiplied by 0.5 + 0.5 * ER before risk computation. This shrinks distances in clean markets (where ER is high, multiplier near 1) and expands them in choppy markets (where ER is low, multiplier near 0.5). The visible effect: tighter risk parameters when the market is committed, wider when it is uncertain.
Hit detection runs on every confirmed bar after the signal. When price's high (for buys) or low (for sells) crosses a TP level, a small TP1 HIT / TP2 HIT / TP3 HIT label is dropped on the bar, the dashboard updates that row with a * suffix, and the active alert package fires the corresponding event. SL hit is symmetric. A trade is considered closed when either SL is touched or TP3 is reached (whichever happens first), and the SL/TP lines are removed to keep the chart uncluttered. Signal arrows remain permanently visible for historical reference.
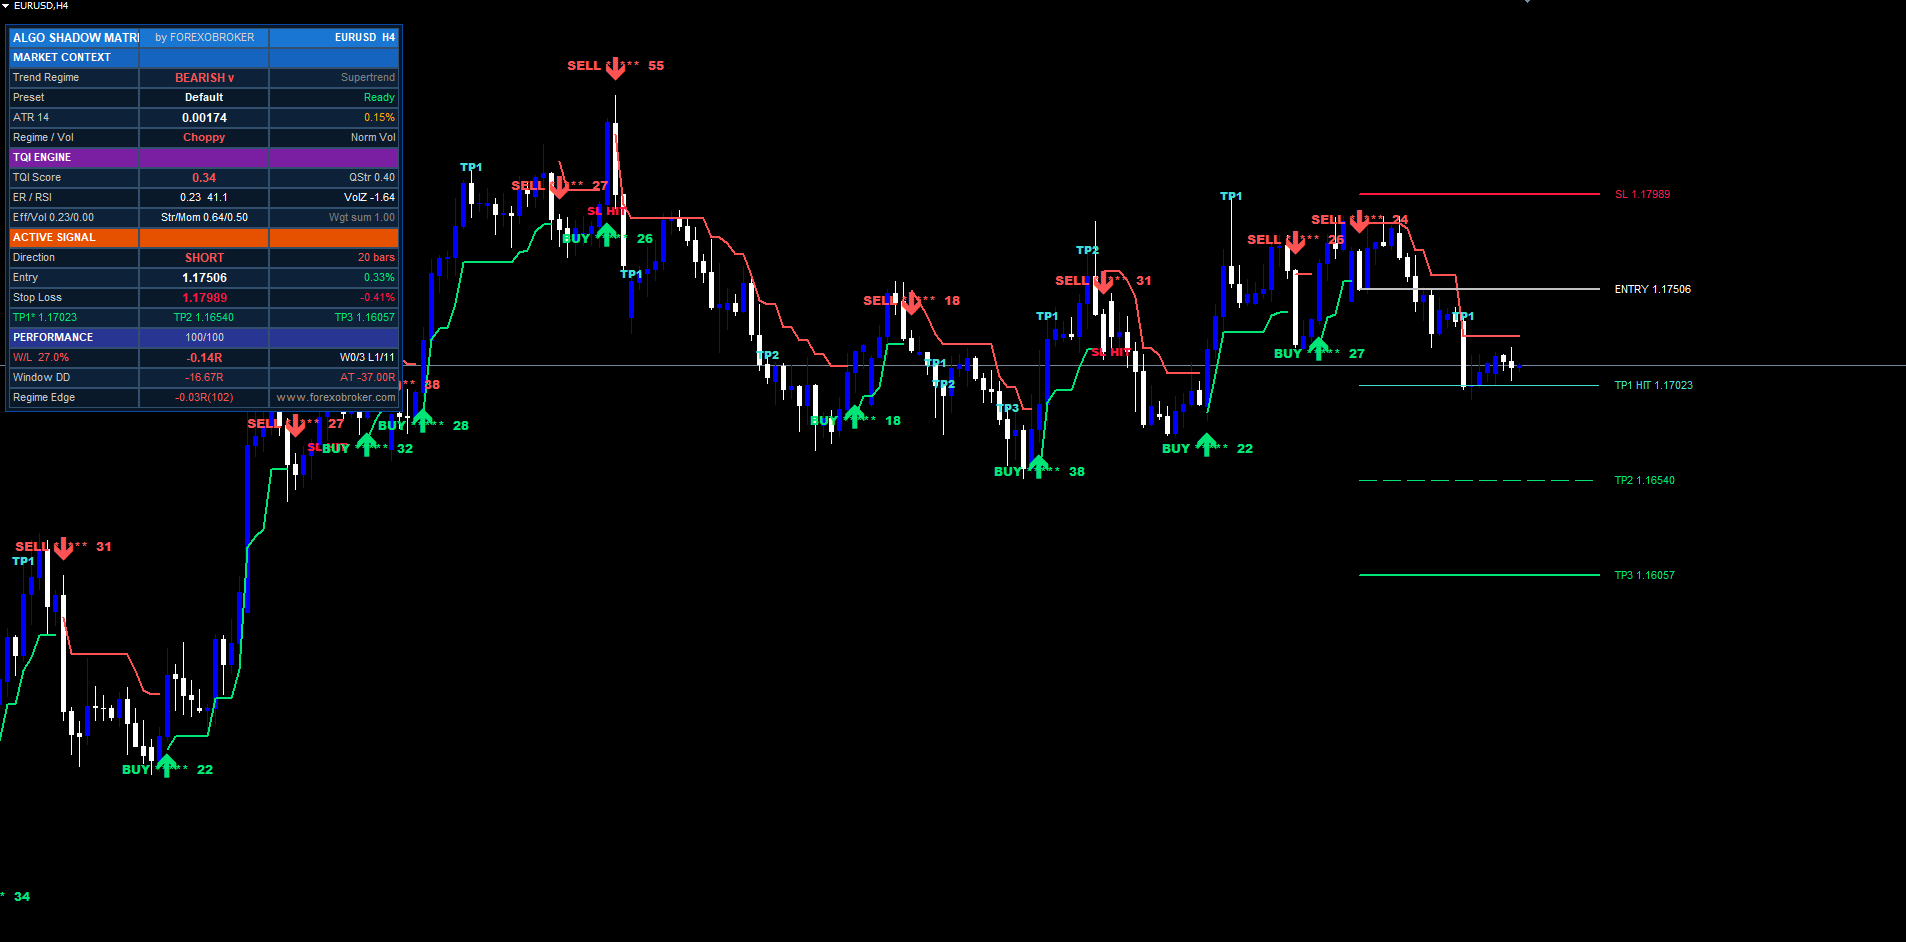
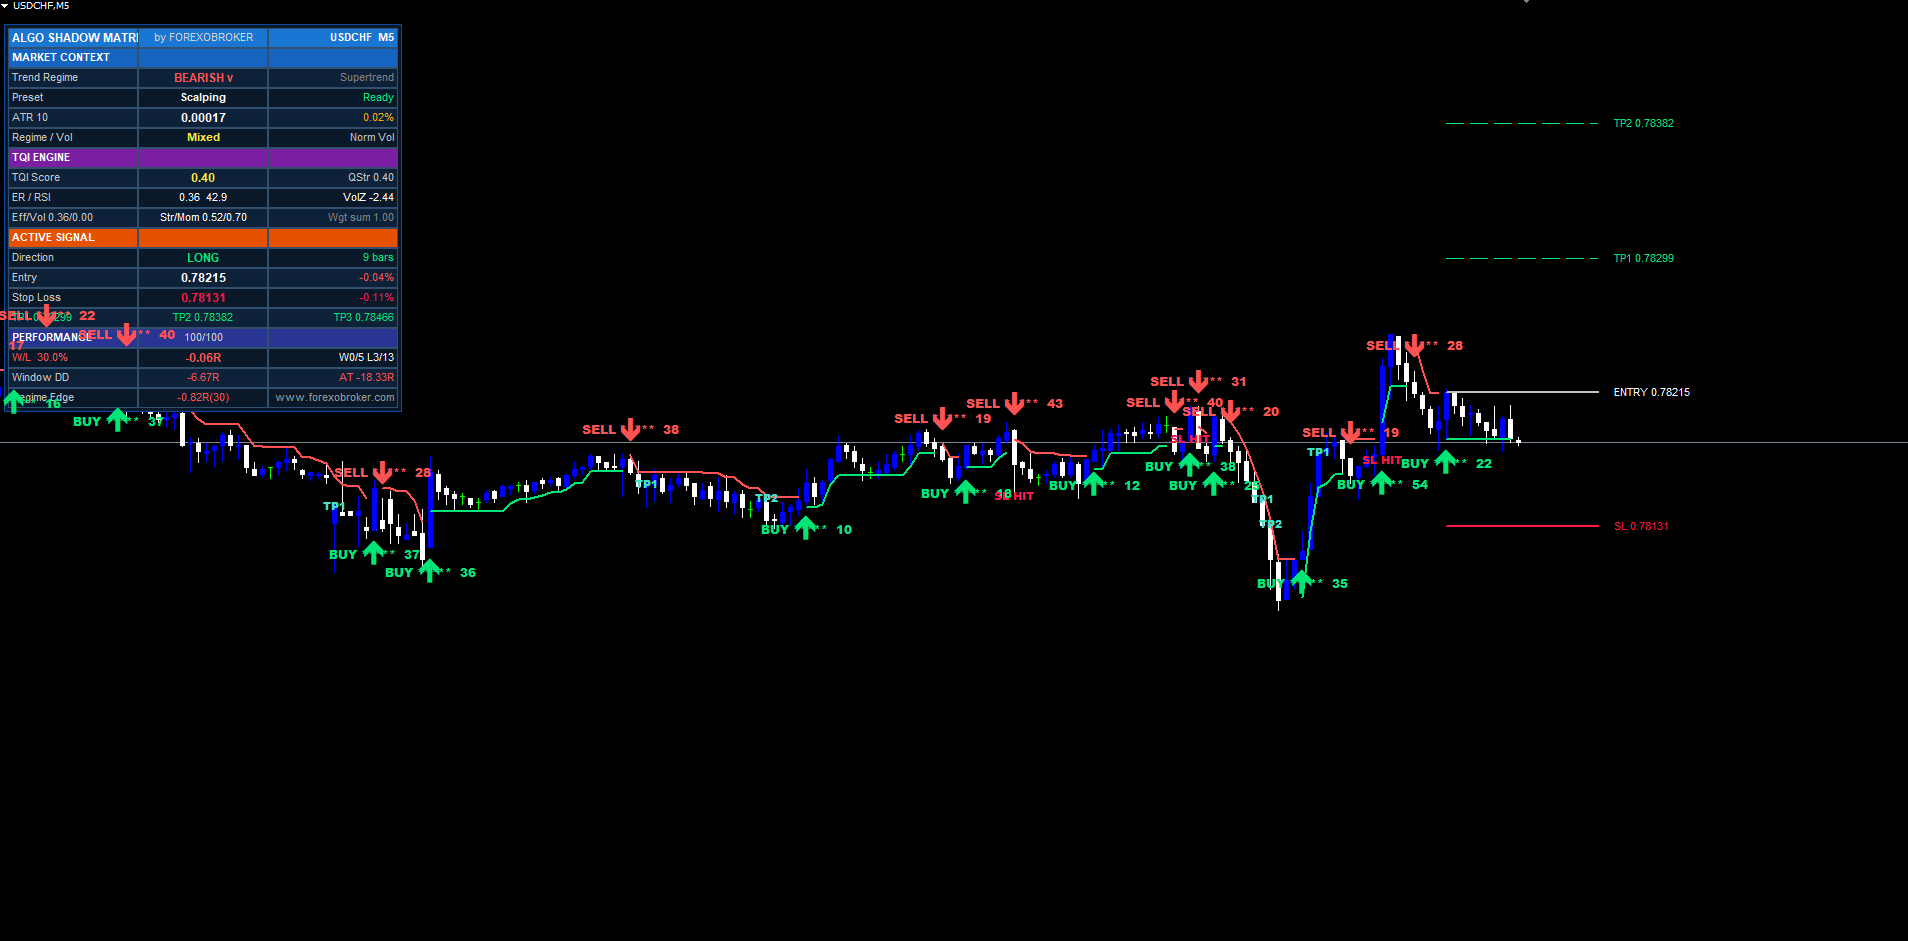
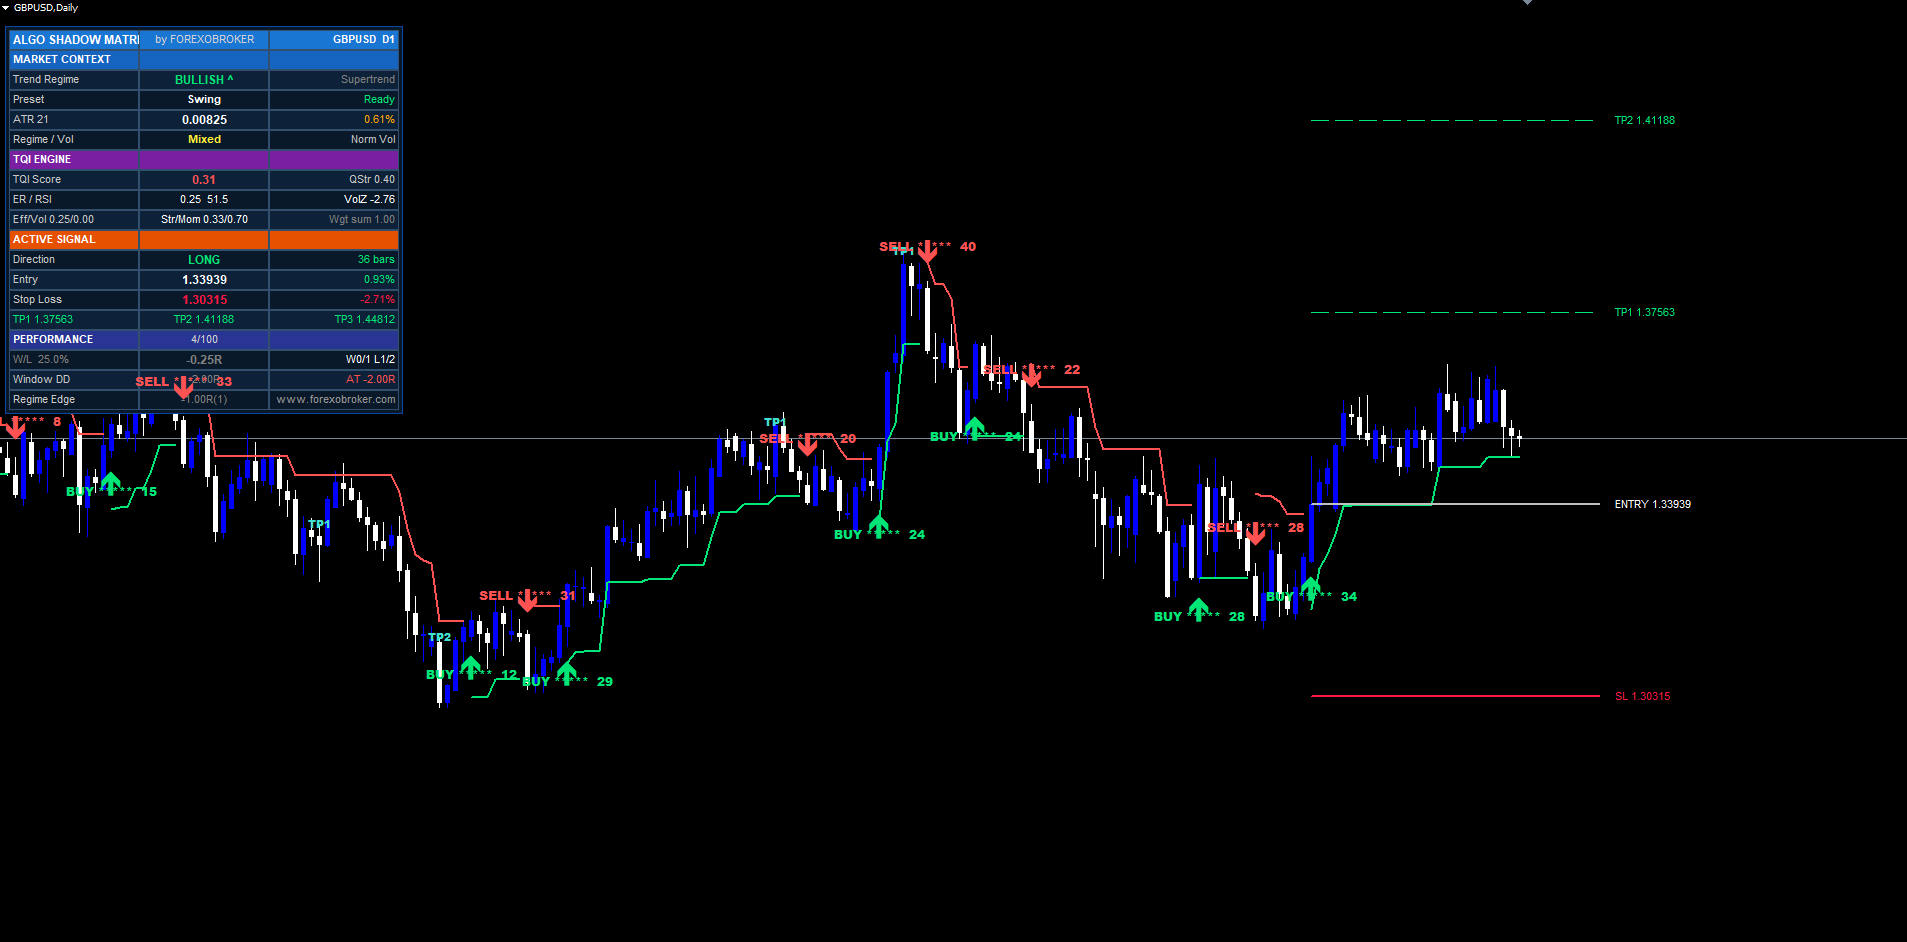
Performance Tracking and the Regime Grid
The indicator maintains a rolling buffer of the last 100 signal outcomes, recording the R-multiple realized on each closed trade. A trade that hit TP2 before SL records +2.0R; a trade that hit SL counts as -1.0R; a trade that hit TP1 then reversed to SL counts as either +1.0R (if the trader's policy is breakeven-after-TP1) or -0.5R (if not), and both versions are tracked. From the buffer, the dashboard's Performance section reports rolling win rate, average R, current drawdown from the buffer's all-time-high cumulative R, the longest win and loss streaks (current and ever), and current cumulative R.
Beyond the simple rolling buffer, Algo Shadow Matrix also tracks a 3×3 regime grid: three Efficiency Ratio bins (low / mid / high) crossed with three volume bins (low / mid / high). Every closed trade is bucketed into one of the nine cells based on the TQI factor values at the time the signal fired. Within each cell, the indicator maintains an EWMA-tracked average R for the last several trades that fell into that cell.
The point of the regime grid is to surface non-obvious edge. Maybe your overall win rate looks mediocre at 47%, but when you filter to the high-ER / high-volume cell, the win rate is 71%. Or maybe the high-ER / low-volume cell is consistently a money pit at 31%. The grid lets you see which (ER, Vol) regimes have historically been profitable on the current symbol and timeframe, so you can decide to take only signals from the strong cells, or to size up on signals from cells with the best historical edge.
The grid is rendered in the dashboard as a compact 3×3 of colored cells with the EWMA R value in each. Green cells are profitable, red cells are unprofitable, white cells are too new to judge (fewer than 5 trades have fired into them). The grid resets on indicator reload but persists across in-session ticks. For longer-term edge tracking, the recommended workflow is to run the indicator on a chart continuously and let the grid populate from real signal outcomes — historical replay alone covers the most recent 100 signals, which is enough for early-stage edge detection on the lower timeframes.
Multi-Section Dashboard
The dashboard is a pixel-anchored widget rendered with OBJ_RECTANGLE_LABEL backgrounds and OBJ_LABEL text. It uses the chart's display-coordinate system, so it stays anchored to a fixed corner regardless of scroll, zoom, or symbol switch. The widget redraws on every OnTimer tick (MT5, every 500ms) or every OnCalculate call (MT4) and re-anchors on every CHARTEVENT_CHART_CHANGE so it correctly relocates when the user resizes the terminal window.
The layout is 3 columns wide and approximately 17 rows tall. Six corner anchor positions are selectable: TR (top right), TL (top left), BR (bottom right), BL (bottom left), MR (mid right), ML (mid left). Inside the chosen corner, the user nudges position with DashOffsetXInput and DashOffsetYInput (pixel offsets) and a default DashMarginInput of 10 pixels from the chart edge. Column width is configurable ( DashColumnWidthInput , default 130 pixels) and font size scales from 6 to 24 ( DashFontSizeInput , default 8).
Section layout:
-
Header row. Brand name on the left, "by Forexobroker" centered, current symbol and timeframe on the right.
-
MARKET CONTEXT section (blue). Four rows: Trend Regime (BULLISH / BEARISH / NEUTRAL with color coding), Active Preset name plus current parameter status, ATR value plus ATR-as-percentage-of-price, current Regime and Volume classification.
-
TQI ENGINE section (purple). Three rows by default, five if ShowTqiBreakdownInput is on: TQI Score with QStrength multiplier, ER value with current RSI and volZ, and optionally the four-factor breakdown (ER / Vol / Struct / Mom each on its own row with the contributing weight).
-
ACTIVE SIGNAL section (orange). Five rows when a trade is active: Direction with bars-ago count, Entry price with live percent-PnL, SL price with percent-distance from entry, TP1 / TP2 / TP3 on three separate rows, each suffixed with * if the level has been hit. When no trade is active, the section collapses to a single "WAITING" row.
-
PERFORMANCE section (indigo). Four rows: Win-Rate with average R and current streak, Window drawdown plus all-time drawdown, current cumulative R, and the 3×3 Regime Grid in compact form.
The dashboard uses ASCII characters only — no Unicode glyphs that might render as question marks on certain MetaTrader font configurations. Star renderings use plain asterisks ( * , ** , *** , **** , ***** ). Up/down arrows in P&L cells use ^ and v .
Full Alert Package
Algo Shadow Matrix supports five alert events delivered through three independent channels: MetaTrader popup, push notification to the mobile app, and email via the terminal's SMTP configuration. Each channel can be enabled or disabled separately, and each event can be toggled independently within the channel.
The five alert events:
- BUY signal fired (band-break or character-flip into bullish regime)
- SELL signal fired (into bearish regime)
- Bullish trend shift (regime change to bullish, regardless of whether a labeled signal printed)
- Bearish trend shift (regime change to bearish)
- TP/SL hit (each tier — TP1, TP2, TP3, or SL — fires its own event)
Every alert message includes the indicator name, brand, symbol, timeframe, current price, and the relevant level prices for the signal. The indicator also emits a JSON payload suitable for webhook integration with external automation:
{ "indicator": "ASM", "brand": "Forexobroker", "action": "buy", "ticker": "EURUSD", "tf": "H1", "price": 1.07420, "sl": 1.07100, "tp1": 1.07740, "tp2": 1.08060, "tp3": 1.08380, "score": 78, "tqi": 0.71 }
The JSON is logged to the terminal's experts log and is also pushed to the alert message body, so any downstream consumer can parse it directly out of the alert text. Webhook delivery itself is not provided by the indicator (MQL5 Market policy prohibits internet access); instead, the alert is emitted in a format that an external bridge (e.g., a third-party alert-forwarding tool) can capture and forward.
Initial-load alert flood is silenced by a global g_silenceAlerts flag. When the indicator attaches to a chart, the historical replay populates the chart with arrows, labels, and SL/TP lines for every confirmed signal in the visible history, but no alerts fire. Once the silence flag clears on the first new bar after attachment, fresh signals alert normally.
Non-Repaint Guarantee
Algo Shadow Matrix is designed to produce identical signals at identical bar timestamps regardless of when the indicator is attached to the chart. The historical replay drawn at indicator load is exactly the same sequence of signals that would have fired live, in the same order, at the same bars. There is no repaint and no look-ahead. This is achieved through several architectural choices that, combined, make the indicator suitable for both manual review and systematic backtesting.
All signal evaluation runs on confirmed, closed bars only. The bar currently forming (shift 0) is never used as a trigger source — only its OHLC values are reflected in the dashboard for live monitoring. The flip-detection logic at the heart of the indicator runs at shift >= 1 with previous-bar settled inputs, which means a flip detected at bar N depends only on values that became immutable when bar N-1 closed.
The asymmetric-band multiplier EMAs use previous-bar settled values, not current-bar in-progress values. If the multipliers updated on the actively forming bar, the bands would shift through the bar and any signal that fired mid-bar could repaint when the bar finally closed. By forcing the EMAs to use the previous bar's smoothed multipliers, the bands at any moment in the current bar are also the bands that the closing-bar signal logic will use — no surprises.
The ratchet logic uses a previous-bar comparison ( close[1] > prevLowerBand[1] ) rather than current-bar to determine whether the trailing-stop side is allowed to ratchet up. This prevents intra-bar wicks from ratcheting the stop tighter and then having the bar close back below the wick, which would visually look like the stop moved without justification.
The pivot-detection routine uses a 1-bar right-side lookback, which means a pivot at bar N is confirmed at bar N+1's open and never revisited. The Pine-port history-scan routine deterministically replays the entire signal history at indicator load, producing the same signals at the same bars regardless of how many historical bars the chart has loaded.
The alert flood guard is a g_silenceAlerts flag set true at the start of OnCalculate when prev_calculated == 0 (i.e., this is the historical replay pass) and reset to false at the end of the same OnCalculate call. All alert sites check the flag before firing. This means no alerts are emitted during the initial replay, but every alert fires normally on subsequent ticks once new bars arrive.
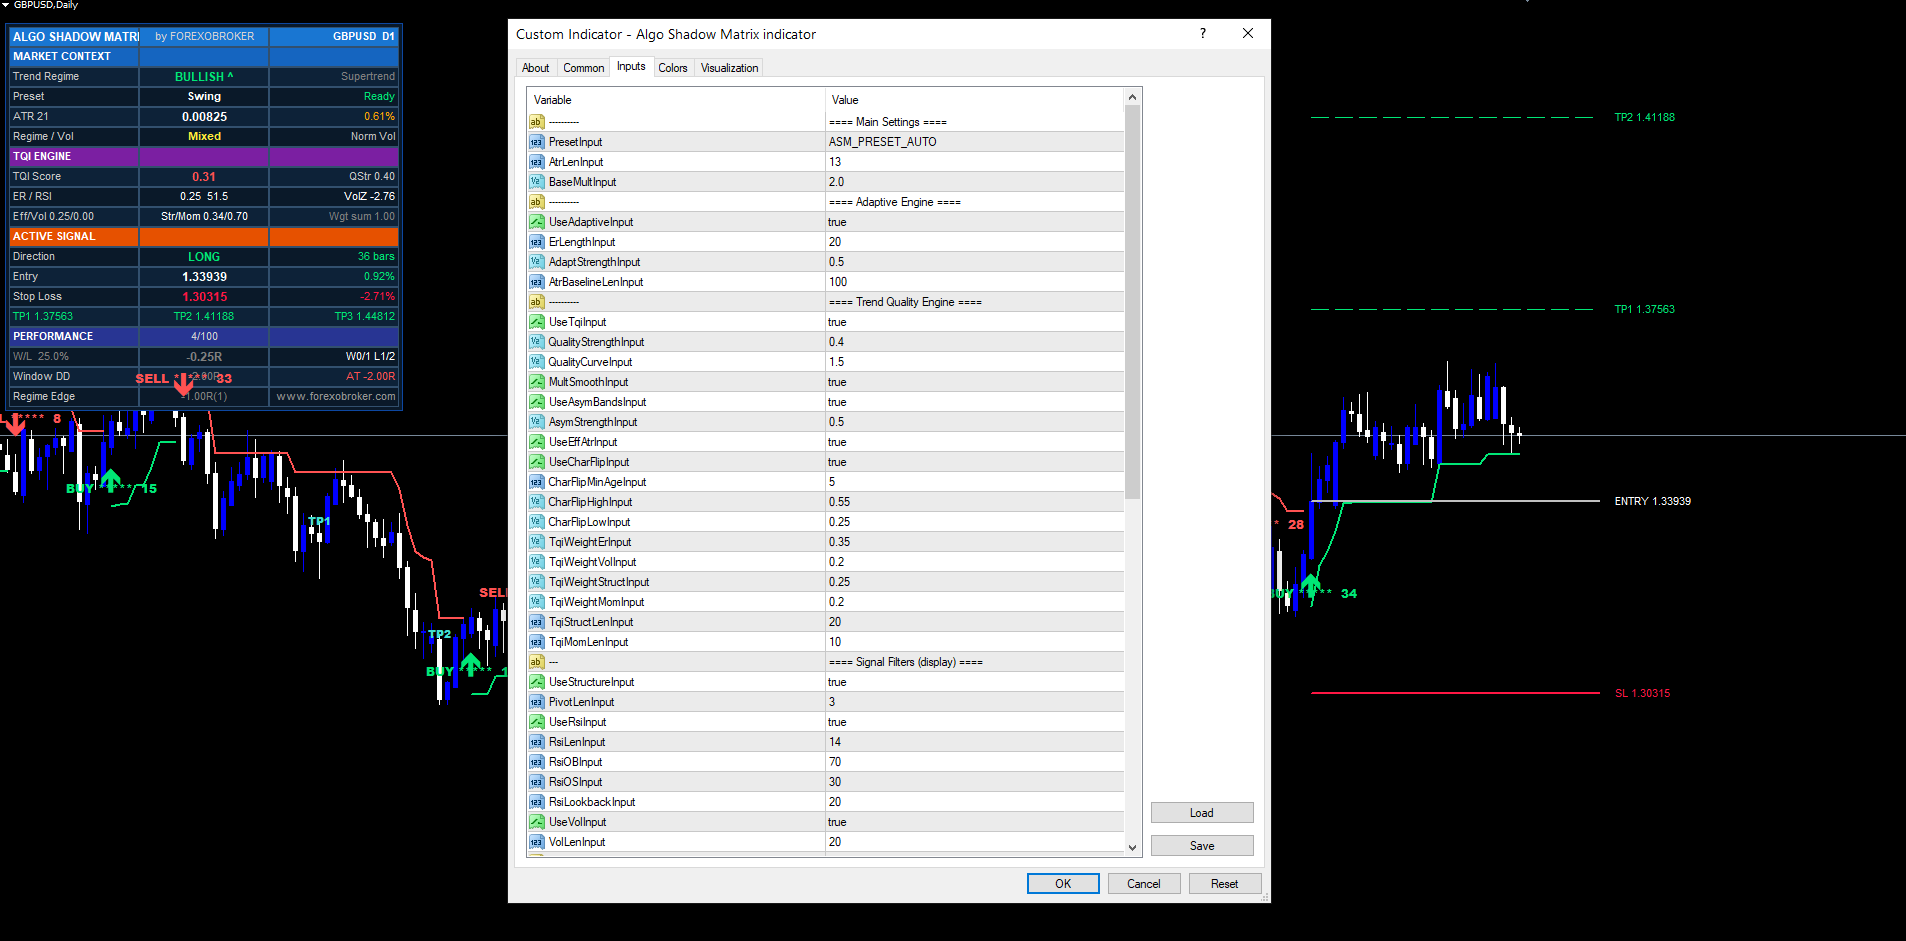
Input Parameter Reference
The indicator exposes approximately 45 inputs grouped into eight categories. Defaults are tuned for the H1 majors swing-trading use case. Every value is range-validated in OnInit and the indicator returns INIT_PARAMETERS_INCORRECT if any value falls outside its allowed range.
Main Settings. PresetInput (Auto / Custom / Scalping / Default / Swing / Crypto), AtrLenInput (13), BaseMultInput (2.0).
Adaptive Engine — Legacy ER. UseAdaptiveInput (true), ErLengthInput (20), AdaptStrengthInput (0.5), AtrBaselineLenInput (100).
Trend Quality Engine. UseTqiInput (true), QualityStrengthInput (0.4), QualityCurveInput (1.5), MultSmoothInput (true), UseAsymBandsInput (true), AsymStrengthInput (0.5), UseEffAtrInput (true), UseCharFlipInput (true), CharFlipMinAgeInput (5), CharFlipHighInput (0.55), CharFlipLowInput (0.25), TqiWeightErInput (0.35), TqiWeightVolInput (0.20), TqiWeightStructInput (0.25), TqiWeightMomInput (0.20), TqiStructLenInput (20), TqiMomLenInput (10).
Signal Filters — Display Layer. UseStructureInput (true), PivotLenInput (3), UseRsiInput (true), RsiLenInput (14), RsiOBInput (70), RsiOSInput (30), RsiLookbackInput (20), UseVolInput (true), VolLenInput (20).
Risk Management. ShowRiskInput (true), SlAtrMultInput (1.5), Tp1RInput (1.0), Tp2RInput (2.0), Tp3RInput (3.0), LabelOffsetInput (10), ShowHitsInput (true), TradeMaxAgeInput (100).
Visual. ShowBandsInput (true), ShowSignalsInput (true), plus bullish and bearish color inputs for the bands, arrows, labels, and dashboard accents.
Dashboard. ShowDashInput (true), ShowTqiBreakdownInput (false), ShowPerfInput (true), DashPosInput (TR), DashFontSizeInput (8), DashMarginInput (10), DashOffsetXInput (0), DashOffsetYInput (20), DashColumnWidthInput (130).
Alerts. EnableAlertsInput (true), EnablePopupInput (true), EnablePushInput (false), EnableEmailInput (false).
Each input is range-validated. Negative values, zero values where positive is required, ATR lengths above 500 or below 2, weights summing to more than 2.0 — all return INIT_PARAMETERS_INCORRECT and the indicator refuses to attach until corrected. The validation is intentionally strict because Market policy requires safe behavior under all input combinations and silent misconfiguration is worse than a visible error.
For a complete description of each input including recommended values for different markets and timeframes, see the companion user manual.
Closing
Algo Shadow Matrix is a complete adaptive trend system built around one core insight: that Supertrend's flaws come from its inability to measure the quality of the trend it is tracking. By computing a continuous Trend Quality Index from four independent factors and feeding that index into the band-width formula, the indicator self-adjusts on every bar — tightening on clean trends, loosening on chop. The asymmetric-band mechanism converts that single insight into a ratchet-with-leverage effect that locks in profit aggressively on confirmed moves while leaving room for counter-trend incursions. The character-flip detector adds a second, faster path to regime changes that vanilla Supertrend cannot see at all. The 6-factor confluence scorer and the 100-trade rolling regime grid add layers of post-hoc analysis that turn the indicator from a single signal source into a self-evaluating system.
The MT4 and MT5 builds are functionally and visually identical. Both ship with the same input names, the same dashboard layout, the same alert events, and produce the same signals at the same bar timestamps when given the same price data. The TradingView Pine v6 build (sold separately) preserves the same math and decision logic so signals match across all three platforms.
Download the indicator:
- MetaTrader 5: Algo Shadow Matrix MT5
- MetaTrader 4: Algo Shadow Matrix MT4
CONTACT & SUPPORT
- Email: info@forexobroker.com
- Questions: Use the Comments section on the product page or send a private message
- Bug Reports: Please include your broker name, account type, and a screenshot
-
✅ All MQL Tools: https://www.mql5.com/en/users/forexobroker/ ✅
--------------------------------------------------------------------------------------------------------------
🏦 **Broker I use**: https://icmarkets.com/?camp=55869
🏦 **Broker For EU Traders I use 1**: https://www.ictrading.com?camp=91414
🏦 **Broker I use 2**: https://one.exnessonelink.com/boarding/sign-up/a/c_thuv62ocfq
💻 **VPS**: https://chocoping.com/processing/aff.php?aff=738
💼 **Companies I use for getting funded**:
Fundednext: https://fundednext.com/?fpr=kestutis39
The5ers: https://www.the5ers.com/?afmc=16kl
FTMO: https://trader.ftmo.com/?affiliates=nRAyOhmFRnEnFdOpdLeh
Risk Disclaimer
Trading foreign exchange and CFDs on margin carries a high level of risk and may not be suitable for all investors. You may sustain a loss exceeding your initial investment. Trend Quorum is a technical analysis tool and does not guarantee profitable trades. Past performance is not indicative of future results. The authors accept no liability for any loss arising from use of the indicator. By using Trend Quorum you acknowledge sole responsibility for your trading decisions.


![[iVISTscalp5]: TSI — Timing Strength Index](https://c.mql5.com/6/1015/splash-preview-772243.png "[iVISTscalp5]: TSI — Timing Strength Index")
![[XAUUSD]: Weekly Liquidity Activation Points (LAP), July 6 - July 10, 2026](https://c.mql5.com/6/1015/splash-preview-772241.png "[XAUUSD]: Weekly Liquidity Activation Points (LAP), July 6 - July 10, 2026")
