
Trend Trading Made Simple: How the Aero Pulse Dashboard Scans 20 Symbols Across All Timeframes for BUY and SELL Signals

You sit down at your desk, open MetaTrader, and start checking charts for trend signals. EURUSD M15 -- sideways. Switch to H1 -- still unclear. Open GBPUSD H4 -- maybe something forming. Then USDJPY, AUDUSD, USDCAD. Thirty minutes pass and you have checked six pairs on two timeframes. Meanwhile, the clean HalfTrend BUY signal that fired on XAUUSD H4 two bars ago -- the one that preceded a 300-pip rally -- went completely unnoticed because you never got to it.
This is the fundamental challenge of trend-following trading. The approach itself is one of the most reliable methods in technical analysis: identify the direction of the prevailing trend and trade in alignment with it. But scanning for trend signals manually across multiple symbols and multiple timeframes is slow, error-prone, and impractical. If you monitor 20 instruments across 9 timeframes, that is 180 individual chart views to evaluate every time you sit down to look for setups.
I built the Aero Pulse Dashboard indicator to solve this problem. It applies the HalfTrend algorithm across all your symbols and timeframes simultaneously, displays every active BUY and SELL signal in a single interactive dashboard, and alerts you the moment a new trend change occurs -- on screen, via sound, by email, or as a push notification to your phone. Signals are confirmed on bar close, so they do not repaint. One click on any dashboard row navigates your chart directly to that signal for visual confirmation.
In this article, I will explain the principles of trend-following trading, walk through how the HalfTrend algorithm works, and then show you exactly how the Aero Pulse Dashboard turns these concepts into a practical scanning workflow. Whether you are new to trend trading or an experienced trader looking for better tools, this guide covers everything from theory to execution.
The indicator is available on the MQL5 Market for both platforms:
- MetaTrader 5: Aero Pulse Dashboard MT5
- MetaTrader 4: Aero Pulse Dashboard MT4
What Is Trend-Following Trading?
Trend-following is a trading strategy built on a single principle: price tends to continue moving in its current direction more often than it reverses. Rather than trying to predict turning points, trend followers identify the prevailing direction and trade with it until the evidence says the trend has changed.
This approach works because trends are not random. They emerge from structural forces in the market: central bank policies that drive multi-month currency movements, institutional order flow that creates sustained buying or selling pressure, and economic cycles that push commodities and indices in one direction for extended periods. When a large fund begins accumulating a position, its buying activity pushes price higher over days or weeks. Other participants recognize the trend and add their orders, creating a self-reinforcing cycle.
How to Identify a Trend
At its simplest, a trend is defined by the structure of swing points on the chart:
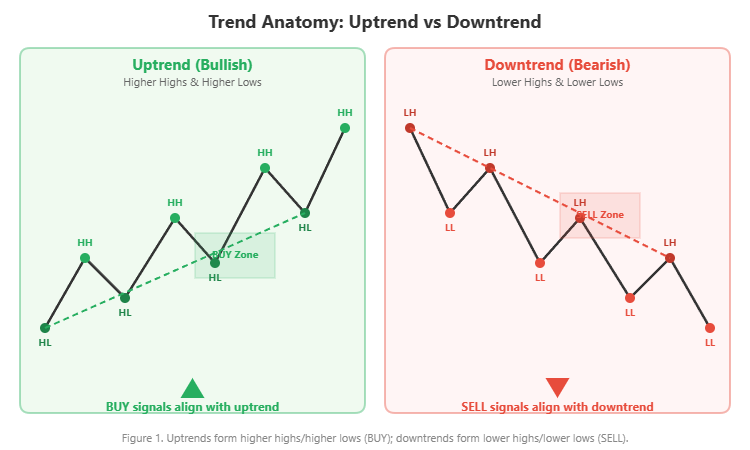
- Uptrend: price forms higher highs (HH) and higher lows (HL). Each rally pushes beyond the previous peak, and each pullback holds above the previous low.
- Downtrend: price forms lower highs (LH) and lower lows (LL). Each decline pushes below the previous trough, and each bounce fails to reach the previous high.
When this structure breaks -- for example, an uptrend that makes a lower low -- it signals that the trend may be reversing.
Figure 1. Uptrends form higher highs/higher lows (BUY); downtrends form lower highs/lower lows (SELL).
The Challenge
Identifying trends visually is straightforward on a single chart. The difficulty lies in scale. Modern traders monitor forex pairs, metals, indices, and crypto assets across multiple timeframes. The trend on EURUSD H1 may conflict with the trend on EURUSD D1. A BUY signal on GBPUSD M15 means nothing if the H4 trend is firmly bearish. The real skill in trend following is not recognizing trends -- it is systematically scanning for aligned signals across your entire watchlist.
The HalfTrend Algorithm Explained
The HalfTrend indicator is a trend-following tool designed to address a common frustration with traditional moving average systems: they are either too responsive (generating too many false signals during sideways markets) or too slow (confirming trend changes only after a significant portion of the move has already occurred).
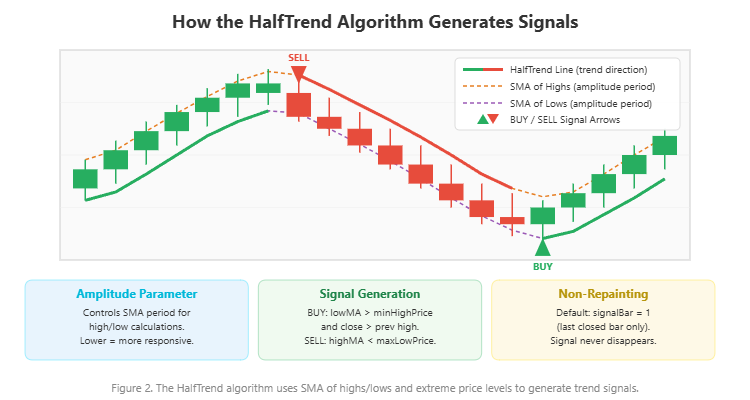
HalfTrend takes a different approach. Instead of a single moving average, it uses the simple moving average (SMA) of both the high and low prices over a configurable period called the amplitude. It then compares these smoothed values against the extreme high and low prices within the same amplitude window. A signal is only generated when both conditions align: the smoothed price crosses its reference level AND the close confirms by exceeding the previous bar's range.
How Signals Are Generated
The logic works as follows:
BUY signal: The SMA of lows rises above the minimum of recent high prices, AND the close exceeds the previous bar's high. This indicates that the market has transitioned from a downtrend to an uptrend with confirmed momentum.
SELL signal: The SMA of highs drops below the maximum of recent low prices, AND the close falls below the previous bar's low. This confirms a transition from an uptrend to a downtrend.
The Amplitude Parameter
The amplitude is the single most important parameter. It controls the SMA period used for both the high and low calculations:
- Lower amplitude (2-3): The SMA reacts quickly to price changes. More signals are generated, but some may be false during ranging markets. Best for scalping and short timeframes (M5-M30).
- Higher amplitude (4-6): The SMA smooths out more noise. Fewer signals, but each one tends to be more reliable. Better for intraday and swing timeframes (H1-W1).
This dual-confirmation mechanism -- requiring both the SMA crossover and a close-based breakout -- is what gives HalfTrend its edge over simple MA crossover systems. It produces fewer signals during choppy markets while still catching trend reversals relatively early.
Figure 2. The HalfTrend algorithm uses SMA of highs/lows and extreme price levels to generate trend signals.
Why Manual Trend Scanning Fails
Despite its effectiveness, trend-following trading has practical bottlenecks that limit most traders. The problem is not the strategy -- it is the execution.
Problem 1: Too Many Charts
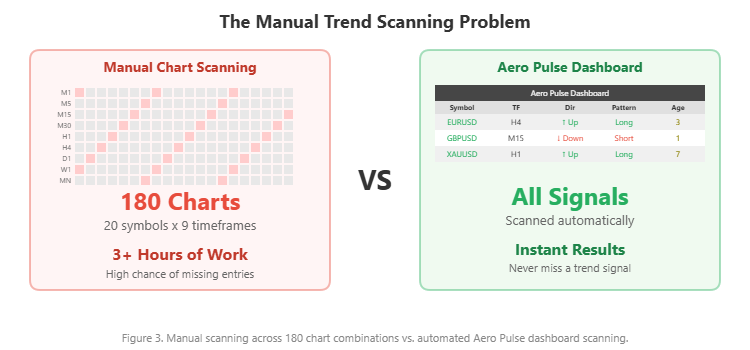
If you trade 20 symbols and monitor 9 timeframes (M1 through MN), that is 180 individual chart views. Even spending just 30 seconds per chart means 90 minutes of scanning. By the time you finish, the signals from the first charts you checked may have already played out. And during the scan, you are likely to miss signals on charts you skimmed too quickly.
Figure 3. Manual scanning across 180 chart combinations vs. automated Aero Pulse dashboard scanning.
Problem 2: Lagging or Repainting Indicators
Many trend indicators on the market use the current forming bar (bar 0) in their calculations. While the bar is still forming, the signal can appear, disappear, and reappear on every tick. The historical chart looks perfect because only the final result is saved, but in live trading these repainting signals lead to premature entries and frustration.
Problem 3: Conflicting Signals Across Timeframes
The M15 chart shows a BUY signal, but H4 shows a SELL. D1 shows no signal at all. Without a systematic way to view all timeframes simultaneously, traders often take low-timeframe signals that run directly into higher-timeframe resistance -- a recipe for repeated stop-outs.
Problem 4: Missed Entries
Even when you spot a legitimate trend signal manually, the time it takes to identify it, switch charts, evaluate the context, and prepare an order may cost you the optimal entry. HalfTrend signals are time-sensitive -- the trend move often accelerates within the first few bars after confirmation.
These four problems are why I built the Aero Pulse Dashboard. It addresses every one of them: automated scanning across all symbols and timeframes, non-repainting confirmed signals, clear multi-timeframe visibility in a single view, and instant alerts the moment a new trend signal forms.
Introducing the Aero Pulse Dashboard
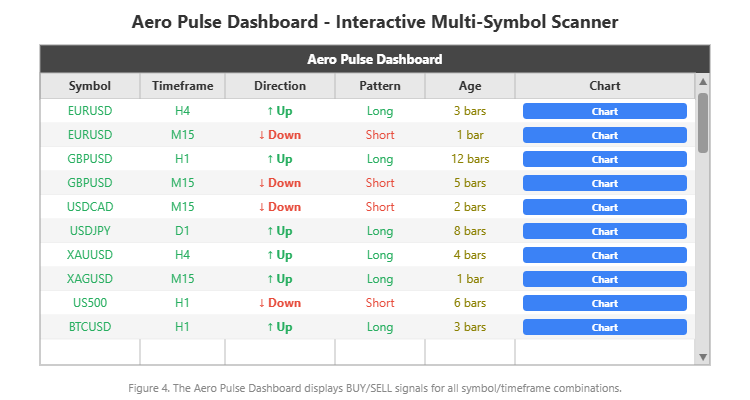
The Aero Pulse Dashboard is a multi-symbol multi-timeframe trend scanner built on the HalfTrend algorithm. It monitors up to 20 symbols across 9 timeframes and displays every active BUY/SELL signal in a single interactive dashboard panel.
Key features:
- HalfTrend-based detection: The proven HalfTrend algorithm with configurable amplitude
- Non-repainting signals: Default mode uses bar-close confirmation (signalBar = 1) -- signals never disappear once confirmed
- Interactive scrollable dashboard: Mouse wheel scrolling, draggable scrollbar, arrow buttons
- One-click chart navigation: Click any "Chart" button to instantly switch your chart to that symbol and timeframe
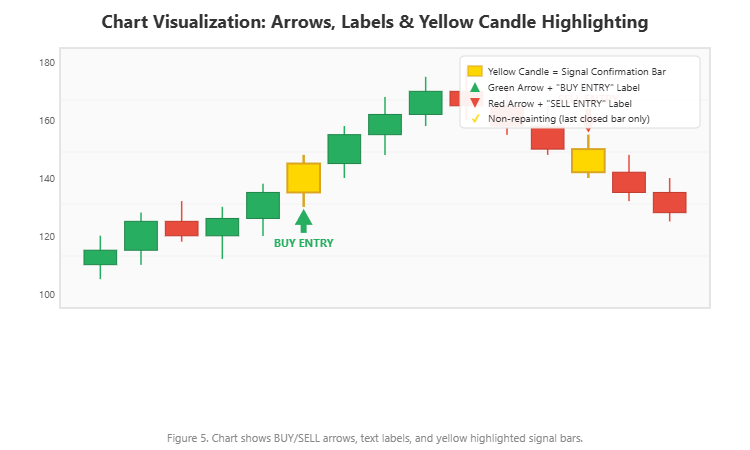
- Yellow candle highlighting: The exact signal confirmation bar is highlighted in yellow on the chart
- BUY/SELL arrows and labels: Clear "BUY ENTRY" and "SELL ENTRY" text labels with customizable arrow markers
- 4-channel alerts: Popup, sound, email, and push notifications with smart deduplication
- Broker prefix/suffix support: Works with any broker naming convention (xEURUSD, EURUSD.pro, etc.)
The indicator is available on the MQL5 Market with a free demo download:
- MetaTrader 5: Aero Pulse Dashboard MT5
- MetaTrader 4: Aero Pulse Dashboard MT4
Figure 4. The Aero Pulse Dashboard displays BUY/SELL signals for all symbol/timeframe combinations.
How the Detection Engine Works
Under the hood, the Aero Pulse Dashboard runs the HalfTrend calculation independently for each symbol/timeframe combination. Here is how the engine operates:
HalfTrend calculation: For each combination, it computes the SMA of high prices and SMA of low prices over the amplitude period. It simultaneously tracks the extreme high and extreme low within the amplitude window. A trend transition is detected when the smoothed moving average crosses the extreme price threshold AND the close confirms the breakout.
Signal confirmation: The engine checks the current trend direction against the previous bar's trend direction. When trend[signalBar] differs from trend[signalBar + 1] , a signal is generated. The direction (0 = Up/BUY, 1 = Down/SELL) and the number of bars since the last change (the "Age") are recorded.
Non-repainting mechanism: By default, signalBar = 1 , which means the indicator only evaluates the last fully closed bar. Since a closed bar's OHLC values never change, the signal calculation is permanent. Once a BUY or SELL signal appears, it stays. For aggressive traders who want faster entries, there is an option to use bar 0 (current forming bar), but this is clearly labeled as potentially repainting.
Efficient scanning: On MT5, the engine tracks the last bar time for each symbol/timeframe pair. Recalculation only occurs when a new bar forms -- not on every tick. This keeps CPU usage low even when monitoring 180 combinations.
Signal age tracking: The "Age" column in the dashboard shows how many bars ago the current trend direction began. A signal showing "1 bar" just confirmed on the last closed bar. A signal showing "45 bars" has been running for 45 bars -- useful for distinguishing fresh entry opportunities from established trends.
The Interactive Dashboard
The dashboard displays six columns of information for each signal:
| Column | Content | Purpose |
|---|---|---|
| Symbol | Instrument name (e.g., EURUSD) | Identifies the market |
| Timeframe | Period (e.g., H4, M15) | Identifies the chart timeframe |
| Direction | Up or Down with arrow icon | Shows current HalfTrend direction |
| Pattern | Long or Short | Confirms trade direction |
| Age | Number of bars since signal | Measures signal freshness |
| Chart | Clickable button | Navigates chart to this signal |
The dashboard is fully interactive. Use your mouse wheel to scroll through rows, or click the up/down arrow buttons on the scrollbar. You can also click and drag the scrollbar thumb for rapid navigation. The "Chart" button is the key workflow element: clicking it instantly switches your chart to the corresponding symbol and timeframe, draws BUY/SELL arrows at the signal locations, highlights the confirmation bar in yellow, and adds text labels.
Figure 5. Chart shows BUY/SELL arrows, text labels, and yellow highlighted signal bars.
Broker prefix and suffix settings ensure the dashboard works regardless of your broker's naming format. If your broker names EURUSD as "xEURUSD" or "EURUSD.pro", simply set the prefix or suffix parameter and the dashboard handles the conversion automatically.
4-Channel Alert System
The Aero Pulse Dashboard supports four independent alert channels:
- Popup alerts: On-screen notification within MetaTrader
- Sound alerts: Audible alert using a configurable WAV file
- Email alerts: Sent to the email configured in MetaTrader's Tools > Options > Email
- Push notifications: Delivered to the MetaTrader mobile app via MetaQuotes ID
Each channel can be enabled or disabled independently. The alert system includes smart deduplication: once an alert fires for a specific symbol/timeframe/direction combination, it will not repeat until the signal changes. This prevents alert flooding when monitoring many combinations.
The alert message format includes the symbol, timeframe, and direction, giving you all the information needed to evaluate the signal even from a mobile notification. A typical workflow: set up the dashboard on your VPS or home computer, enable push notifications, and receive real-time trend change alerts on your phone wherever you are.
Practical Trading Workflow
Here is a step-by-step approach to trading with the Aero Pulse Dashboard:
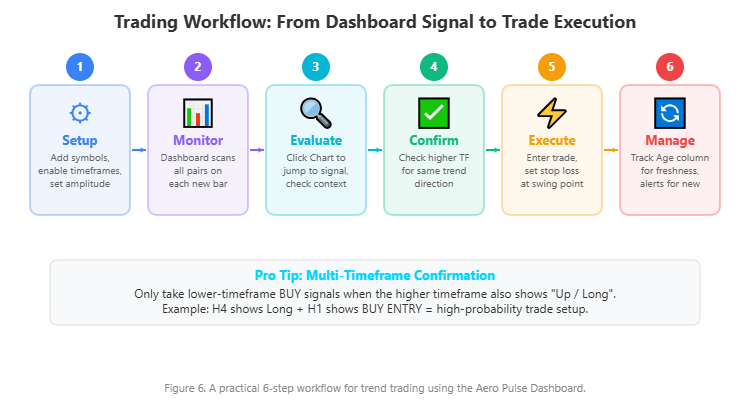
Step 1 -- Setup: Enter your symbols in the Symbols input (comma-separated, up to 20). Enable the timeframes you want to monitor. Set the amplitude based on your trading style (2 for scalping, 3-4 for intraday, 5-6 for swing). The dashboard will immediately begin scanning.
Step 2 -- Monitor: The dashboard updates automatically when new bars form. Watch for fresh signals -- rows where the Age column shows 1-5 bars are the most actionable.
Step 3 -- Evaluate: When you spot a fresh signal, click the "Chart" button to jump directly to that chart. Examine the price action around the signal: where are the nearest support/resistance levels? Is there a clean trend structure?
Step 4 -- Multi-Timeframe Confirmation: This is the critical filter. Check if the higher timeframe agrees with the lower timeframe signal. If the dashboard shows EURUSD H4 as "Up / Long" and EURUSD H1 also shows "Up / Long", that is a high-probability setup. If H4 shows "Down / Short" but M15 shows "Up / Long", the M15 signal is counter-trend and carries higher risk.
Step 5 -- Execute: Enter at the open of the next candle after confirming the setup. Place your stop loss below the most recent swing low (for BUY) or above the most recent swing high (for SELL). The yellow candle highlighting shows exactly where the signal confirmed, helping you identify the appropriate stop level.
Step 6 -- Manage: Use the Age column to track how long your signal has been running. Set alerts for your existing positions so you are notified if the trend direction changes.
Figure 6. A practical 6-step workflow for trend trading using the Aero Pulse Dashboard.
Real Trade Examples
The following screenshots show the Aero Pulse Dashboard in action across different asset classes and timeframes. Each example was captured from a live MT4 chart running the indicator.
EURUSD H4 -- Forex Major
The chart shows EURUSD on the H4 timeframe with both a BUY ENTRY and SELL ENTRY signal visible. The dashboard panel at the bottom displays EURUSD across multiple timeframes, with the H4 row highlighted and connected to the chart by a red line. The yellow candle marks the exact bar where the trend change confirmed. Notice how the BUY signal preceded a sustained upward move, while the subsequent SELL signal caught the reversal.

Figure 8. EURUSD H4 showing BUY and SELL signals with dashboard highlighting the active timeframe.
GBPUSD M15 -- Short-Timeframe Scalping
This M15 chart demonstrates the responsiveness of the HalfTrend algorithm at default amplitude 2. Multiple alternating BUY ENTRY and SELL ENTRY signals appear as the trend shifted direction repeatedly during the session. The dashboard shows GBPUSD M15 highlighted, confirming the signal visible on the chart. This type of rapid signal generation is ideal for scalpers who want to catch every swing within an intraday session.
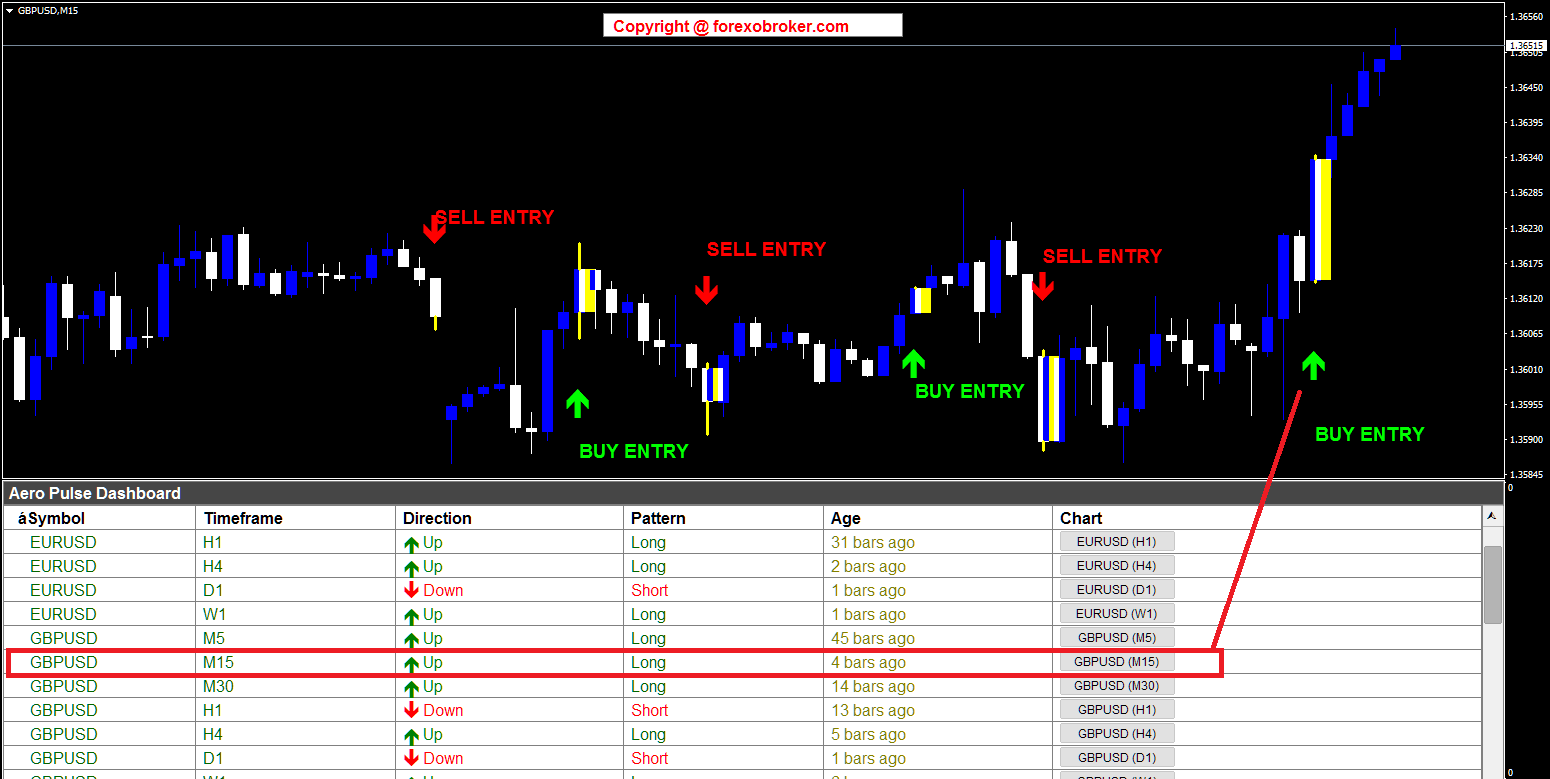
Figure 9. GBPUSD M15 with multiple alternating BUY/SELL signals for intraday scalping.
USDCAD M15 -- Trading a Downtrend
The USDCAD M15 chart shows signals within a broader downtrend. The dashboard displays the USDCAD M15 row highlighted, and the chart shows both BUY and SELL signals. In a scenario like this, the multi-timeframe confirmation workflow becomes essential: if the H4 or D1 also shows Down/Short, only the SELL signals on M15 should be traded. The BUY signals represent counter-trend pullbacks that carry higher risk.
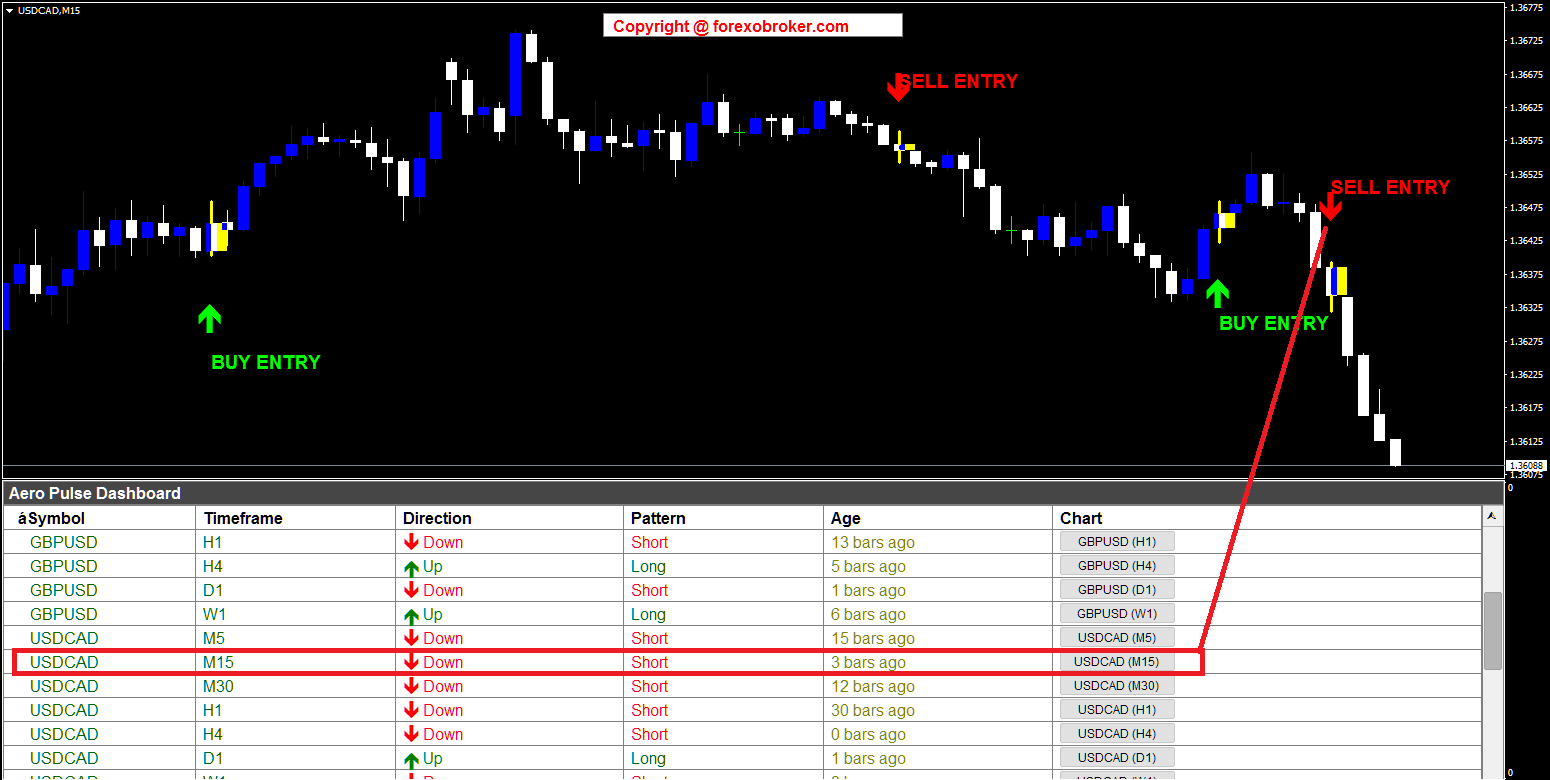
Figure 10. USDCAD M15 showing signals in a broader downtrend -- multi-TF filtering is essential.
XAUUSD H4 -- Gold
Gold (XAUUSD) on the H4 timeframe shows a SELL ENTRY at the top of a rally followed by two BUY ENTRY signals as gold reversed higher. The dashboard shows XAUUSD H4 highlighted. Gold's tendency for extended trends makes it an excellent instrument for the HalfTrend algorithm. The H4 timeframe with amplitude 2 captures the major swings while filtering out the noise that plagues shorter timeframes on volatile instruments.

Figure 11. XAUUSD H4 capturing major trend swings on gold with clean BUY/SELL signals.
XAGUSD M15 -- Silver
Silver (XAGUSD) on the M15 timeframe shows signals during an uptrend. The dashboard displays both US500 and XAGUSD rows, with the XAGUSD M15 row highlighted. The SELL and BUY signals mark short-term trend changes within the broader upward structure. Metals traders can use the Age column to differentiate fresh signals from mature ones that have already moved significantly.
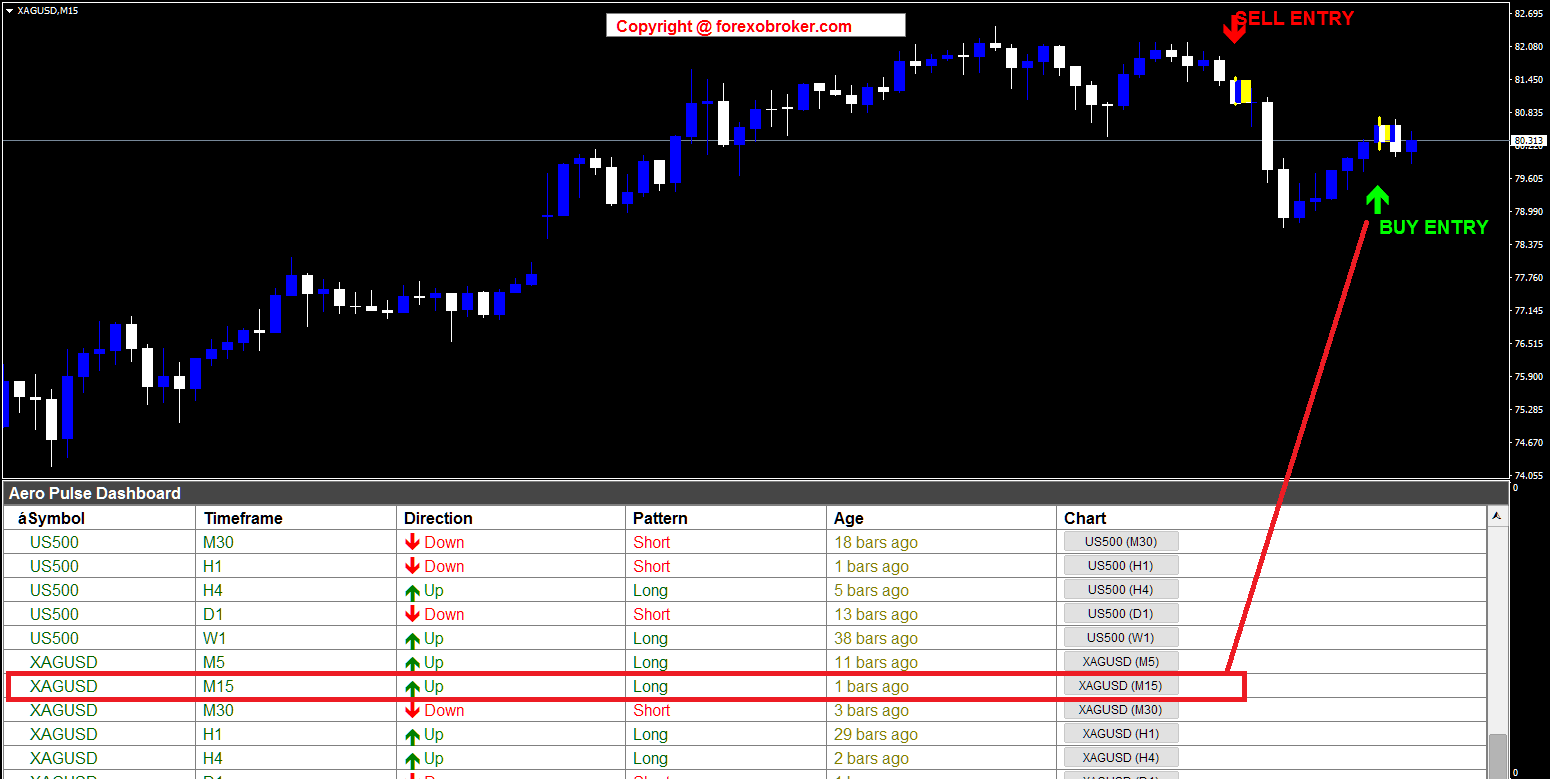
Figure 12. XAGUSD M15 signals in an uptrend -- Age column helps identify fresh vs stale signals.
US500 H1 -- S&P 500 Index
The US500 (S&P 500) on the H1 timeframe shows multiple BUY and SELL signals across a trending session. The dashboard displays the US500 H1 row highlighted. Index trading benefits from the non-repainting nature of the indicator: each signal locks in place after bar close, so there is no ambiguity about whether the signal existed at the time of trading.
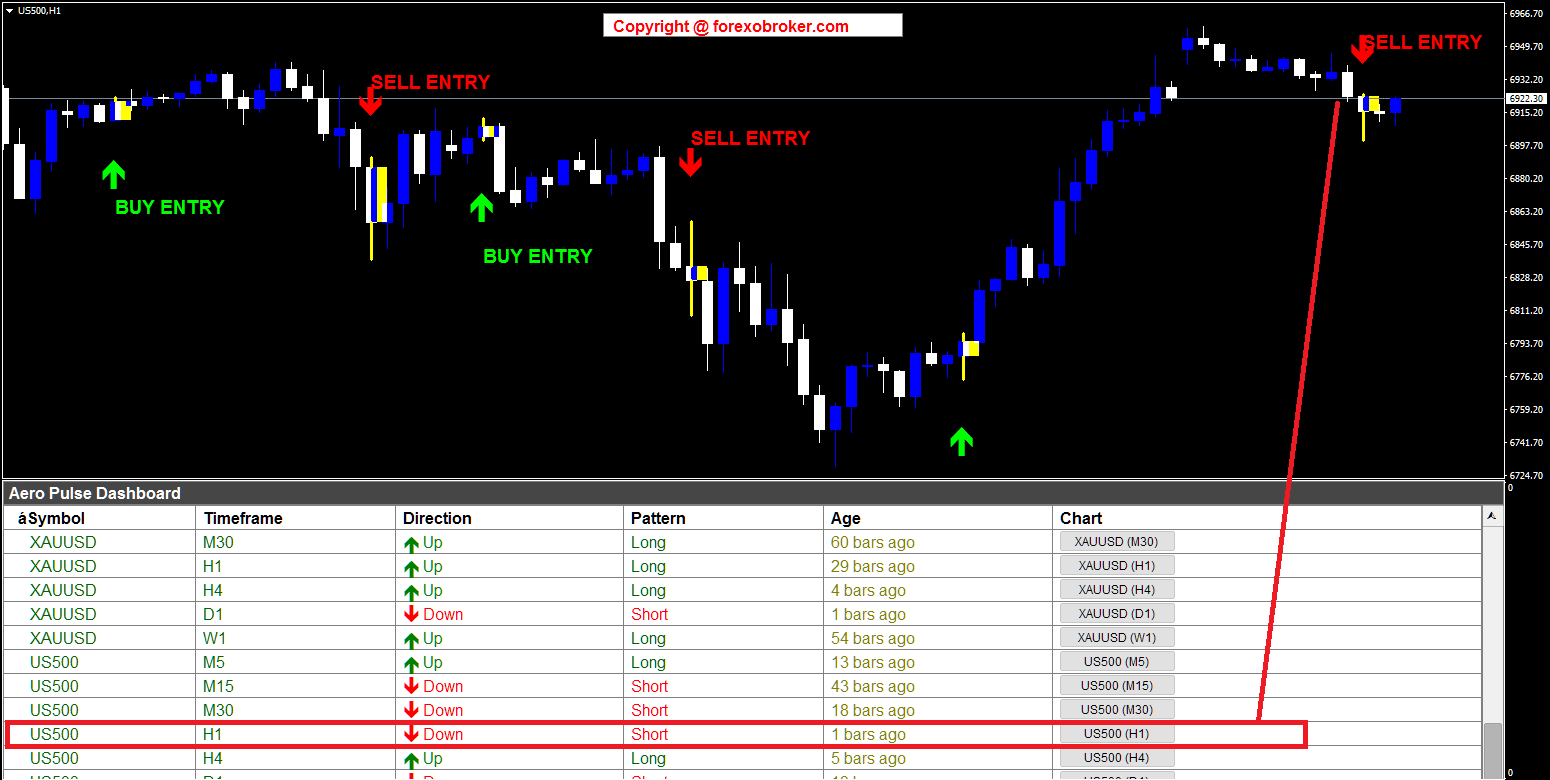
Figure 13. US500 H1 demonstrating non-repainting signals on a major stock index.
BTCUSD H1 -- Bitcoin with Multi-Symbol Monitoring
The BTCUSD H1 chart shows BUY and SELL signals on Bitcoin. The dashboard panel shows both BTCUSD and ETHUSD rows, demonstrating how the indicator monitors multiple crypto assets simultaneously. The one-click Chart button makes it easy to switch between BTCUSD and ETHUSD to compare trend alignment across the crypto market.
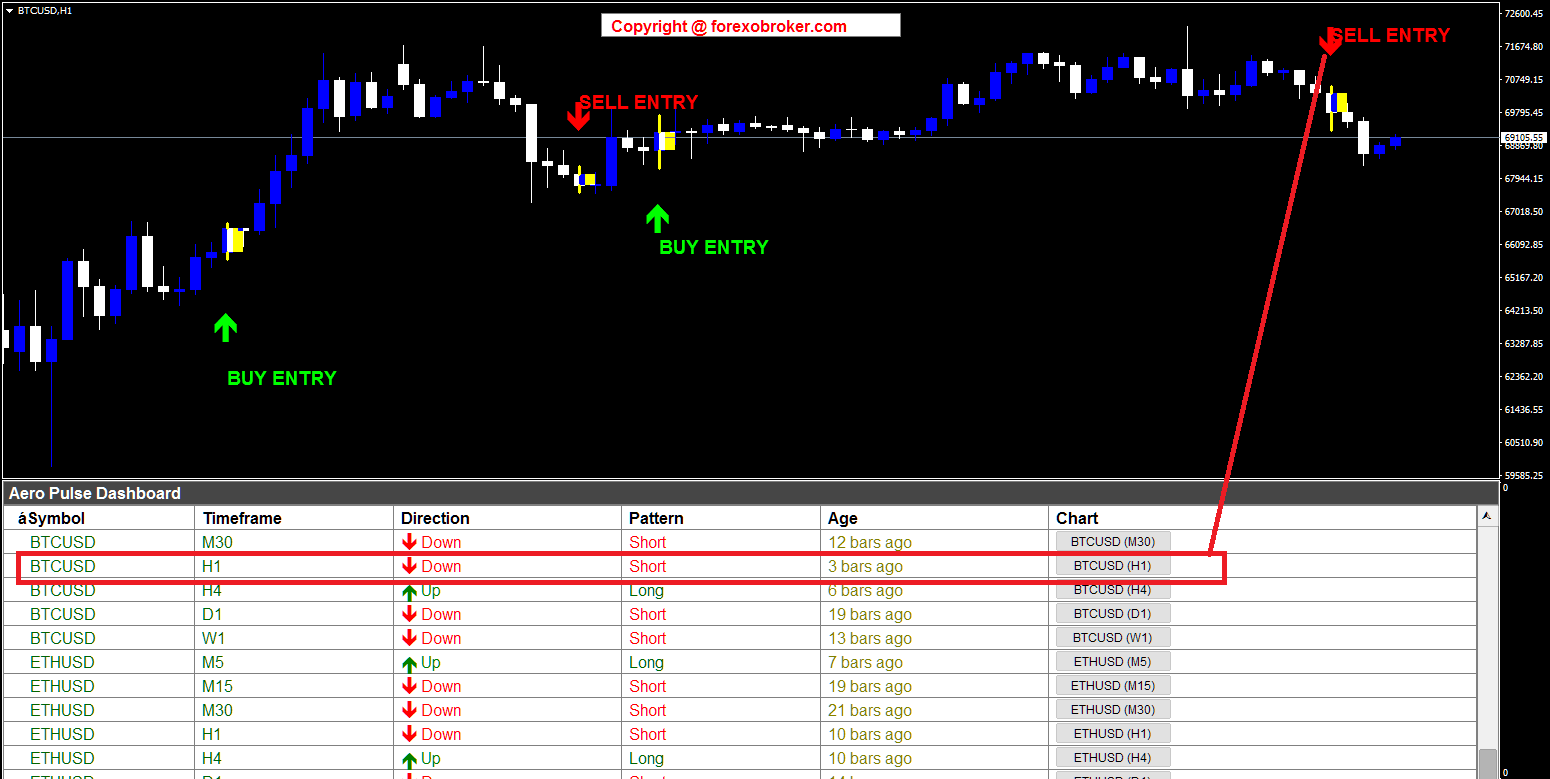
Figure 14. BTCUSD H1 with ETHUSD also visible in the dashboard for cross-crypto analysis.
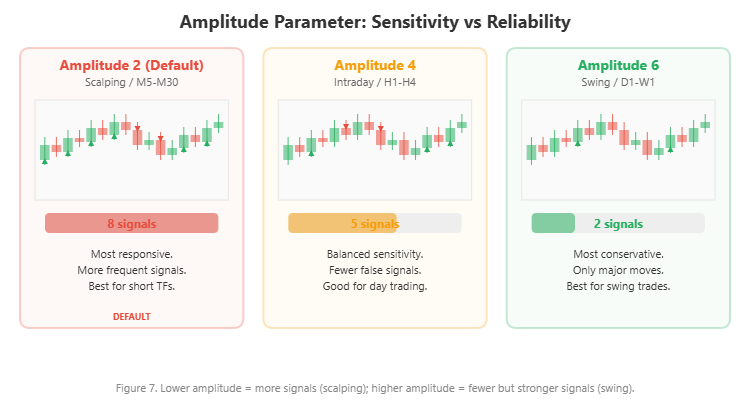
Amplitude Tuning Guide
The amplitude parameter is the single adjustment that determines how sensitive the Aero Pulse Dashboard is to trend changes. Here is a practical guide:
Amplitude 2 (Default)
The most responsive setting. The SMA uses a 2-period window, making it react quickly to price changes. Best for scalping on M5-M30 timeframes where you want to catch every swing. Expect more signals, including some that may reverse quickly in choppy markets.
Amplitude 3-4
A balanced setting that filters out more noise while still catching trend changes relatively early. Good for intraday trading on H1-H4 timeframes. This is a solid choice for traders who want fewer but more reliable signals.
Amplitude 5-6
A conservative setting that only triggers on more significant trend changes. Best for swing trading on D1-W1 timeframes where you want to capture major directional moves and hold positions for days or weeks.
Amplitude 8+
Very conservative. Signals are rare but tend to indicate major trend shifts. Suitable for position traders or for filtering on monthly charts.
How to Choose
Start with the default amplitude of 2. If you find you are getting too many false signals on your preferred timeframe, increase the amplitude by 1 and observe the difference. The goal is to find the setting where the signals align well with the tradeable moves on your specific instruments and timeframes.
Figure 7. Lower amplitude = more signals (scalping); higher amplitude = fewer but stronger signals (swing).
Parameter Reference Guide
Dashboard Settings
| Parameter | Default | Description |
|---|---|---|
| Symbols | EURUSD,GBPUSD,USDCAD,USDJPY | Comma-separated list (up to 20) |
| Symbol Prefix | (empty) | Broker prefix, e.g., "x" for xEURUSD |
| Symbol Suffix | (empty) | Broker suffix, e.g., ".pro" for EURUSD.pro |
| Enable M1-MN | M5-W1 enabled | Toggle each of the 9 timeframes on/off |
| Visible Rows | 12 | Number of rows visible in the dashboard |
Aero Pulse Settings
| Parameter | Default | Description |
|---|---|---|
| Amplitude | 2 | HalfTrend sensitivity (higher = fewer signals) |
| Max History Bars | 500 | Maximum bars to calculate per symbol/timeframe |
Chart Arrow Settings
| Parameter | Default | Description |
|---|---|---|
| Show BUY/SELL Arrows | true | Draw arrow markers on chart |
| Show BUY/SELL Text Labels | true | Draw "BUY ENTRY" / "SELL ENTRY" text |
| BUY Arrow Color | Lime | Color of BUY arrows |
| SELL Arrow Color | Red | Color of SELL arrows |
| Arrow Size | 4 | Arrow size (1-5 scale) |
| Arrow Gap | 0.8 | Distance from candle (ATR multiplier) |
| Label Gap | 1.8 | Text label distance (ATR multiplier) |
| BUY Arrow Wingdings | 233 | Wingdings character code for BUY arrow |
| SELL Arrow Wingdings | 234 | Wingdings character code for SELL arrow |
Alert Settings
| Parameter | Default | Description |
|---|---|---|
| Alert Title | Aero Pulse Dashboard | Title shown in alert messages |
| Popup Alerts | true | Enable on-screen popup notifications |
| Sound Alerts | true | Enable audible alerts |
| Sound File | alert2.wav | WAV file for sound alerts |
| Email Alerts | false | Enable email notifications |
| Push Notifications | true | Enable mobile push via MetaQuotes ID |
| Alert on Current Bar | false | Use bar 0 instead of bar 1 (may repaint) |
Tips and Best Practices
Higher timeframe = more reliable signals. An H4 BUY signal is inherently more reliable than an M5 BUY signal because it reflects a larger structural trend change. Use lower timeframes for entry timing, not for trend direction.
Multi-timeframe confirmation is essential. The most powerful filter available in the Aero Pulse Dashboard is simply checking that the higher timeframe agrees with the lower timeframe. Only take M15 BUY signals when H4 also shows Up/Long.
Use the Age column wisely. Signals showing 1-5 bars are fresh and offer the best entry opportunities. Signals at 20+ bars are established trends -- good for confirming direction, but the optimal entry point may have already passed.
Avoid trading against major news events. The HalfTrend algorithm, like all technical indicators, cannot predict fundamental shocks. Reduce position sizes or avoid new entries during major economic releases.
Match amplitude to your instruments. Amplitude 2-3 works well for liquid forex pairs on short timeframes. For volatile instruments like gold or crypto, consider amplitude 4-6 to filter out whipsaws. For indices on daily charts, amplitude 5-6 provides clean swing signals.
Yellow candle = your stop level reference. The highlighted yellow candle marks the exact bar where the trend confirmed. Place your stop loss just beyond the high or low of this candle (or the nearest swing point) for precision risk management.
Non-repainting by default, but current-bar mode exists. The "Alert on Current Bar" option enables faster alerts using bar 0, but signals may change before the bar closes. Use this mode only if you understand the trade-off and actively manage the additional risk.
Conclusion
Trend-following remains one of the most consistently profitable approaches in technical analysis. The challenge has never been the strategy itself -- it has been the practical difficulty of scanning multiple markets across multiple timeframes efficiently and without missing signals.
The Aero Pulse Dashboard solves this by applying the HalfTrend algorithm to your entire watchlist simultaneously. It delivers non-repainting BUY and SELL signals in a clear, interactive dashboard with one-click chart navigation, yellow candle highlighting for precise entry timing, and 4-channel alerts so you never miss a trend change.
Whether you are scalping forex on M15, swing trading gold on H4, or monitoring crypto and indices across all timeframes, the Aero Pulse Dashboard gives you a systematic edge.
Download the free demo and try it on your own charts:
- MetaTrader 5: Aero Pulse Dashboard MT5
- MetaTrader 4: Aero Pulse Dashboard MT4
Developed by Forexobroker


 Trading Guide")
