
Advanced Optimization Report for MT5 - Detailed description and samples

Detailed description and samples for Advanced Optimization Report
This description is available in Russian.
Optimizing trading strategies in Meta Trader 5 (MT5)? Use an advanced and more visual representation of optimization results with the benefits of interactive HTML pages.
Briefly about the benefits:
- Filters by any criterion and threshold (min/max).
- Easy-to-read and understand graphs.
- 43 optimization criteria instead of 8. Everything that is recorded in .opt files is available.
- If you have access to the EA code, you can add balance and equity charts for each pass and 38 custom optimization criteria (Sharpe ratios, Sortino ratios, mathematical expectation in pips, standard deviation, and more. You can add custom-programmed criteria).
This report should be viewed by anyone who optimizes trading strategies.
Samples:
- Shows all 43 optimization criteria available in the .opt file - Open
- The same report with an additional code that adds mini-charts for balance and equity, as well as 38 additional optimization criteria (Sharpe ratios, Sortino ratios, mathematical expectations in pips, standard deviation, and more. You can add custom-programmed criteria) - Open
- Optimization with a forward test and saving of charts for the Moving Average Expert Advisor from the instructions for adding functions to save charts and statistics to any Expert Advisor - Open
For more information:
Filters:
MT5 has only 5 filters for specific thresholds:
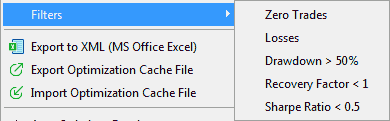
In the "Advanced Optimization Report", you can apply filters to all parameters and criteria. You can apply >= and/or <= (min, max) to each parameter, and when you enter a value and press Enter or lose focus on the input field, the result table will be rebuilt, the graphs will be redrawn, and the statistics (min, max, avg, and median) will be recalculated. Only the remaining rows will be used in the new calculation.
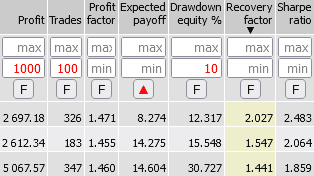
Sorting:
Any column can be sorted. To do this, click on its name. In the screenshot above, the column is sorted by Recovery factor. Repeated clicks change the sorting order (ascending/descending). The sorted column is highlighted in color.
Filtering/hiding rows:
- Additional sorting/filtering: If you click the "Show sorting/filtering buttons" button at the bottom of the page, the [F] buttons will appear in the table header. If you click the [F] button in any column, the first row will be taken as the maximum in the column, and only rows that are less than the previous values in that column will be displayed. The remaining rows will be hidden. If you click again, the rows with values greater than the previous ones will be displayed. This is demonstrated in the screenshot above. If you click a third time, the filter will be removed.
This sorting/filtering can be done on multiple columns at the same time. - If you click on the "Hide Rows" button, the [-] buttons will appear in the Pass column for each row. Clicking on these buttons will hide the rows. To show all rows again, click on the "Show All Rows" button.
When you reload the report, all hidden rows will reappear. - If you click the Show Passes button, two text boxes will appear. The Current passes box shows all the passes that remain in the table after applying filters and manually removing rows. Once you have a list of the best passes, you can copy and paste it into the Select Passes box. You can then remove all the filters, but the rows in the Select Passes box will be highlighted in blue. If you click the "Show only selected" button, only the selected rows will be displayed, and you can further filter them as needed. You can save the list to a text file and view it again when you open the report by pasting it into the Select Passes box.
1D graphs
The graphs for the optimized parameters have been made more user-friendly.
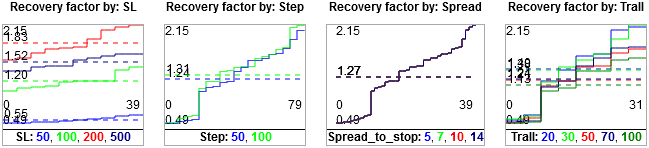
As an example, let's optimize and compare the Recovery factor report graphs.
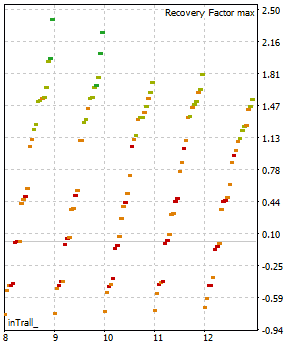
| MT5 | Advanced Optimization Report |
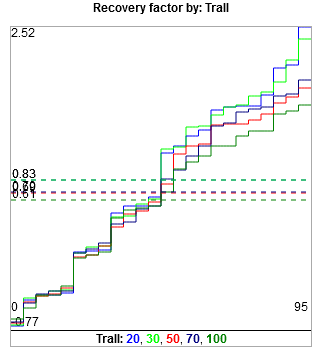
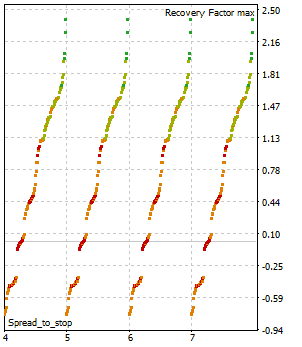
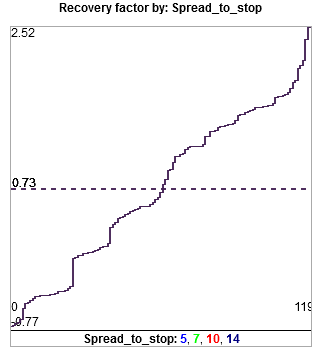
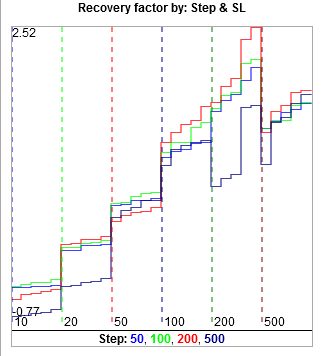
| Shows values spaced out along the x-axis, i.e. separately. It is difficult to compare lines that are 100-1000 pixels away from each other. | Shows all lines on the same graph in the same scale, but in different colors, so they can be distinguished from each other and compared. |
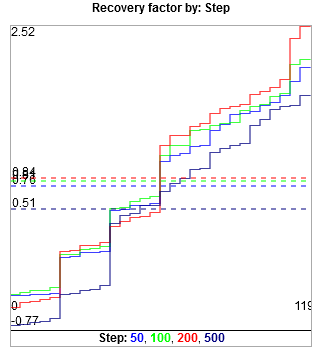
| | 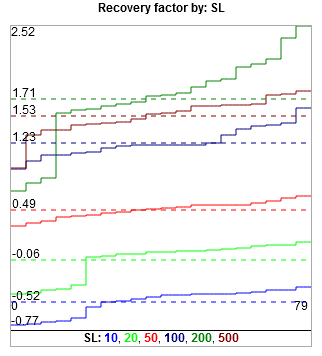 The dotted lines of the average values show that the SL value of 200 (the dark green line) is the best on average, as it is the highest. Its maximum value is also higher. There may be cases where the value with the highest maximum does not have the best average, due to a single sharp outlier. In this case, you need to decide what is more important to you. |
 It is more difficult to determine which one is better. | The averages for Step 100 and 200 are almost the same. It is possible that 100 is better, as 200 has two separate outliers. Without them, the average would be lower. In this example, 100 also has two outliers, but there may be cases where the outliers are truly isolated. |
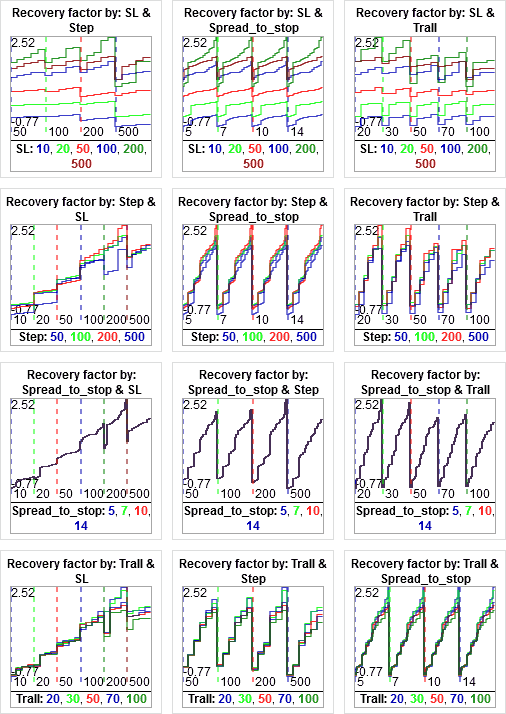
| | The exact alignment of the lines is immediately noticeable. The spread parameter has no impact on the result, and it can be excluded from future optimizations. Or, on the contrary, explore in a wider range, for example up to 100. |
 |  |
Features:
- The average value of each line is shown as a dotted line of the same color. The maximum or minimum values are not always the best. The average will show you how much one parameter value is generally better than the others. Choose what is most important to you. The evaluation tool is provided.
- To view specific parameter values in detail, you can filter them. For example, you can select SL above 100 or below 1000, or between 100 and 500, and the graphs will be redrawn to show only the selected values. Others won't bother you. This is especially convenient if you have more than 10 different values.
MT5 does not provide this feature.
All SL options SL from 100 to 500 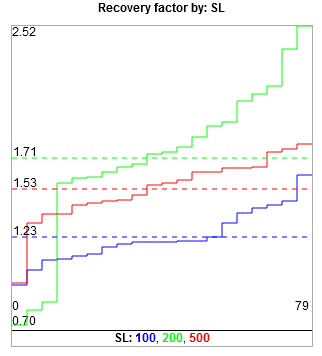
- Similarly, you can apply filters to any criterion.
For example, profit is greater than 1000, there are more than 100 trades, and the drawdown is less than 10%. This is very convenient.
All SL options The profit is more than 1000,
the trades are more than 100
and the drawdown is less than 10%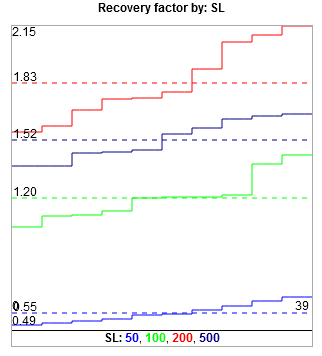
- In MT5, you can only view the optimized parameters one at a time. Here, you can view all of them at once, which is also convenient for analysis.
The sizes of the graphs can be changed. In the screenshot, the width has been changed from 300 to 140 pixels. - When you load the graphs, they display the profit on the Y-axis. You can display any evaluation criterion by sorting the graphs by the desired column.
An important difference between these graphs and MT5 is that if the parameter being optimized is an enumeration (enum), MT5 displays its ordinal number (e.g., 1,2,3,4,5,6,7,8,9), which makes it difficult to determine the actual value (5,10,20,50,70,100,200,500,1000). These enumerations are useful for proportional changes in values, such as SL/TP.
If after 10, it is rational to check the value of 20, then after 500, it is silly to check 510,520... optimization with a step of 10 from 10 to 1000 will take 10+ times longer than by enumeration. "Advanced Optimization Report" shows the actual value, not its ordinal number. This is one of the main reasons for creating this version of the optimization report.
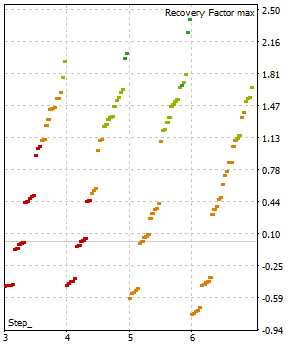
Genetic optimization
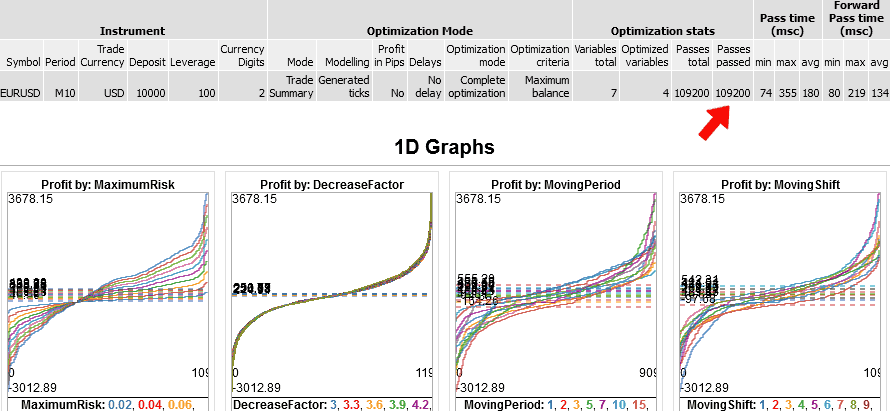
The examples above are made by full optimization - in it the number of passes of each parameter is equal to the number of its possible values. In genetic optimization, the number of passes will be different. For example, so:
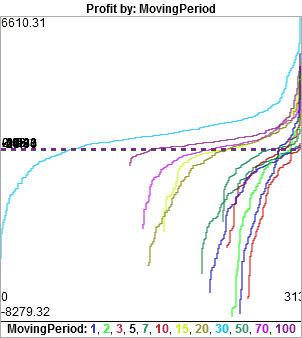
MA Period = 30 showed the highest profit, so it was studied by the optimizer 2-5 times more than the other parameters.
2D graphs
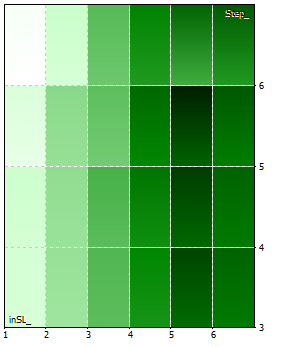
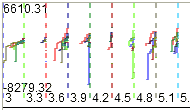
The graphs for all pairs of optimized parameters are also made more visual. Instead of a mosaic with colored rectangles, mini graphs are drawn. The first parameter in a pair is represented by one of the colored lines (for example, there are 4 lines in total), and the second parameters are separated by vertical dotted lines on the X-axis (for example, there are 6 columns). In total, we have 4 lines in 6 columns = 24 mini graphs. In MT5, this is drawn as 24 colored rectangles.
| MT5 | Advanced Optimization Report |
| Shows a mosaic of 24 rectangles with changing colors. Each pair can be represented in two ways. | Shows all the lines on the same graph in the same scale, but with different colors, so they can be distinguished from each other and compared. Each pair can be represented in two ways, and one of them is usually more convenient. |
| The first option: | The first option: |
The second option: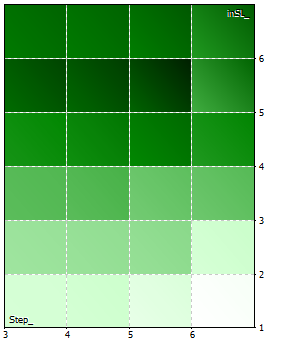 | The second option: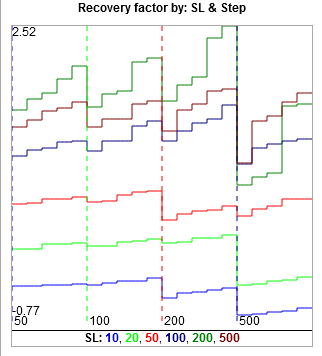 We also have 24 mini graphs, but there is no sequential movement, which is less convenient. |
In MT5, you can only view one pair of optimized parameters at a time. Here, you can view all of them at once, which is also convenient for analysis. You can choose the most convenient graph from the pair.
If there are many columns on a 2D chart and the width is small, it becomes difficult to make out anything. The example is created by the genetic optimization of the MA Expert Advisor, which you can find on the instructions page. There are 91 columns shown here:
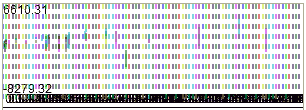
To make everything visible, simply increase the width of the chart. Here is the same example with a width of 2000 pixels:
Now, both the column values and the chart lines are clearly visible.
Graph management:
- You can change the appearance of the graph lines using the Stairs/Lines, Crisp/Blurry, and Bold switches. The width and height fields can be used to resize the graph window.
- If you click on any graph, it will open in a large window in Google Charts, which have a zoom feature with the mouse wheel and show accurate values on the Y-axis.
Advanced Optimization Report Google Chart 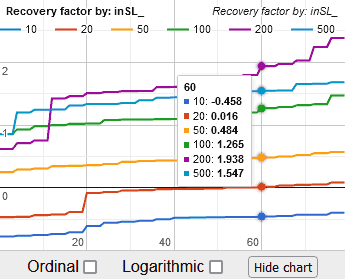
- The built-in graphs in the program can be displayed on a computer without an internet connection. Google Charts will only display with an internet connection.
Optimized variables statistics:
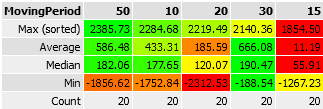
Under the 1D and 2D graphs, there are buttons labeled "Show Min/Max/Avg/Med". If you click on these buttons, you will see tables with statistics for the currently selected optimization parameter or evaluation criterion.
You will see the maximum, average, median, and minimum values, as well as the number of passes each value was used. The rows are sorted by Average. The average value is also displayed on the 1D graph.
Based on the average or median value, it is possible to evaluate which of the variants of the optimized parameter or criterion gives the best strategy results on average. For example, you can choose the maximum average for profit and the minimum average for drawdown, and so on.
You can sort the values by any row. The maximum value has a green background, and the minimum value has a red background.
Sample:
Detailed report:
Gets optimization data from the .opt file. It contains a lot of information that you don't see in the MT5 report. "Advanced Optimization Report" will show you everything in HTML format in your browser.
It displays 8 standard strategy optimization criteria, as in MT5.
Additionally, there are 35 other strategy evaluation criteria divided into groups: Standard criteria, as in MT5, Profit/Loss, Balance, Equity, Trades, Consecutive, and Other.
| Additionally, criteria have been added that can be calculated from other criteria in the .opt file:
|
Additional control buttons are placed under the detailed report table:
- If you click on the "Edit Columns" button, you can hide the columns that you are not interested in for evaluation. This will make the table take up less space and only show the necessary information.
- When editing columns, you can mark them manually or use the Check All or Uncheck All buttons.
The string with the numbers 10001011010... is a list of selected columns, and it can be exported to an Expert Advisor so that only the desired columns are selected for new reports. Alternatively, you can copy and paste this string into another report.
Other features:
- If a forward test has been added to the optimization, its values will be displayed in the second row of each cell. This is more convenient than in MT5, where there are two separate reports. Forward test values are not included in calculations, graphs, sorting, or filtering. However, you can create a separate report by selecting only one forward test file.
- Unfortunately, the complex criterion has not been added to the .opt file and cannot be shown until it is added to the .opt file by the Meta Quotes developers. You can now display it in the report by adding an additional code to your Expert Advisor, if you have access to its code (see details below).
- The values are formatted in an easy-to-read monetary format. Instead of 123456789.01, in which it is difficult to understand how many thousands and millions there are (you need to count the number of digits), you will see 123 456 789.01 here it is immediately visible.
- Pagination is programmed for the table rows. You can display from 5 to 10,000 lines on a single page.
- When you click on any cell in the table, the row and column are highlighted in color. In this case, the settings of the selected passage are copied to the clipboard. You can go to the settings tab in the tester and press Ctrl-V there, the settings will be applied.
- Additionally, in the Pass column, the pass number is made by a button, when clicked, the pass_XX.set settings file will be downloaded, then it can be saved to the desired location, for example, to the folder with the HTML report
Below are the program's features if you have access to the Expert Advisor code and can add additional functions to it.
Instructions for adding functions to save charts and statistics.
Mini balance and equity charts:
If you have access to the EA code, you can add functions that will save balance and equity charts, as well as calculate additional optimization criteria. Mini-charts will be displayed in the report for each pass, so you don't need to run single tests for each option you're interested in. Once you've selected the best options in this report, you can test them individually in the MT5 tester. This will save you a lot of time.
The chart settings block:
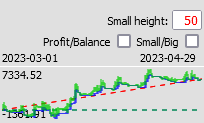
- The Small height field changes the height of the mini-charts.
- The Small/Big checkbox increases all charts to 255 pixels.
- The Profit/Balance checkbox switches the values to profit or balance.
- The testing period on the chart is also specified in this block.
Features:
- Balance and equity charts show trades on a time scale, rather than with equal intervals between trades (as in the MetaQuotes tester). It happens that there are 2 months between trades, but they are shown side by side as if there are 5 minutes between them.
Example:
50 of the same trades are placed on both charts.
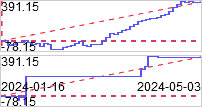
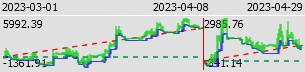
The upper chart is built with a uniform step between trades and looks promising.
The lower chart is built on a time scale and shows that the expert traded a little at the beginning and a little more at the end.
From the time-based chart, it is immediately clear that there will be long periods of inactivity in this strategy. This type of trading is not as interesting as it seemed from the uniform-step chart. - The graphs are initially displayed at a height of 50 pixels. You can adjust the height of the charts in the Small height field.
- When you click on a graph, it expands to a height of 255 pixels. This is the maximum resolution, as each point is encoded as a single byte with 255 height options for compactness. When you click on the graph again, it collapses.
- The graphs display the minimum and maximum values of profit or balance.
- If the optimization was performed with a forward, it will be placed to the right of the backtest graph. Its width will be proportional to the testing period. For example, if the forward is 1/3 of the total testing period, then the backtest will take up 2/3 of the width. This means that the time scale will be the same for both graphs.
- You can choose the width of the graph in the Pixels in balance and equity charts parameter before starting the testing.
It is recommended to use a width of 200-300 pixels, as this is sufficient for visual perception, as shown in the examples. However, you can also use a width of up to 2 000 pixels, but this will result in a 10-fold increase in the file size. Width greater than 2 000 will be reduced to 2 000.
If you have more than 100 000 optimization passes, then to save disk space, you need to reduce the width of the graphs to 100 or 50 pixels.
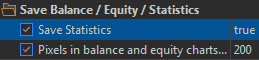
- You can cancel saving statistics and balance and equity charts by setting the Save Statistics parameter to false.
Collecting statistics and graphs does not slow down optimization:
- Optimization without collecting statistics and graphs: optimization done in 1 minutes 28 seconds
- Optimization with collecting statistics and graphs: optimization done in 1 minutes 29 seconds
The slowdown is less than 1%. - .opt files from MT5 and the chart file take up some disk space. When you create a report, they are not deleted, but moved to the report folder for reuse, for example, to view a separate forward test report. If you have many optimizations or large chart widths, you may need to manually delete unnecessary files to free up disk space.
Additional optimization criteria
The added code allows you to add additional optimization criteria to the report:
- Complex optimization criterion (it is not available in the .opt file, but only through functions that can be added to the code)
- Coefficients: Sharpe, Sortino, Titov's test coefficient, and standard deviation calculated using logarithms of price deltas on the M1 timeframe (as in MT5). Additionally, they are calculated using price deltas. These coefficients are only calculated when equity data is collected on each tick (this is optional).
Their calculations were disclosed in the article. The calculated Sharpe coefficient is almost identical to what MT5 shows. The Sortino coefficient and standard deviation are calculated in the same function and copied into the report as is.
The experimental Titov coefficient is described on the forum. I found it interesting to add to the report. - Z-score, Money Compounding vs 1 lot, LR Standard error, LR Correlation calculations are copied from the article https://www.mql5.com/en/articles/1492
R2 = LR Correlation ^2 .
Profit Stability is described in the article https://www.mql5.com/en/articles/3642 - Deviation from Line, Deviation from Line Negative only, Deviation from Line in Points, Deviation from Line Negative only in Points - the maximum deviations of the price from the straight line between the first and last trade. The line is calculated with an equal step between trades, as in MT5.
Simply Deviation from Line - takes into account deviations both down and up from the straight line. Negative only - takes into account only drawdowns below the line.
Plus 2 similar criteria in points - they will differ from the criteria in money if trading is done with different lots (reinvestment, pyramid, martingale, etc.). - Criteria in points: Profit, Markup, Profit / Markup, Expected PayOff, Expected Markup, Min, Max drawdown, Drawdown % in Points, Standard error.
They are calculated as if you were always trading with one lot.
When trading with the same lot, the sorting criteria are the same as Profit, Expected PayOff, Balance min, Max drawdown balance, but they will differ by a factor of 100 if your volume is 0.01.
When trading with different lots, they will still show as if you were trading with one lot.
For example, when trading with Martingale, it may happen that the profit in points is negative, and the gain is achieved only by increasing the lot size and the risk of trading.
The comment on Drawdown % in Points: is that, unlike Drawdown % of Balance, it is calculated based on the previous maximum profit in points, rather than the balance. Since it is impossible to calculate the initial balance in points when trading with different volumes, the calculation is based on the maximum profit. - The number of repeated losses is calculated separately for Buy and Sell.
- Total: Trading result (the result of transactions excluding swaps, commissions and fees),
Swap, Commission, Fees - their sum is equal to Markup. This division can be useful for analyzing expenses.
Trading result / Markup to estimate how many times you earn more than you spend.
Trading result - Markup = Profit from the first column of the main criteria.
Total: Volume and Turnover. They may be interesting for evaluating rebates. - You can also add all 43 parameters similar to those in the MT5 .opt file. These parameters are useful if you are optimizing in mathematical calculation mode.
For them:- Recovery factor is calculated by equity when collecting statistics on each tick.
If statistics are not collected on each tick (this is optional), then the Recovery factor is calculated based on the balance. In this case, the Drawdown equity %, Sharpe ratio, and all 5 equity parameters will be equal to 0. - The maximum drawdown of equity in the built-in calculation is lower (worse) than in the MT5 report. It is assumed that MT5 can check this not on every tick, but on each M1 or in some other way.
- Recovery factor is calculated by equity when collecting statistics on each tick.
Other optimization criteria may be added in future versions. If you have an interesting criterion with implementation code, please suggest adding it through the feedback form.
How to use Advanced Optimization Report
Launch the "Advanced Optimization Report" Expert Advisor:
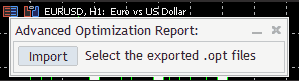
- Click the Import button. In the window that opens, copy the path to the folder from the address bar.
Example:
- In the tester window, right-click, select Export Optimization Cache File, and paste the previously copied path into the address bar.
This should only be done the first time, then the tester will remember this folder for export.
Click Save - In the import window (from step 1), select the exported .opt file (there will be two files if you optimized with forward, select both).
If you recorded charts using the code added to the Expert Advisor, select the Charts.opt file as well.
A window will appear:
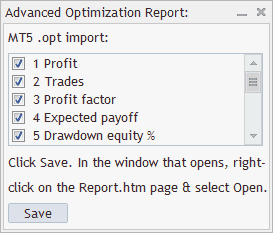
You can uncheck the boxes for optimization criteria that you do not want to display. When you uncheck them, they will be saved, but they will be hidden when you first load the report. You can show them by clicking the Edit Columns button in the report.
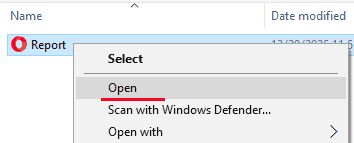
Click the Save button. - In the window that opens, right-click on the HTML page Report.htm, and select Open. The default browser will open the report page.
- When you return to the Expert Advisor, close the window that opened, otherwise it will not respond to mouse clicks.
- If you add an indicator from the page https://www.mql5.com/en/blogs/post/766737, then the report will open right in the browser. It is more convenient and faster (without the actions described in paragraphs 4 and 5).


")