
Optimizing a strategy using balance graph and comparing results with "Balance + max Sharpe Ratio" criterion
Contents
- 1. Introduction
- 2. How to calculate a trend line for a balance graph?
- 2.1. Algorithm for calculating the optimization criterion
- 2.2. Introducing the first TrendProfit variable
- 2.3. ProfitStability variable
- 3. Working with the ALGLIB library
- 4. Including the CBalanceRegression class
- 4.1. Expert Advisor generated by MQL5 Wizard
- 4.2. Expert Advisors based on the standard MACD Sample and Moving Average
- 5. Optimization on EURUSD H4, no forward test
- 5.1. EA test balance regression.mq5, EURUSD H4, no forward test
- 5.1.1 Test 1
- 5.1.2. Comparing test speed in a home local network of two PCs and in the cloud
- 5.1.3. Test 2
- 5.1.4. Test 3
- 5.2. Moving Average balance regression.mq5, EURUSD H4, no forward test
- 5.3. MACD Sample balance regression.mq5, EURUSD H4, no forward test
- 6. Optimization on EURUSD M15 with forward test
- 6.1. EA test balance regression.mq5, forward test
- 6.2. MACD Sample balance regression.mq5, forward test
- 6.3. Moving Average balance regression.mq5, forward test
- 7. Conclusion
1. Introduction
During my work, it dawned upon me that it is already insufficient for the balance graph to grow on history. In addition, we need it to be smooth enough. In other words, the mean-square deviation from a trend line should be as small as possible. This means that we also want stability apart from profit. To achieve it, let's check yet another optimization parameter: balance graph curve and the variance of deviations of its values from the regression line.
We will use the ALGLIB numerical analysis library to obtain the linear regression equation ratios and some other statistical characteristics.
2. How to calculate a trend line for a balance graph?
We need to build a trend line for the balance graph so that the sum of squares of deviations from the line is minimal.
The ratios of the equation y=ax+b for calculating the line are found by the standard least square (LS) method. I am not going to provide all necessary math equations. Instead, I am going to use a ready-made function in the ALGLIB library adapting it to our needs.
2.1. Algorithm for calculating the optimization criterion
Let's have a look at an example of five trades:
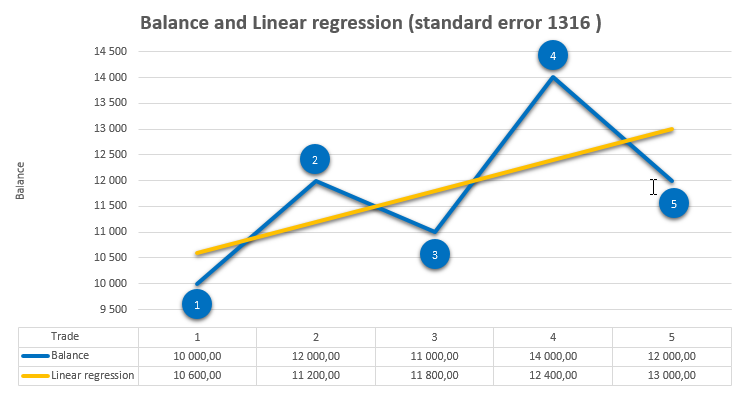
Pic. 1. Balance graph and linear regression
These five trades form "Balance" 1-2-3-4-5 balance line. The Linear regression line is calculated and plotted using the the least square method (calculations are performed using the ALGLIB numerical analysis library).
2.2. Introducing the first TrendProfit variable.
It stands for profit per trade for the plotted regression line:
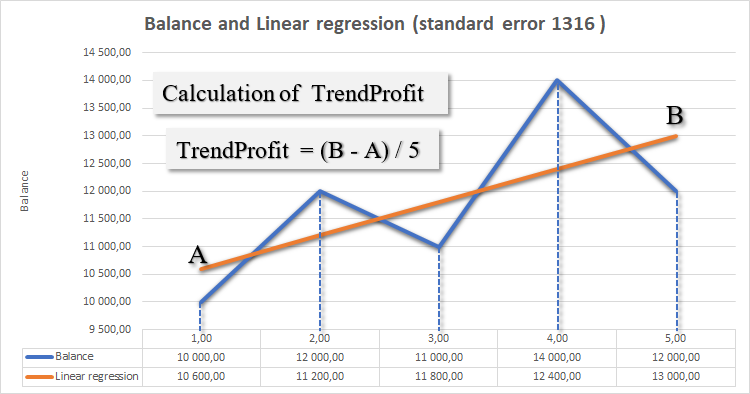
Pic. 2. TrendProfit parameter
The variable is calculated as the ratio of the regression line height to the number of trades. In turn, the height is calculated as the difference between regression line values at points B and A.
Now we need to get the regression line construction error — the average deviation of the regression line from the balance line. We will call this the standard Balance deviation from the linear regression and mark it as LR Standard error:
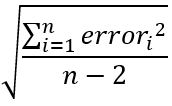
Pic. 3. LR Standard error
In this equation, error is calculated as a difference between the balance value and the linear regression. You can find the details about the equation here (in Russian).
In the case considered on Pic. 1, the errors are as follows:
| error #1 | error #2 | error #3 | error #4 | error #5 |
|---|---|---|---|---|
| 10 000 - 10 600 = - 600 | 12 000 - 11 200 = 800 | 11 000 - 11 800 = - 800 | 14 000 - 12 400 = 1600 | 12 000 - 13 000 = - 1000 |
Therefore, LR Standard error is equal to:

Pic. 4. Calculated LR Standard error
2.3. ProfitStability variable.
This parameter is responsible for the smoothness of the balance graph. Our objectives:
- the regression line should be placed as steeply relative to the horizon as possible — this means more profit;
- the mean-squared deviation of the balance line from the regression line should be as low as possible — this suggests that trading is more stable.
ProfitStability is calculated as a ratio of TrendProfit to LR Standard error:

Pic. 5. ProfitStability variable
To reduce the impact of trades with different volumes, we can divide the ProfitStability variable by the total volume of all trades.
3. Working with the ALGLIB library
As of the current moment (build 1645), the ALGLIB library has already long been integrated into the standard library: [date folder]\MQL5\Include\Math\Alglib\alglib.mqh
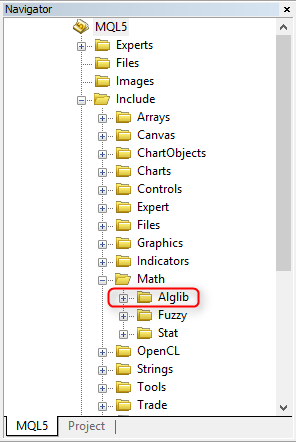
Pic. 6. The path to the ALGLIB library in the standard library
ALGLIB library classes
We will need the following classes to work with the linear regression:- CLinReg class — basic class for calculating the linear regression
- CLinReg::LRBuild method — linear regression calculation model
- CLinReg::LRUnpack method — return of the linear model ratios
- CLinearModel class — auxiliary class
- CLRReport class — structure containing the extended data on the linear model. In particular, we are interested in the m_rmserror field (mean square error).
BalanceRegression.mqh class
All work related to the linear regression and parameters calculation is performed in the Balance regression.mqh class.
Class methods
| Setting parameters | |
|---|---|
| SetStartBalance | Setting initial balance |
| SetFromDate | Setting initial date for requesting trading history |
| SetVolumeNormalization | Setting the traded volumes normalization mode |
| Access to calculation results | |
| GetProfitStability | Access to calculation results |
Working with the CBalanceRegression includes the following steps.
- Set initial balance — call the SetStartBalance method.
- Set initial date for requesting trading history — call the SetFromDate method.
- Set the traded volumes normalization mode — call the SetVolumeNormalization method. If we want to use the traded volumes normalization, pass 'true', otherwise — 'false'.
- Get the calculation result — call the GetProfitStability method, return the obtained result to the OnTester procedure.
3.1. Calculation steps (GetProfitStability method)
Results of the trades with (commission + swap + profit) > 0.0 are to be saved in the arr_profits array. The volume of all trades is to be summed up in the total_volume variable.
//---
   double   arr_profits[];                            // array of results deals
   double   total_volume=0;                           // total volume
Next, go through all trades — fill in the arr_profits array and sum up the volume of trades to the total_volume variable:
//--- request trade history
   HistorySelect(m_from_date,to_date);
   uint total_deals=HistoryDealsTotal();
   ulong ticket_history_deal=0;
//--- for all deals
   for(uint i=0;i<total_deals;i++)
     {
      //--- try to get deals ticket_history_deal
      if((ticket_history_deal=HistoryDealGetTicket(i))>0)
        {
         long     deal_type         =HistoryDealGetInteger(ticket_history_deal,DEAL_TYPE);
         double   deal_volume       =HistoryDealGetDouble(ticket_history_deal,DEAL_VOLUME);
         double   deal_commission   =HistoryDealGetDouble(ticket_history_deal,DEAL_COMMISSION);
         double   deal_swap         =HistoryDealGetDouble(ticket_history_deal,DEAL_SWAP);
         double   deal_profit       =HistoryDealGetDouble(ticket_history_deal,DEAL_PROFIT);

         if(deal_type!=DEAL_TYPE_BUY && deal_type!=DEAL_TYPE_SELL)
            continue;

         if(deal_commission==0.0 && deal_swap==0.0 && deal_profit==0.0)
            continue;

         total_volume+=deal_volume;

         int arr_size=ArraySize(arr_profits);
         ArrayResize(arr_profits,arr_size+1,50);   // resize the aray

         if(arr_size==0)
            arr_profits[arr_size]=GetSetStartBalance()+deal_commission+deal_swap+deal_profit;
         else
            arr_profits[arr_size]=arr_profits[arr_size-1]+deal_commission+deal_swap+deal_profit;

         int d=0;
        }
     }
Note: When we make the first entry to the arr_profits array, we sum up the initial balance and the trade's financial result. For all subsequent entries, sum up the previous entry and the trade's financial result.
Declare the CMatrixDouble class object. In fact, this is a matrix. Let's fill it in: trade index (start in "1") financial result.
//--- CMatrixDouble object
   CMatrixDouble xy(arr_size,2);
   for(int i=0;i<arr_size;i++)
     {
      xy[i].Set(0,i+1);
      xy[i].Set(1,arr_profits[i]);
      //Print(arr_profits[i]); // for debag
     }
Declare the objects of the necessary classes (CLinReg, CLinearModel, CLRReport) and calculate the linear regression:
//--- linear regression construction
   CLinReg        linear_regression;
   CLinearModel   linear_model;
   CLRReport      linear_report;
   int retcode;
   linear_regression.LRBuild(xy,arr_size,1,retcode,linear_model,linear_report);
   if(retcode!=1)
     {
      Print("Linear regression failed, error code=",retcode);
      return(0.0);
     }
   int nvars;
   double coefficients[];
   linear_regression.LRUnpack(linear_model,coefficients,nvars);
   double coeff_a=coefficients[0];
   double coeff_b=coefficients[1];
   PrintFormat("y = %.1f x + %.1f",coeff_a,coeff_b);
Finally, call the LRUnpack method to obtain the ratios of the y = a*x + b equation. The ratios are to be located in the coefficients array.
Now that we have calculated the linear regression using the ALGLIB library, we can proceed directly to calculating the parameter, which is the focal point of the entire article.
//--- сalculation of parameters
   double TrendProfit=((double)arr_size*coeff_a+coeff_b)-(1.0*coeff_a+coeff_b);  // the projection of the regression line on the "Y" axis
   TrendProfit/=(double)arr_size;                                                // divided by the number of trades
   double TrendMSE=linear_report.m_rmserror;                                     // root mean square error on a training set
   double ProfitStability=TrendProfit/TrendMSE;
//--- normalize the trading volume
   if(GetVolumeNormalization())
      ProfitStability/=total_volume;
//--- we multiply by the number of deals - we aren't interested in passes which have few deals
   ProfitStability*=arr_size;
//---
   return(ProfitStability*10000.0);
Depending on the initial parameter set via the SetVolumeNormalization method, we either divide the ProfitStability parameter to the summed up traded volume or not. The result is multiplied by 10 000 to better represent the results.
4. Including the CBalanceRegression class
Let's consider the algorithm of including the CBalanceRegression class for various EAs.
4.1. Expert Advisor generated by MQL5 Wizard
We want to check the effect of the normalization of traded volumes on the results. This means, we need an EA that dynamically calculates the volumes of opened positions. This can be done in the MQL5 Wizard: select Expert Advisor (generate) and include one of the money management modules on the "Money management" page:
- "Trading with fixed margin" — calculate lot in % of free margin
- "Trading with fixed risk" — calculate lot in % of balance
- "Trading with optimized trade volume" — calculate lot depending on trading history
For this article, I have selected the "Trading with fixed risk" money management module, while the EA itself is named "EA test balance regression.mq5". Using it as an example, I will show how to include the file of the CBalanceRegression class.
Step 1. Include the CBalanceRegression file and declare the class object (m_balance_regression).
ATTENTION: CBalanceRegression class file should be located in the [data folder]\MQL5\Include\Balance regression folder.
//--- available money management
#include <Expert\Money\MoneyFixedRisk.mqh>
//--- available module Balance Regression
#include <Balance regression\BalanceRegression.mqh>
//+------------------------------------------------------------------+
//| Inputs                                                           |
//+------------------------------------------------------------------+
and
//+------------------------------------------------------------------+
//| Global expert object                                             |
//+------------------------------------------------------------------+
CExpert ExtExpert;
CBalanceRegression m_balance_regression;
//+------------------------------------------------------------------+
//| Initialization function of the expert                            |
//+------------------------------------------------------------------+
Step 2. Add the parameter for enabling/disabling the traded volume normalization to the input parameters:
input double             Money_FixRisk_Percent=10.0;                            // Percentage of risk
//--- inputs for balance normalization
input bool               InpVolumeNormalization=true;                           // Volume normalization
//+------------------------------------------------------------------+
//| Global expert object                                             |
//+------------------------------------------------------------------+
Step 3. Set the parameters for the m_balance_regression object of the CBalanceRegression class: initial data for requesting trading history and traded volume normalization mode:
//+------------------------------------------------------------------+
//| Initialization function of the expert                            |
//+------------------------------------------------------------------+
int OnInit()
  {
//--- Set parameters of CBalanceRegression
   m_balance_regression.SetStartBalance(AccountInfoDouble(ACCOUNT_BALANCE));
   m_balance_regression.SetFromDate(TimeCurrent());
   m_balance_regression.SetVolumeNormalization(InpVolumeNormalization);
//--- Initializing expert
Step 4. Add the OnTester procedure to the very end of the file. Here we receive the custom optimization criterion (by calling GetProfitStability) and pass parameter to the tester:
//+------------------------------------------------------------------+
//| Tester function                                                  |
//+------------------------------------------------------------------+
double OnTester()
  {
//---
   double ret=m_balance_regression.GetProfitStability(TimeCurrent());
//---
   return(ret);
  }
4.2. Expert Advisors based on the standard MACD Sample and Moving Average
EA originals are located in [data folder]\MQL5\Experts\Examples\MACD\MACD Sample.mq5 and [data folder]MQL5\Experts\Examples\Moving Average\Moving Average.mq5, respectively.
Take the original EAs and save their copies under different names. I have selected the names "MACD Sample balance regression.mq5" and "Moving Average balance regression.mq5".
Step 1. Include the file of the CBalanceRegression class and declare the object of this class (m_balance_regression).
ATTENTION: CBalanceRegression class file should be located in the [data folder]\MQL5\Include\Balance regression folder.
| MACD Sample balance regression.mq5 | Moving Average balance regression.mq5 |
|---|---|
#include <Trade\AccountInfo.mqh> //--- available module Balance Regression #include <Balance regression\BalanceRegression.mqh> CBalanceRegression m_balance_regression; //--- input double InpLots =0.1; // Lots | #include <Trade\Trade.mqh> //--- available module Balance Regression #include <Balance regression\BalanceRegression.mqh> CBalanceRegression m_balance_regression; input double MaximumRisk = 0.02; // Maximum Risk in percentage |
Step 2. Add the parameter for enabling/disabling the traded volume normalization to the input parameters:
| MACD Sample balance regression.mq5 | Moving Average balance regression.mq5 |
|---|---|
input int InpMATrendPeriod =26; // MA trend period //--- inputs for balance normalization input bool InpVolumeNormalization=true; // Volume normalization //--- int ExtTimeOut=10; // time out in seconds between trade operations | input int MovingShift = 6; // Moving Average shift //--- inputs for balance normalization input bool InpVolumeNormalization=true; // Volume normalization //--- int ExtHandle=0; |
Step 3. Set the parameters for the m_balance_regression object of the CBalanceRegression class: initial data for requesting trading history and traded volume normalization mode:
| MACD Sample balance regression.mq5 | Moving Average balance regression.mq5 |
|---|---|
//+------------------------------------------------------------------+ //| Initialization and checking for input parameters | //+------------------------------------------------------------------+ bool CSampleExpert::Init(void) { //--- Set parameters of CBalanceRegression m_balance_regression.SetStartBalance(AccountInfoDouble(ACCOUNT_BALANCE)); m_balance_regression.SetFromDate(TimeCurrent()); m_balance_regression.SetVolumeNormalization(InpVolumeNormalization); //--- initialize common information | //+------------------------------------------------------------------+ //| Expert initialization function | //+------------------------------------------------------------------+ int OnInit(void) { //--- Set parameters of CBalanceRegression m_balance_regression.SetStartBalance(AccountInfoDouble(ACCOUNT_BALANCE)); m_balance_regression.SetFromDate(TimeCurrent()); m_balance_regression.SetVolumeNormalization(InpVolumeNormalization); //--- prepare trade class to control positions if hedging mode is active |
Step 4. Add the OnTester procedure to the very end of the file of the both EAs. Here we receive the custom optimization criterion (by calling GetProfitStability) and passing parameter to the tester:
//+------------------------------------------------------------------+
//| Tester function                                                  |
//+------------------------------------------------------------------+
double OnTester()
  {
//---
   double ret=m_balance_regression.GetProfitStability(TimeCurrent());
//---
   return(ret);
  }
5. Optimization on EURUSD H4, no forward test
We have three EAs, on which we can check the idea of optimizing the balance graph using the regression method. The two EAs (EA test balance regression.mq5 and Moving Average balance regression.mq5) calculate the position volume dynamically during trading, while MACD Sample balance regression.mq5 uses a fixed lot.
5.1. EA test balance regression.mq5, EURUSD, H4, no forward test
In order not to miss any options and speed up the testing, I chose the two parameters for optimization - the boundary parameters for position open and close signals:
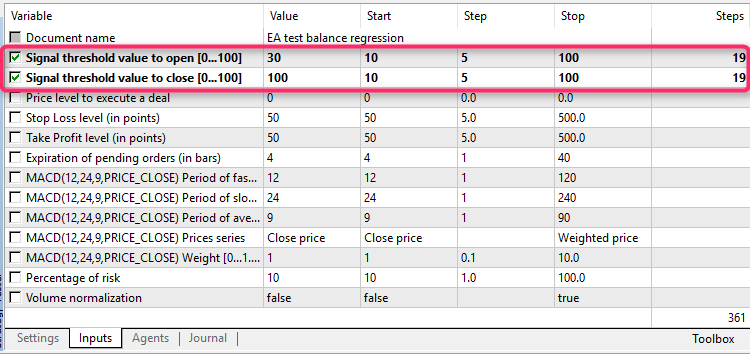
Pic. 7. Tester, Inputs tab
- Test 1: Optimizing the standard "Balance + max Sharp Ratio" parameter,
- Test 2: Optimizing the "Custom max" custom parameter, while the traded volumes optimization parameter is 'false',
- Test 3: Optimizing the "Custom max" custom parameter, while the traded volumes optimization parameter is 'true'.
5.1.1 Test 1: Optimizing the standard "Balance + max Sharp Ratio" parameter.
Tester settings for Test 1 (note: "Optimization" is equal to "Balance + max Sharpe Ratio"):
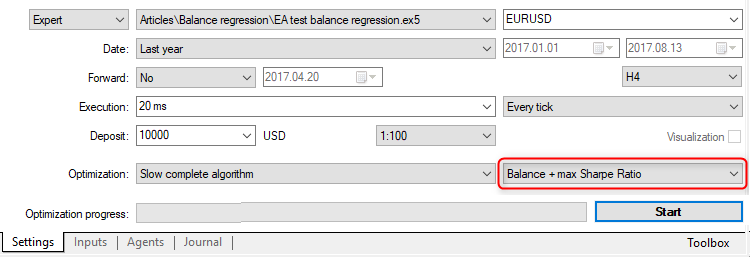
Pic. 8. Tester, Settings tab
5.1.2. Comparing test speed in a home local network of two PCs and in the cloud
The home network features two computers:
- a laptop powered by the quad-core Intel Core i3-3120M @2.50GHz, 8077 MB. Only three out of four agents are used in the test, since the terminal also needs to communicate with agents on the second computer;
- a desktop powered by the six-core AMD Phenom II X6 1075T Processor, 4058 MB. Only four agents out of six are used in the test in order not to overheat the CPU.
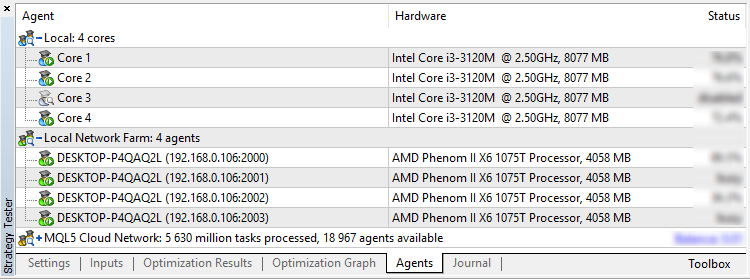
Pic. 9. Optimization in the home network
Test 1 in the home network passed within 21 minutes and 43 seconds.
Now, I delete the cached test results and launch Test 1 at MQL5 Cloud Europe 1. In the cloud, the test takes 1 minute and 9 seconds. The test cost is $0.06.
Test 1 results, Result column sorted in descending order, five best results:
| Pass | Result | Profit | Expected Payoff | Profit Factor | Recovery Factor | Sharpe Ratio | Custom | Equity DD % | Trades | Signal_ThresholdOpen | Signal_ThresholdClose |
|---|---|---|---|---|---|---|---|---|---|---|---|
| 346 | 4349.76 | 17818.98 | 181.83 | 1.28 | 1.45 | 0.16 | 27989.31 | 60.48 | 98 | 30 | 100 |
| 345 | 4349.76 | 17818.98 | 181.83 | 1.28 | 1.45 | 0.16 | 27989.31 | 60.48 | 98 | 25 | 100 |
| 344 | 4349.76 | 17818.98 | 181.83 | 1.28 | 1.45 | 0.16 | 27989.31 | 60.48 | 98 | 20 | 100 |
| 343 | 4349.76 | 17818.98 | 181.83 | 1.28 | 1.45 | 0.16 | 27989.31 | 60.48 | 98 | 15 | 100 |
| 327 | 4349.76 | 17818.98 | 181.83 | 1.28 | 1.45 | 0.16 | 27989.31 | 60.48 | 98 | 30 | 95 |
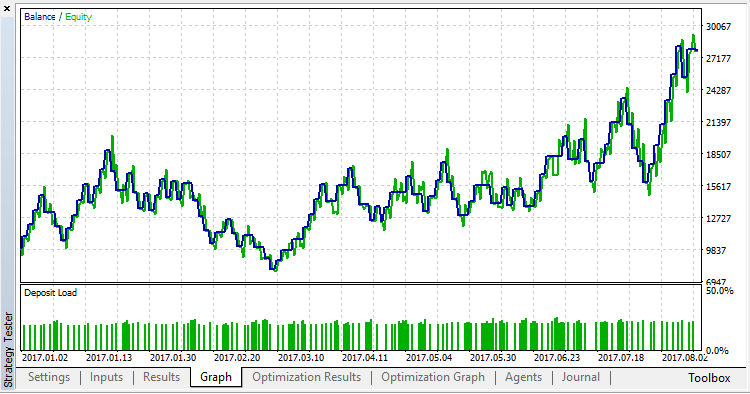
Pic. 10. Test 1, Optimization pass 346
5.1.3. Test 2: Optimizing the "Custom max" custom parameter, while the traded volumes optimization parameter is 'false'.
Tester settings for Test 2 (note: "Optimization" is equal to "Custom max"):
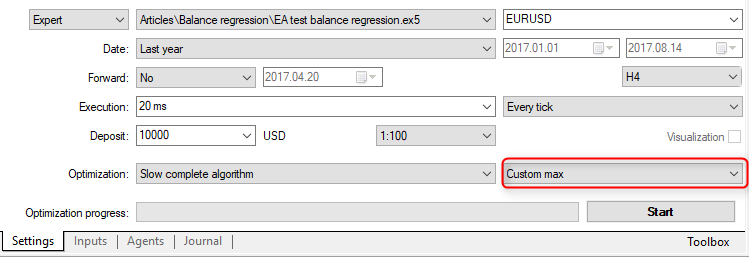
Pic. 11. Tester, Settings tab
Tester settings for Test 2 (note: "Volume normalization" in the Value column is 'false'):
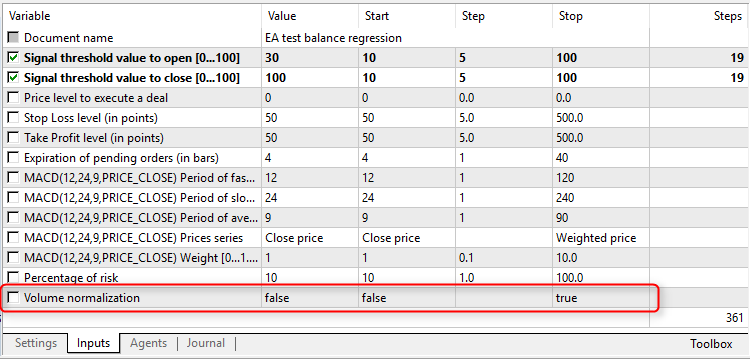
Pic. 12. Tester, Inputs tab
Test 2 results, Result column sorted in descending order, five best results:
| Pass | Result | Profit | Expected Payoff | Profit Factor | Recovery Factor | Sharpe Ratio | Custom | Equity DD % | Trades | Signal_ThresholdOpen | Signal_ThresholdClose |
|---|---|---|---|---|---|---|---|---|---|---|---|
| 270 | 40085.45 | 11072.30 | 93.04 | 1.12 | 0.90 | 0.11 | 40085.45 | 41.18 | 119 | 30 | 80 |
| 269 | 40085.45 | 11072.30 | 93.04 | 1.12 | 0.90 | 0.11 | 40085.45 | 41.18 | 119 | 25 | 80 |
| 268 | 40085.45 | 11072.30 | 93.04 | 1.12 | 0.90 | 0.11 | 40085.45 | 41.18 | 119 | 20 | 80 |
| 267 | 40085.45 | 11072.30 | 93.04 | 1.12 | 0.90 | 0.11 | 40085.45 | 41.18 | 119 | 15 | 80 |
| 251 | 40085.45 | 11072.30 | 93.04 | 1.12 | 0.90 | 0.11 | 40085.45 | 41.18 | 119 | 30 | 75 |
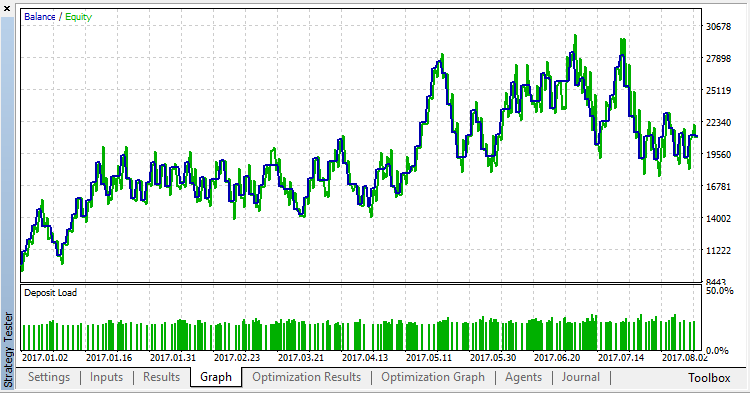
Pic. 13. EURUSDH4, Test 2, Optimization pass 270
Optimization by the "Custom max" custom parameter allowed us to select the results with lower profitability, but with a smaller drawdown by equity (Equity DD % column). Also, Test 2 has a smaller drawdown by balance. This can be seen even visually if we compare the Pic. 12 and 13.
5.1.4. Test 3: Optimizing the "Custom max" custom parameter, while the traded volumes optimization parameter is 'true':
Tester settings for test 3 (settings are similar to Test 2 ones):
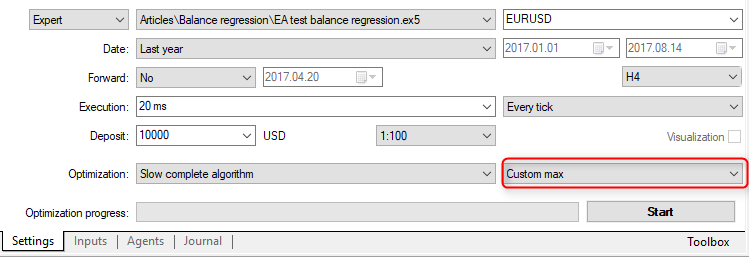
Pic. 14. Tester, Settings tab
Tester settings for Test 3 (note: "Volume normalization" in the Value column is 'true'):
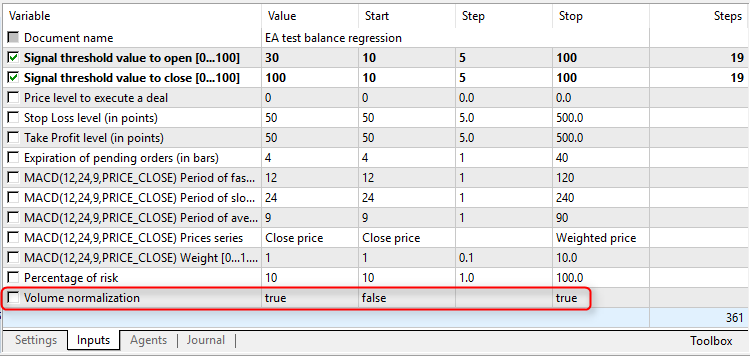
Pic. 15. Tester, Inputs tab
In the cloud, the test takes 2 minutes and 27 seconds. The entire testing is performed at MQL5 Cloud Europe 1. The test cost is $0.08.
Test 3 results, Result column sorted in descending order, five best results:
| Pass | Result | Profit | Expected Payoff | Profit Factor | Recovery Factor | Sharpe Ratio | Custom | Equity DD % | Trades | Signal_ThresholdOpen | Signal_ThresholdClose |
|---|---|---|---|---|---|---|---|---|---|---|---|
| 346 | 92.11 | 17818.98 | 181.83 | 1.28 | 1.45 | 0.16 | 92.11253 | 60.48 | 98 | 30 | 100 |
| 345 | 92.11 | 17818.98 | 181.83 | 1.28 | 1.45 | 0.16 | 92.11253 | 60.48 | 98 | 25 | 100 |
| 344 | 92.11 | 17818.98 | 181.83 | 1.28 | 1.45 | 0.16 | 92.11253 | 60.48 | 98 | 20 | 100 |
| 343 | 92.11 | 17818.98 | 181.83 | 1.28 | 1.45 | 0.16 | 92.11253 | 60.48 | 98 | 15 | 100 |
| 327 | 92.11 | 17818.98 | 181.83 | 1.28 | 1.45 | 0.16 | 92.11253 | 60.48 | 98 | 30 | 95 |
The traded volumes parameter equal to 'true' in Test 3 defined the same best options as in Test 1. This is a good marker for optimizing the balance graph using the linear regression method.
Conclusion: optimization of the balance graph using the linear regression method allows to pick results that are not worse or even comparable with the "Balance + max Sharp Ratio" optimization method.
5.2. Moving Average balance regression.mq5, EURUSD, H4, no forward test
The following parameters are selected for optimization:

Pic. 16. Tester, Inputs tab
I will conduct three tests for Moving Average balance regression EA:
- Test 1: Optimizing the standard "Balance + max Sharp Ratio" parameter,
- Test 2: Optimizing the "Custom max" custom parameter, while the traded volumes optimization parameter is 'false',
- Test 3: Optimizing the "Custom max" custom parameter, while the traded volumes optimization parameter is 'true'.
Tester settings (currency, ticks generation method and time interval are the same as on Pic. 5).
5.2.1. Test 1 (optimizing the standard "Balance + max Sharp Ratio" parameter) performed in the cloud. In the cloud, the test takes 1 minute and 22 seconds. The entire testing is performed at MQL5 Cloud Europe 1. The test cost is $0.03.
Test 1 results, Result column sorted in descending order, five best results:
| Pass | Result | Profit | Expected Payoff | Profit Factor | Recovery Factor | Sharpe Ratio | Custom | Equity DD % | Trades | DecreaseFactor | MovingPeriod |
|---|---|---|---|---|---|---|---|---|---|---|---|
| 19 | 3500.83 | 1209.31 | 28.79 | 2.89 | 2.74 | 0.31 | 280.3791 | 4.29 | 42 | 9 | 13 |
| 18 | 3500.83 | 1209.31 | 28.79 | 2.89 | 2.74 | 0.31 | 280.3791 | 4.29 | 42 | 8 | 13 |
| 17 | 3500.83 | 1209.31 | 28.79 | 2.89 | 2.74 | 0.31 | 280.3791 | 4.29 | 42 | 7 | 13 |
| 21 | 3438.91 | 1202.00 | 28.62 | 2.76 | 2.52 | 0.31 | 287.1098 | 4.59 | 42 | 11 | 13 |
| 20 | 3438.91 | 1202.00 | 28.62 | 2.76 | 2.52 | 0.31 | 287.1098 | 4.59 | 42 | 10 | 13 |
Let's check the best pass #19:
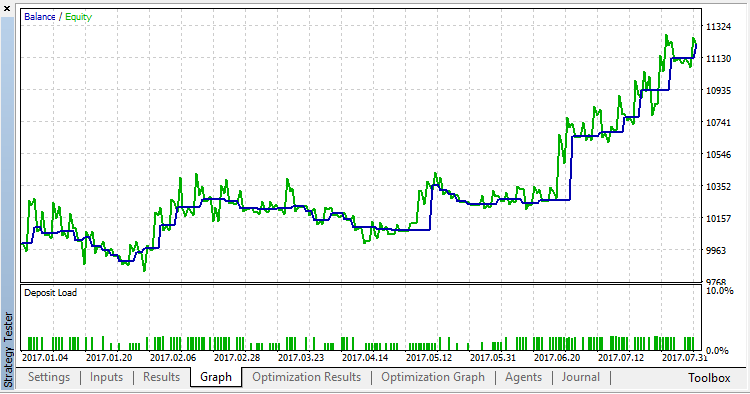
Pic. 17. EURUSDH4, Test 1, Optimization pass 19
5.2.2. Test 2 (optimizing the "Custom max" custom parameter, while the traded volumes optimization parameter is 'false') is performed in the cloud. In the cloud, the test takes 0 minutes and 00 seconds because the results have been picked up from the cache, although they are reversed. The entire testing is performed at MQL5 Cloud Europe 2. The test cost is $0.00.
Test 2 results, Result column sorted in descending order, five best results:
| Pass | Result | Profit | Expected Payoff | Profit Factor | Recovery Factor | Sharpe Ratio | Custom | Equity DD % | Trades | DecreaseFactor | MovingPeriod |
|---|---|---|---|---|---|---|---|---|---|---|---|
| 141 | 102076.24 | 1029.99 | 25.75 | 2.16 | 2.29 | 0.22 | 102076.2 | 3.93 | 40 | 14 | 22 |
| 140 | 102076.24 | 1029.99 | 25.75 | 2.16 | 2.29 | 0.22 | 102076.2 | 3.93 | 40 | 13 | 22 |
| 139 | 102076.24 | 1029.99 | 25.75 | 2.16 | 2.29 | 0.22 | 102076.2 | 3.93 | 40 | 12 | 22 |
| 142 | 101254.84 | 1037.87 | 25.95 | 2.15 | 2.31 | 0.22 | 101254.8 | 3.93 | 40 | 15 | 22 |
| 138 | 90936.41 | 960.67 | 24.02 | 2.09 | 2.08 | 0.21 | 90936.41 | 4.31 | 40 | 11 | 22 |
Pass 141 is at the very top of the table (it has the maximum value in the Result column):
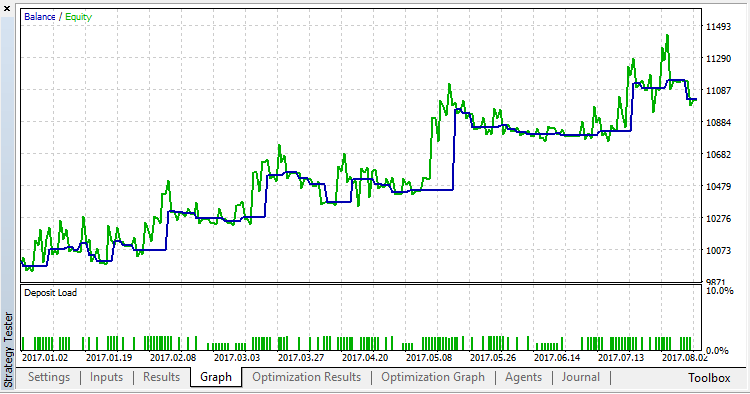
Pic. 18. EURUSDH4, Test 2, Optimization pass 141
In Test 2, optimizing the balance graph showed better result than optimization by the "Balance + max Sharp Ratio" parameter.
5.2.3. Test 3 (optimizing the "Custom max" custom parameter, while the traded volumes optimization parameter is 'true') is performed in the cloud. In the cloud, the test takes 1 minute and 13 seconds. The entire testing is performed at MQL5 Cloud Europe 2. The test cost is $0.05.
Test 3 results, Result column sorted in descending order, five best results:
| Pass | Result | Profit | Expected Payoff | Profit Factor | Recovery Factor | Sharpe Ratio | Custom | Equity DD % | Trades | DecreaseFactor | MovingPeriod |
|---|---|---|---|---|---|---|---|---|---|---|---|
| 141 | 13869.05 | 1029.99 | 25.75 | 2.16 | 2.29 | 0.22 | 13869.05 | 3.93 | 40 | 14 | 22 |
| 140 | 13869.05 | 1029.99 | 25.75 | 2.16 | 2.29 | 0.22 | 13869.05 | 3.93 | 40 | 13 | 22 |
| 139 | 13869.05 | 1029.99 | 25.75 | 2.16 | 2.29 | 0.22 | 13869.05 | 3.93 | 40 | 12 | 22 |
| 142 | 13235.93 | 1037.87 | 25.95 | 2.15 | 2.31 | 0.22 | 13235.93 | 3.93 | 40 | 15 | 22 |
| 138 | 12542.95 | 960.67 | 24.02 | 2.09 | 2.08 | 0.21 | 12542.95 | 4.31 | 40 | 11 | 22 |
Test 3 picked the same best options as in Test 2. The traded volumes optimization parameter equal to 'true' made no adjustments.
Conclusion: Optimization by the "Custom max" parameter in both tests (Test 2 and 3) managed to select better results than in Test 1. The traded volumes optimization parameter equal to 'true' made no adjustments in Test 3.
5.3. MACD Sample balance regression.mq5, EURUSD, H4, no forward test
The following parameters are selected for optimization:

Pic. 19. Tester, Inputs tab
I will conduct the same three tests for MACD Sample balance regression EA:
- Test 1: Optimizing the standard "Balance + max Sharp Ratio" parameter
- Test 2: Optimizing the "Custom max" custom parameter, while the traded volumes optimization parameter is 'false'
- Test 3: Optimizing the "Custom max" custom parameter, while the traded volumes optimization parameter is 'true'
Tester settings (currency, ticks generation method, time interval are the same as on Pic. 5).
5.3.1. Test 1 (optimizing the standard "Balance + max Sharp Ratio" parameter) performed in the cloud. In the cloud, the test takes 3 minutes and 55 seconds (the time is comparatively large because the task was not executed on some slow agents, therefore, 10 tasks were distributed among other agents). The entire testing is performed at MQL5 Cloud Europe 1. The test cost is $0.04.
Test 1 results:
| Pass | Result | Profit | Expected Payoff | Profit Factor | Recovery Factor | Sharpe Ratio | Custom | Equity DD % | Trades | InpTakeProfit | InpTrailingStop |
|---|---|---|---|---|---|---|---|---|---|---|---|
| 163 | 767049.82 | 363.32 | 24.22 | 3.87 | 74.02 | 24573559 | 0.91 | 15 | 25 | 50 | |
| 136 | 767049.82 | 363.32 | 24.22 | 3.87 | 74.02 | 24573559 | 0.91 | 15 | 25 | 45 | |
| 109 | 767049.82 | 363.32 | 24.22 | 3.87 | 74.02 | 24573559 | 0.91 | 15 | 25 | 40 | |
| 82 | 767049.82 | 363.32 | 24.22 | 3.87 | 74.02 | 24573559 | 0.91 | 15 | 25 | 35 | |
| 55 | 767049.82 | 363.32 | 24.22 | 3.87 | 74.02 | 24573559 | 0.91 | 15 | 25 | 30 |
There are very few trades (from 13 to 16) at this timeframe. I hope, there will be more trades on a lower timeframes (M15). These tests are shown in another section below. For now, the best result is #163:
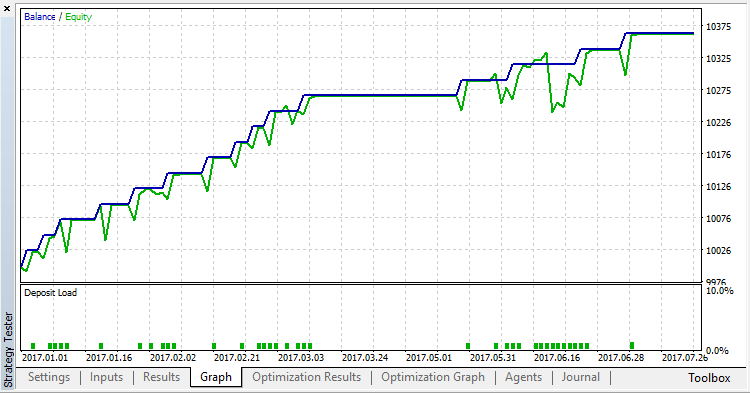
Pic. 20. EURUSDH4, Test 1, Optimization pass 163
5.3.2. Test 2 (optimizing the "Custom max" custom parameter, while the traded volumes optimization parameter is 'false') is performed in the cloud. In the cloud, the test takes 0 minutes and 00 seconds because the results have been picked up from the cache, although they are reversed. The entire testing is performed at MQL5 Cloud Europe 2. The test cost is $0.00.
Test 2 results:
| Pass | Result | Profit | Expected Payoff | Profit Factor | Recovery Factor | Sharpe Ratio | Custom | Equity DD % | Trades | InpTakeProfit | InpTrailingStop |
|---|---|---|---|---|---|---|---|---|---|---|---|
| 163 | 24573558.59 | 363.32 | 24.22 | 3.87 | 74.02 | 24573559 | 0.91 | 15 | 25 | 50 | |
| 136 | 24573558.59 | 363.32 | 24.22 | 3.87 | 74.02 | 24573559 | 0.91 | 15 | 25 | 45 | |
| 109 | 24573558.59 | 363.32 | 24.22 | 3.87 | 74.02 | 24573559 | 0.91 | 15 | 25 | 40 | |
| 82 | 24573558.59 | 363.32 | 24.22 | 3.87 | 74.02 | 24573559 | 0.91 | 15 | 25 | 35 | |
| 55 | 24573558.59 | 363.32 | 24.22 | 3.87 | 74.02 | 24573559 | 0.91 | 15 | 25 | 30 |
Test 2 picked the same best results (compare all columns except Result) as in Test 1.
5.3.3. Test 3 (optimizing the "Custom max" custom parameter, while the traded volumes optimization parameter is 'true') is performed in the cloud. In the cloud, the test takes 1 minute and 5 seconds. The entire testing is performed at MQL5 Cloud Europe 2. The test cost is $0.05.
Test 3 results:
| Pass | Result | Profit | Expected Payoff | Profit Factor | Recovery Factor | Sharpe Ratio | Custom | Equity DD % | Trades | InpTakeProfit | InpTrailingStop |
|---|---|---|---|---|---|---|---|---|---|---|---|
| 163 | 16382372.39 | 363.32 | 24.22 | 3.87 | 74.02 | 16382372 | 0.91 | 15 | 25 | 50 | |
| 136 | 16382372.39 | 363.32 | 24.22 | 3.87 | 74.02 | 16382372 | 0.91 | 15 | 25 | 45 | |
| 109 | 16382372.39 | 363.32 | 24.22 | 3.87 | 74.02 | 16382372 | 0.91 | 15 | 25 | 40 | |
| 82 | 16382372.39 | 363.32 | 24.22 | 3.87 | 74.02 | 16382372 | 0.91 | 15 | 25 | 35 | |
| 55 | 16382372.39 | 363.32 | 24.22 | 3.87 | 74.02 | 16382372 | 0.91 | 15 | 25 | 30 |
Optimization of the balance graph using the linear regression method has worked as when using the "Balance + max Sharp Ratio" method.
6. Optimization on EURUSD M15 with forward test
We have the same three EAs: EA test balance regression.mq5, Moving Average balance regression.mq5 and MACD Sample balance regression.mq5. Unlike the previous tests, we now test on M15 with forward test enabled.
6.1. EA test balance regression.mq5, forward test. I will conduct three tests:
- Test 1: Optimizing the standard "Balance + max Sharp Ratio" parameter
- Test 2: Optimizing the "Custom max" custom parameter, while the traded volumes optimization parameter is 'false'
- Test 3: Optimizing the "Custom max" custom parameter, while the traded volumes optimization parameter is 'true'.
6.1.1. Test 1: Optimizing the standard "Balance + max Sharp Ratio" parameter. Tester settings:
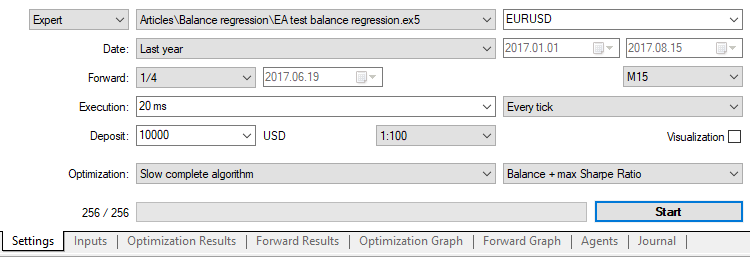
Pic. 21. Tester, Settings tab
Tester parameters are identical to the ones displayed on Pic. 7.
In the cloud, the test takes 2 minutes and 14 seconds. The entire testing is performed at MQL5 Cloud Europe 2. The test cost is $0.08.
Optimization results:
| Pass | Result | Profit | Expected Payoff | Profit Factor | Recovery Factor | Sharpe Ratio | Custom | Equity DD % | Trades | Signal_ThresholdOpen | Signal_ThresholdClose |
|---|---|---|---|---|---|---|---|---|---|---|---|
| 352 | 23196.38 | 85836.92 | 721.32 | 1.47 | 2.03 | 0.24 | 2722.602 | 48.82 | 119 | 60 | 100 |
| 351 | 23196.38 | 85836.92 | 721.32 | 1.47 | 2.03 | 0.24 | 2722.602 | 48.82 | 119 | 55 | 100 |
| 333 | 23196.38 | 85836.92 | 721.32 | 1.47 | 2.03 | 0.24 | 2722.602 | 48.82 | 119 | 60 | 95 |
| 332 | 23196.38 | 85836.92 | 721.32 | 1.47 | 2.03 | 0.24 | 2722.602 | 48.82 | 119 | 55 | 95 |
| 314 | 23196.38 | 85836.92 | 721.32 | 1.47 | 2.03 | 0.24 | 2722.602 | 48.82 | 119 | 60 | 90 |
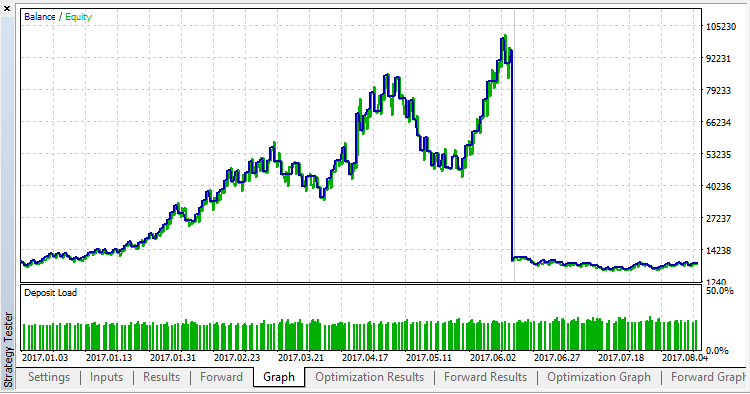
Pic. 22. EURUSDM15, Test 1, Optimization pass 352
Forward results:
| Pass | Forward Result | Back Result | Profit | Expected Payoff | Profit Factor | Recovery Factor | Sharpe Ratio | Custom | Equity DD % | Trades | Signal_ThresholdOpen | Signal_ThresholdClose |
|---|---|---|---|---|---|---|---|---|---|---|---|---|
| 284 | 216.48 | 11708.46 | 18.91 | 1.89 | 1.02 | 0.02 | 0.02 | 7172.395 | 9.33 | 10 | 100 | 80 |
| 283 | 216.48 | 11708.46 | 18.91 | 1.89 | 1.02 | 0.02 | 0.02 | 7172.395 | 9.33 | 10 | 95 | 80 |
| 282 | 216.48 | 11708.46 | 18.91 | 1.89 | 1.02 | 0.02 | 0.02 | 7172.395 | 9.33 | 10 | 90 | 80 |
| 281 | 216.48 | 11708.46 | 18.91 | 1.89 | 1.02 | 0.02 | 0.02 | 7172.395 | 9.33 | 10 | 85 | 80 |
| 265 | 216.48 | 11708.46 | 18.91 | 1.89 | 1.02 | 0.02 | 0.02 | 7172.395 | 9.33 | 10 | 100 | 75 |
Here, the best options were the ones having only 10 trades on a forward section. Of course, this is not enough, but we still need to conduct a test:
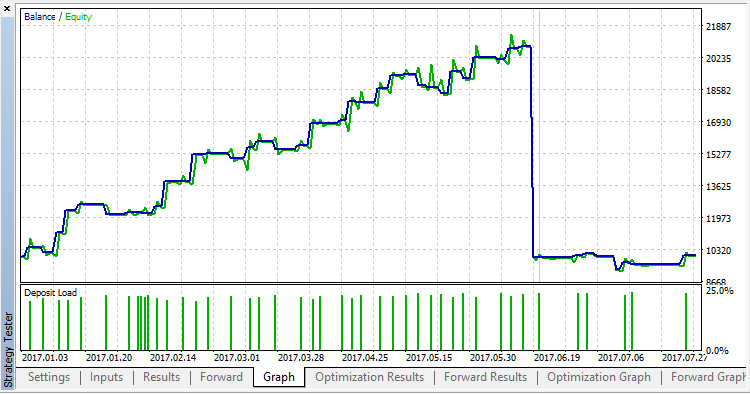
Pic. 23. EURUSDM15, Test 1, Forward pass 284
6.1.2. Test 2: Optimizing the "Custom max" custom parameter, while the traded volumes optimization parameter is 'false'.
Best optimization results (not forward):
| Pass | Result | Profit | Expected Payoff | Profit Factor | Recovery Factor | Sharpe Ratio | Custom | Equity DD % | Trades | Signal_ThresholdOpen | Signal_ThresholdClose |
|---|---|---|---|---|---|---|---|---|---|---|---|
| 284 | 180332.68 | 10820.37 | 309.15 | 4.67 | 6.80 | 0.56 | 180332.7 | 7.98 | 35 | 100 | 80 |
| 283 | 180332.68 | 10820.37 | 309.15 | 4.67 | 6.80 | 0.56 | 180332.7 | 7.98 | 35 | 95 | 80 |
| 282 | 180332.68 | 10820.37 | 309.15 | 4.67 | 6.80 | 0.56 | 180332.7 | 7.98 | 35 | 90 | 80 |
| 281 | 180332.68 | 10820.37 | 309.15 | 4.67 | 6.80 | 0.56 | 180332.7 | 7.98 | 35 | 85 | 80 |
| 265 | 180332.68 | 10820.37 | 309.15 | 4.67 | 6.80 | 0.56 | 180332.7 | 7.98 | 35 | 100 | 75 |
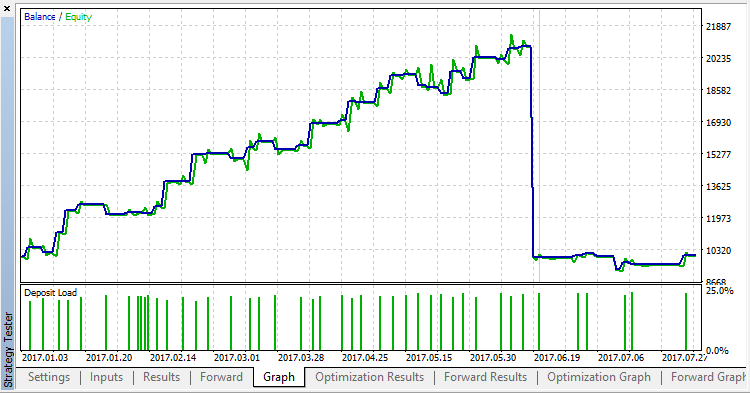
Pic. 24. EURUSDM15, Test 2, Optimization pass 284
Forward results:
| Pass | Forward Result | Back Result | Profit | Expected Payoff | Profit Factor | Recovery Factor | Sharpe Ratio | Custom | Equity DD % | Trades | Signal_ThresholdOpen | Signal_ThresholdClose |
|---|---|---|---|---|---|---|---|---|---|---|---|---|
| 284 | -14294.76 | 180332.68 | 18.91 | 1.89 | 1.02 | 0.02 | 0.02 | -14294.8 | 9.33 | 10 | 100 | 80 |
| 283 | -14294.76 | 180332.68 | 18.91 | 1.89 | 1.02 | 0.02 | 0.02 | -14294.8 | 9.33 | 10 | 95 | 80 |
| 282 | -14294.76 | 180332.68 | 18.91 | 1.89 | 1.02 | 0.02 | 0.02 | -14294.8 | 9.33 | 10 | 90 | 80 |
| 281 | -14294.76 | 180332.68 | 18.91 | 1.89 | 1.02 | 0.02 | 0.02 | -14294.8 | 9.33 | 10 | 85 | 80 |
| 265 | -14294.76 | 180332.68 | 18.91 | 1.89 | 1.02 | 0.02 | 0.02 | -14294.8 | 9.33 | 10 | 100 | 75 |
In Test 2, forward testing shows the same results as in Test 1.
Optimization of the balance graph using the linear regression method in Test 2 allowed us to detect the results that are not worse than the ones in Test 1 ("Balance + max Sharp Ratio" method).
6.1.3. Test 3: Optimizing the "Custom max" custom parameter, while the traded volumes optimization parameter is 'true'. In the cloud, the test takes 3 minutes and 29 seconds. The entire testing is performed at MQL5 Cloud Europe 1. The test cost is $0.07.
Best optimization results (not forward):
| Pass | Result | Profit | Expected Payoff | Profit Factor | Recovery Factor | Sharpe Ratio | Custom | Equity DD % | Trades | Signal_ThresholdOpen | Signal_ThresholdClose |
|---|---|---|---|---|---|---|---|---|---|---|---|
| 208 | 1660.90 | 10008.05 | 285.94 | 4.50 | 6.55 | 0.56 | 1660.901 | 7.98 | 35 | 100 | 60 |
| 207 | 1660.90 | 10008.05 | 285.94 | 4.50 | 6.55 | 0.56 | 1660.901 | 7.98 | 35 | 95 | 60 |
| 206 | 1660.90 | 10008.05 | 285.94 | 4.50 | 6.55 | 0.56 | 1660.901 | 7.98 | 35 | 90 | 60 |
| 205 | 1660.90 | 10008.05 | 285.94 | 4.50 | 6.55 | 0.56 | 1660.901 | 7.98 | 35 | 85 | 60 |
| 189 | 1660.90 | 10008.05 | 285.94 | 4.50 | 6.55 | 0.56 | 1660.901 | 7.98 | 35 | 100 | 55 |
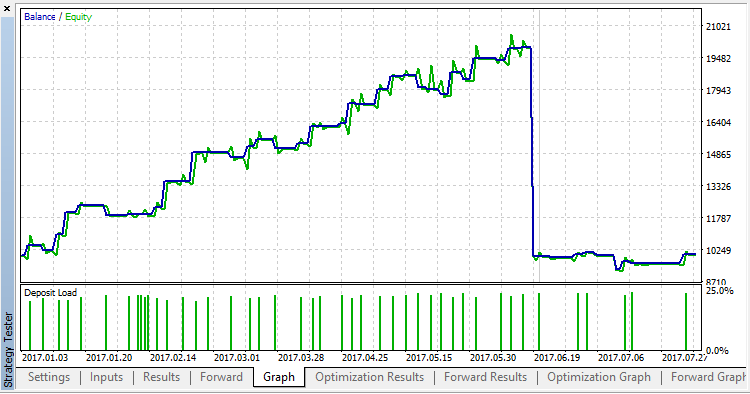
Pic. 25. EURUSDM15, Test 3, Optimization pass 208
Enabling the "Normalization of traded volumes" made no significant impact on the results. Also, one of the best results was found within the optimized interval.
The best forward results:
| Pass | Forward Result | Back Result | Profit | Expected Payoff | Profit Factor | Recovery Factor | Sharpe Ratio | Custom | Equity DD % | Trades | Signal_ThresholdOpen | Signal_ThresholdClose |
|---|---|---|---|---|---|---|---|---|---|---|---|---|
| 266 | -103.43 | -25.56 | -7464.56 | -24.64 | 0.66 | -0.99 | -0.11 | -103.428 | 75.43 | 303 | 10 | 80 |
| 247 | -103.43 | -25.56 | -7464.56 | -24.64 | 0.66 | -0.99 | -0.11 | -103.428 | 75.43 | 303 | 10 | 75 |
| 228 | -103.43 | -25.56 | -7464.56 | -24.64 | 0.66 | -0.99 | -0.11 | -103.428 | 75.43 | 303 | 10 | 70 |
| 209 | -103.43 | -25.56 | -7464.56 | -24.64 | 0.66 | -0.99 | -0.11 | -103.428 | 75.43 | 303 | 10 | 65 |
| 156 | -120.35 | -29.28 | -8013.01 | -22.76 | 0.63 | -1.00 | -0.13 | -120.35 | 80.44 | 352 | 30 | 50 |
Forward test in Test 3 (the traded volumes optimization parameter is 'true') shows ONLY NEGATIVE results (see the "Forward Result" column). This is a good result for optimizing the balance graph using the linear regression method, since the most accurate and realistic results have been selected for forward test.
Optimization of the balance graph using the linear regression method (the traded volumes optimization parameter is 'false') allows you to obtain results comparable to the "Balance max + Sharp Ratio" method). When the traded volumes optimization parameter is 'true', forward test results show the actual test image on this timeframe.
6.2. MACD Sample balance regression.mq5, forward test
6.2.1. Test 1: Optimizing the standard "Balance + max Sharp Ratio" parameter performed in the cloud. In the cloud, the test takes 1 minute and 3 seconds. The entire testing is performed at MQL5 Cloud Europe 1. The test cost is $0.06.
Optimization results:
| Pass | Result | Profit | Expected Payoff | Profit Factor | Recovery Factor | Sharpe Ratio | Custom | Equity DD % | Trades | InpTakeProfit | InpTrailingStop |
|---|---|---|---|---|---|---|---|---|---|---|---|
| 171 | 2094.29 | 479.93 | 8.57 | 1.81 | 2.03 | 0.20 | -1.69249 | 2.30 | 56 | 65 | 50 |
| 144 | 2094.29 | 479.93 | 8.57 | 1.81 | 2.03 | 0.20 | -1.69249 | 2.30 | 56 | 65 | 45 |
| 182 | 2078.33 | 489.23 | 8.74 | 1.82 | 2.07 | 0.20 | -9.9625 | 2.29 | 56 | 120 | 50 |
| 155 | 2077.49 | 489.03 | 8.73 | 1.82 | 2.07 | 0.20 | -9.90369 | 2.29 | 56 | 120 | 45 |
| 181 | 2066.17 | 484.13 | 8.65 | 1.81 | 2.05 | 0.20 | -8.1109 | 2.29 | 56 | 115 | 50 |
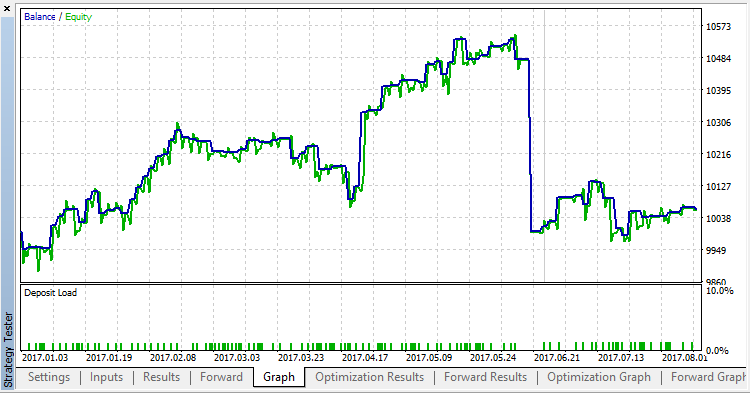
Pic. 26. EURUSDM15, Test 1, Optimization pass 171
Forward results:
| Pass | Forward Result | Back Result | Profit | Expected Payoff | Profit Factor | Recovery Factor | Sharpe Ratio | Custom | Equity DD % | Trades | InpTakeProfit | InpTrailingStop |
|---|---|---|---|---|---|---|---|---|---|---|---|---|
| 78 | 1182.13 | 1659.86 | 83.87 | 5.24 | 1.43 | 0.42 | 0.12 | -44.8452 | 1.95 | 16 | 140 | 30 |
| 77 | 1134.97 | 1659.86 | 78.87 | 4.93 | 1.41 | 0.40 | 0.11 | -53.5369 | 1.95 | 16 | 135 | 30 |
| 105 | 1107.99 | 1639.60 | 78.17 | 4.89 | 1.40 | 0.39 | 0.11 | -26.6428 | 1.96 | 16 | 140 | 35 |
| 76 | 1085.51 | 1659.86 | 73.87 | 4.62 | 1.38 | 0.37 | 0.11 | -62.5775 | 1.95 | 16 | 130 | 30 |
| 171 | 1060.24 | 2094.29 | 62.97 | 3.94 | 1.32 | 0.36 | 0.11 | -347.982 | 1.70 | 16 | 65 | 50 |
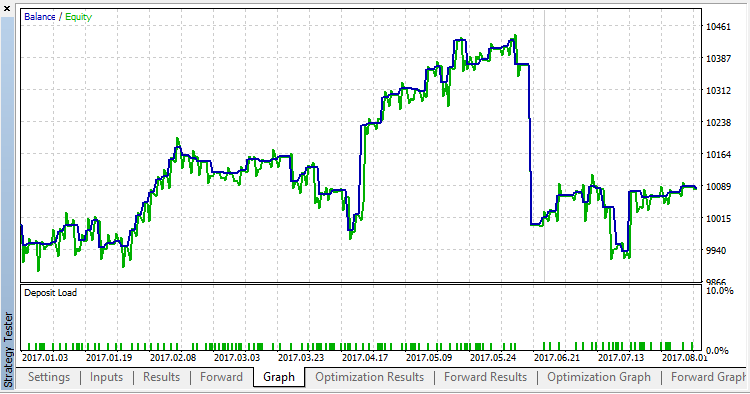
Pic. 27. EURUSDM15, Test 1, Forward pass 78
6.2.2. Test 2: Optimizing the "Custom max" custom parameter, while the traded volumes optimization parameter is 'false'.
Optimization results:
| Pass | Result | Profit | Expected Payoff | Profit Factor | Recovery Factor | Sharpe Ratio | Custom | Equity DD % | Trades | InpTakeProfit | InpTrailingStop |
|---|---|---|---|---|---|---|---|---|---|---|---|
| 168 | 84498.76 | 442.03 | 7.89 | 1.74 | 2.08 | 0.19 | 84498.76 | 2.07 | 56 | 50 | 50 |
| 141 | 84498.76 | 442.03 | 7.89 | 1.74 | 2.08 | 0.19 | 84498.76 | 2.07 | 56 | 50 | 45 |
| 114 | 84498.76 | 442.03 | 7.89 | 1.74 | 2.08 | 0.19 | 84498.76 | 2.07 | 56 | 50 | 40 |
| 167 | 83473.95 | 442.03 | 7.89 | 1.74 | 2.08 | 0.19 | 83473.95 | 2.06 | 56 | 45 | 50 |
| 140 | 83473.95 | 442.03 | 7.89 | 1.74 | 2.08 | 0.19 | 83473.95 | 2.06 | 56 | 45 | 45 |
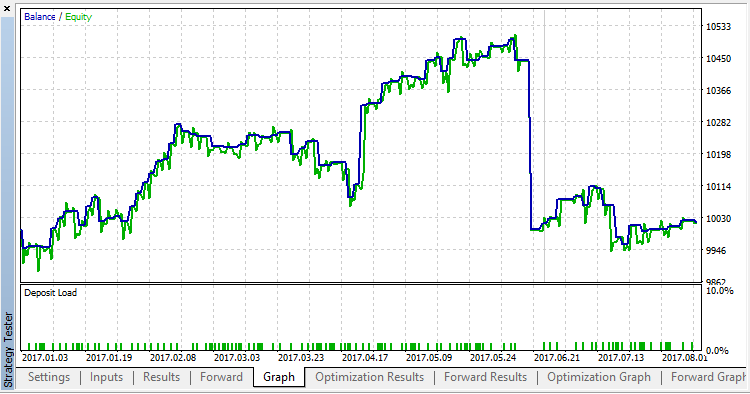
Pic. 28. EURUSDM15, Test 2, Optimization pass 168
Forward results:
| Pass | Forward Result | Back Result | Profit | Expected Payoff | Profit Factor | Recovery Factor | Sharpe Ratio | Custom | Equity DD % | Trades | InpTakeProfit | InpTrailingStop |
|---|---|---|---|---|---|---|---|---|---|---|---|---|
| 78 | 1182.13 | 1659.86 | 83.87 | 5.24 | 1.43 | 0.42 | 0.12 | 6462.158 | 1.95 | 16 | 140 | 30 |
| 77 | 1134.97 | 1659.86 | 78.87 | 4.93 | 1.41 | 0.40 | 0.11 | 5018.77 | 1.95 | 16 | 135 | 30 |
| 105 | 1107.99 | 1639.60 | 78.17 | 4.89 | 1.40 | 0.39 | 0.11 | 5617.275 | 1.96 | 16 | 140 | 35 |
| 76 | 1085.51 | 1659.86 | 73.87 | 4.62 | 1.38 | 0.37 | 0.11 | 3525.665 | 1.95 | 16 | 130 | 30 |
| 171 | 1060.24 | 2094.29 | 62.97 | 3.94 | 1.32 | 0.36 | 0.11 | -5131.93 | 1.70 | 16 | 65 | 50 |
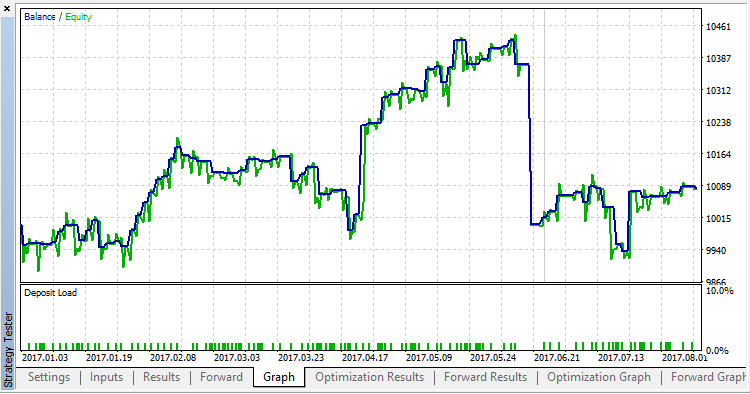
Pic. 29. EURUSDM15, Test 2, Forward pass 78
Optimization of the balance graph using the regression method in Test 2 showed results comparable to the "Balance + max Sharp Ratio" method.
6.2.3. Test 3: Optimizing the "Custom max" custom parameter, while the traded volumes optimization parameter set to 'true' is performed in the cloud. In the cloud, the test takes 1 minute and 44 seconds. The entire testing is performed at MQL5 Cloud Europe 1. The test cost is $0.08.
Optimization results:
| Pass | Result | Profit | Expected Payoff | Profit Factor | Recovery Factor | Sharpe Ratio | Custom | Equity DD % | Trades | InpTakeProfit | InpTrailingStop |
|---|---|---|---|---|---|---|---|---|---|---|---|
| 168 | 15089.06 | 442.03 | 7.89 | 1.74 | 2.08 | 0.19 | 15089.06 | 2.07 | 56 | 50 | 50 |
| 141 | 15089.06 | 442.03 | 7.89 | 1.74 | 2.08 | 0.19 | 15089.06 | 2.07 | 56 | 50 | 45 |
| 114 | 15089.06 | 442.03 | 7.89 | 1.74 | 2.08 | 0.19 | 15089.06 | 2.07 | 56 | 50 | 40 |
| 167 | 14906.06 | 442.03 | 7.89 | 1.74 | 2.08 | 0.19 | 14906.06 | 2.06 | 56 | 45 | 50 |
| 140 | 14906.06 | 442.03 | 7.89 | 1.74 | 2.08 | 0.19 | 14906.06 | 2.06 | 56 | 45 | 45 |
Forward results:
| Pass | Forward Result | Back Result | Profit | Expected Payoff | Profit Factor | Recovery Factor | Sharpe Ratio | Custom | Equity DD % | Trades | InpTakeProfit | InpTrailingStop |
|---|---|---|---|---|---|---|---|---|---|---|---|---|
| 78 | 4038.85 | 13138.16 | 83.87 | 5.24 | 1.43 | 0.42 | 0.12 | 4038.849 | 1.95 | 16 | 140 | 30 |
| 105 | 3510.80 | 13026.26 | 78.17 | 4.89 | 1.40 | 0.39 | 0.11 | 3510,797 | 1.96 | 16 | 140 | 35 |
| 77 | 3136.73 | 13138.16 | 78.87 | 4.93 | 1.41 | 0.40 | 0.11 | 3136.731 | 1.95 | 16 | 135 | 30 |
| 132 | 3074.09 | 13598.05 | 73.17 | 4.57 | 1.38 | 0.37 | 0.10 | 3074.089 | 1.96 | 16 | 140 | 40 |
| 159 | 2658.84 | 13777.31 | 68.47 | 4.28 | 1.35 | 0.35 | 0.10 | 2658.844 | 1.96 | 16 | 140 | 45 |
Optimization of the balance graph using the linear regression method has turned out to be comparable with the standard "Balance max + Sharp Ratio" method.
6.3. Moving Average balance regression.mq5 EA, forward test
6.3.1. Test 1: Optimizing the standard "Balance + max Sharp Ratio" parameter.
Tester, values in the Inputs tab are similar to those in Pic. 15. Tester, values in the Settings tab are similar to those used in Pic. 23.
In the cloud, the test takes 1 minute and 28 seconds. The entire testing is performed at MQL5 Cloud Europe 1. The test cost is $0.05.
Optimization results:
| Pass | Result | Profit | Expected Payoff | Profit Factor | Recovery Factor | Sharpe Ratio | Custom | Equity DD % | Trades | DecreaseFactor | MovingPeriod |
|---|---|---|---|---|---|---|---|---|---|---|---|
| 53 | -1.29 | -16.76 | -0.03 | 0.99 | -0.03 | 0.00 | 11966.34 | 5.92 | 525 | 4 | 16 |
| 52 | -1.29 | -16.76 | -0.03 | 0.99 | -0.03 | 0.00 | 11966.34 | 5.92 | 525 | 3 | 16 |
| 165 | -6.17 | -24.02 | -0.05 | 0.99 | -0.03 | 0.00 | -37045.4 | 6.66 | 465 | 12 | 24 |
| 166 | -26.36 | -49.14 | -0.11 | 0.99 | -0.07 | 0.00 | -38052.8 | 6.86 | 465 | 13 | 24 |
| 163 | -39.47 | -61.88 | -0.13 | 0.98 | -0.09 | 0.00 | -39156.1 | 6.62 | 465 | 10 | 24 |
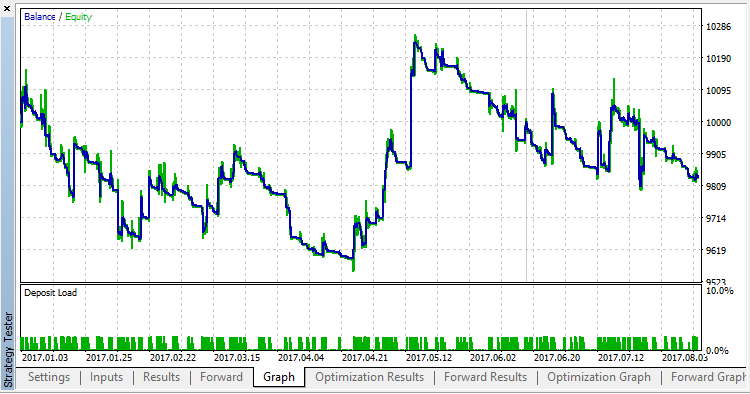
Pic. 30. EURUSDM15, Test 1, Optimization pass 53
Forward results:
| Pass | Forward Result | Back Result | Profit | Expected Payoff | Profit Factor | Recovery Factor | Sharpe Ratio | Custom | Equity DD % | Trades | DecreaseFactor | MovingPeriod |
|---|---|---|---|---|---|---|---|---|---|---|---|---|
| 48 | 409.74 | -460.18 | 185.78 | 1.06 | 1.16 | 0.80 | 0.04 | 42602.76 | 2.26 | 175 | 12 | 15 |
| 49 | 364.79 | -461.14 | 165.23 | 0.94 | 1.14 | 0.67 | 0.04 | 38508.36 | 2.41 | 175 | 13 | 15 |
| 50 | 362.45 | -460.40 | 164.15 | 0.94 | 1.14 | 0.66 | 0.04 | 38292.53 | 2.42 | 175 | 14 | 15 |
| 51 | 353.14 | -467.05 | 159.83 | 0.91 | 1.13 | 0.65 | 0.03 | 37460.15 | 2.42 | 175 | 15 | 15 |
| 47 | 350.60 | -629.53 | 144.32 | 0.82 | 1.13 | 0.65 | 0.03 | 32767.39 | 2.17 | 175 | 11 | 15 |
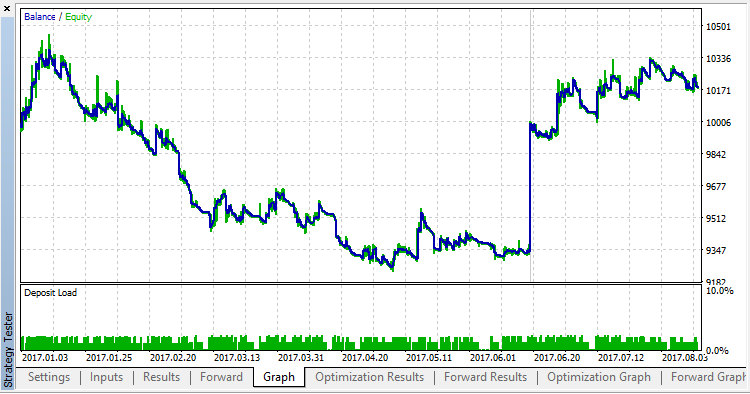
Pic. 31. EURUSDM15, Test 1, Forward pass 48
6.3.2. Test 2: Optimizing the "Custom max" custom parameter, while the traded volumes optimization parameter is 'false'.
Optimization results:
| Pass | Result | Profit | Expected Payoff | Profit Factor | Recovery Factor | Sharpe Ratio | Custom | Equity DD % | Trades | DecreaseFactor | MovingPeriod |
|---|---|---|---|---|---|---|---|---|---|---|---|
| 53 | 11966.34 | -16.76 | -0.03 | 0.99 | -0.03 | 0.00 | 11966.34 | 5.92 | 525 | 4 | 16 |
| 52 | 11966.34 | -16.76 | -0.03 | 0.99 | -0.03 | 0.00 | 11966.34 | 5.92 | 525 | 3 | 16 |
| 54 | 2465.75 | -103.27 | -0.20 | 0.96 | -0.14 | -0.01 | 2465.748 | 7.19 | 525 | 5 | 16 |
| 57 | 813.83 | -91.78 | -0.17 | 0.97 | -0.13 | -0.01 | 813.831 | 6.75 | 525 | 8 | 16 |
| 56 | 813.83 | -91.78 | -0.17 | 0.97 | -0.13 | -0.01 | 813.831 | 6.75 | 525 | 7 | 16 |
Forward results:
| Pass | Forward Result | Back Result | Profit | Expected Payoff | Profit Factor | Recovery Factor | Sharpe Ratio | Custom | Equity DD % | Trades | DecreaseFactor | MovingPeriod |
|---|---|---|---|---|---|---|---|---|---|---|---|---|
| 48 | 42602.76 | -73708.28 | 185.78 | 1.06 | 1.16 | 0.80 | 0.04 | 42602.76 | 2.26 | 175 | 12 | 15 |
| 49 | 38508.36 | -74600.92 | 165.23 | 0.94 | 1.14 | 0.67 | 0.04 | 38508.36 | 2.41 | 175 | 13 | 15 |
| 50 | 38292.53 | -74386.41 | 164.15 | 0.94 | 1.14 | 0.66 | 0.04 | 38292.53 | 2.42 | 175 | 14 | 15 |
| 51 | 37460.15 | -75315.40 | 159.83 | 0.91 | 1.13 | 0.65 | 0.03 | 37460.15 | 2.42 | 175 | 15 | 15 |
| 47 | 32767.39 | -107616.36 | 144.32 | 0.82 | 1.13 | 0.65 | 0.03 | 32767.39 | 2.17 | 175 | 11 | 15 |
6.3.3. Test 3: Optimizing the "Custom max" custom parameter, while the traded volumes optimization parameter set to 'true' is performed in the cloud. In the cloud, the test takes 0 minutes and 42 seconds. The entire testing is performed at MQL5 Cloud Europe 1. The test cost is $0.04.
Optimization results:
| Pass | Result | Profit | Expected Payoff | Profit Factor | Recovery Factor | Sharpe Ratio | Custom | Equity DD % | Trades | DecreaseFactor | MovingPeriod |
|---|---|---|---|---|---|---|---|---|---|---|---|
| 53 | 243.32 | -16.76 | -0.03 | 0.99 | -0.03 | 0.00 | 243.3172 | 5.92 | 525 | 4 | 16 |
| 52 | 243.32 | -16.76 | -0.03 | 0.99 | -0.03 | 0.00 | 243.3172 | 5.92 | 525 | 3 | 16 |
| 54 | 45.69 | -103.27 | -0.20 | 0.96 | -0.14 | -0.01 | 45.68738 | 7.19 | 525 | 5 | 16 |
| 57 | 13.40 | -91.78 | -0.17 | 0.97 | -0.13 | -0.01 | 13.40301 | 6.75 | 525 | 8 | 16 |
| 56 | 13.40 | -91.78 | -0.17 | 0.97 | -0.13 | -0.01 | 13.40301 | 6.75 | 525 | 7 | 16 |
Forward results:
| Pass | Forward Result | Back Result | Profit | Expected Payoff | Profit Factor | Recovery Factor | Sharpe Ratio | Custom | Equity DD % | Trades | DecreaseFactor | MovingPeriod |
|---|---|---|---|---|---|---|---|---|---|---|---|---|
| 48 | 1772.90 | -997.81 | 185.78 | 1.06 | 1.16 | 0.80 | 0.04 | 1772.899 | 2.26 | 175 | 12 | 15 |
| 49 | 1591.91 | -994.94 | 165.23 | 0.94 | 1.14 | 0.67 | 0.04 | 1591.912 | 2.41 | 175 | 13 | 15 |
| 50 | 1577.12 | -987.34 | 164.15 | 0.94 | 1.14 | 0.66 | 0.04 | 1577.123 | 2.42 | 175 | 14 | 15 |
| 51 | 1537.14 | -972.44 | 159.83 | 0.91 | 1.13 | 0.65 | 0.03 | 1537.142 | 2.42 | 175 | 15 | 15 |
| 47 | 1473.35 | -1540.90 | 144.32 | 0.82 | 1.13 | 0.65 | 0.03 | 1473.354 | 2.17 | 175 | 11 | 15 |
Optimization of the balance graph using the linear regression method in Test 3 fully repeats the Test 1 results. In other words, enabling the traded volumes optimization has no impact on the result, although the Moving Average balance regression.mq5 EA applies dynamic lot calculation in trading.
Optimization of the balance graph using the linear regression method has turned out to be comparable with the standard "Balance max + Sharp Ratio" method.
7. Conclusion
The results of applying the balance graph using the linear regression method have turned out to be at the "Balance + max Sharp Ratio" optimization method level. The EAs using dynamic lot has shown interesting results: in some cases, the "traded volumes normalization" setting combined with a forward test yields a more realistic picture.
I believe, the described method has the right to exist, and it can be further improved, for example by considering the duration of profitable and loss-making trades and experimenting with the obtained values.
Translated from Russian by MetaQuotes Ltd.
Original article: https://www.mql5.com/ru/articles/3642
Warning: All rights to these materials are reserved by MetaQuotes Ltd. Copying or reprinting of these materials in whole or in part is prohibited.
This article was written by a user of the site and reflects their personal views. MetaQuotes Ltd is not responsible for the accuracy of the information presented, nor for any consequences resulting from the use of the solutions, strategies or recommendations described.
 A New Approach to Interpreting Classic and Hidden Divergence
- Free trading apps
- Over 8,000 signals for copying
- Economic news for exploring financial markets
You agree to website policy and terms of use
There was a recent article (too lazy to look for it) that also used"linear regression". I gave a detailed comment on it, I will repeat it.
Both authors make identical mistakes: they confuse qualitatively different concepts of "linear regression" and "linear approximation". The former refers to random variables and the latter to deterministic ones. Their equations differ by the random variable, which is the error. I don't know how in Alglib, but in any normal statistical package the error accounting results in the EVALUATION of regression coefficients, as there is an error for them, which can be multiple of the nominal value of the calculated coefficient, which leads to a sad result: the value of the coefficient is calculated, we see it, but in reality it is not there, and we can't use what we see This circumstance is not taken into account in the article and for the terminology "linear regression" the article is absolutely wrong.
If we change the words "linear regression" to "linear approximation", which will correspond to the essence of the article, in which the balance is considered as a set of deterministic rather than random values, then it is quite an interesting and useful article.
Hey for some reason my file won't include the balanceregression. Any way to troubleshoot this? I have it saved in my files and under include.
Hey for some reason my file won't include the balanceregression. Any way to troubleshoot this? I have it saved in my files and under include.
1. Read the error description and check your paths.
2. If you have any mistake, please provide reproducible results: at least you need a complete code and at least you need proof of the presence of files in the specified folders.
have a general question : why when we are populating arrays of trade results, we only consider trades with positive balance impacts? i.e. why arr_profits is only filled with trades of (commission + swap + profit) > 0.0 ?
aren't the dips in the balance curve (which are the results if loss of trades ) also affecting the LR line and hence the GetProfitStability?
I got some errors when I tried to compile BalanceRegression.mph:
The two commented out lines generated the following error - after digging around a bit, I found that the alglib library was updated.
The updated lines compile and the code runs, but I've never used CMatrixDouble before, so I'm not 100% sure that the fix is correct.
Also, the commented out line, in the same file, returned undefined variable - again, I think it was due to the alglib update: