
EURUSD Technical Analysis 2015, 27.09 - 04.10: between bearish and bullish waiting for direction
28 September 2015, 09:11

4
1 423
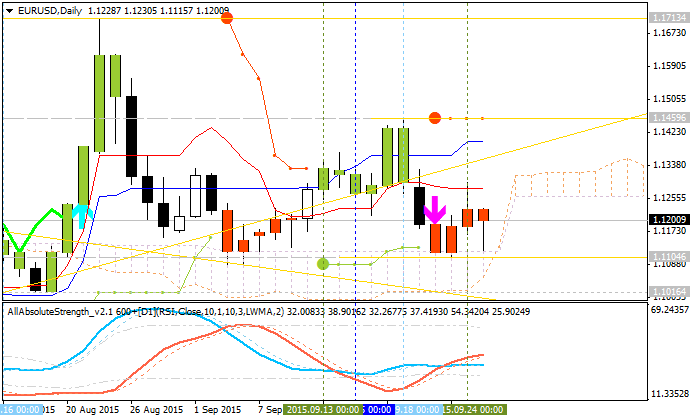
Daily price is on ranging market condition located between bearish and bullish area of the chart with the following key support/resistance levels:
- 1.1713 key resistance level located far above Ichimoku cloud in the primary bullish area of the chart;
- 1.0847 key support level located far below Ichimoku cloud in the primary bearish area of the chart.
Intermediate
s/r levels for this pair on the way to the key s/r are the following:
1.1459 bullish resistance and 1.1016 bearish support level.
D1 price - ranging:
- Tenkan-sen line is below Kijun-sen line for the possible bearish condition.
- Absolute Strength indicator's data is estimating the ranging condition.
- Chinkou Span line is indicating the ranging condition by direction.
- 'Reversal' Senkou Span line as the border between the primary bullish and the primary bearish on the chart is located to be near market price.
- Nearest support levels are 1.1016 and 1.0847.
- Nearest resistance levels are 1.1459 and 1.1713.
If D1 price will break 1.0847
support level on close D1 bar so we may see the bearish market condition.
If D1 price will break 1.1713 resistance level so the bullish trend will be continuing.
If not so the price will be on ranging between the levels.
- Recommendation for long: watch close D1 price to break 1.1713 for possible buy trade
- Recommendation
to go short: watch D1 price to break 1.0847 support level for possible sell trade
- Trading Summary: ranging
| Resistance | Support |
|---|---|
| 1.1459 | 1.1016 |
| 1.1713 | 1.0847 |
SUMMARY : ranging


")

![[XAUUSD]: Weekly Liquidity Activation Points (timings), June 22-26, 2026](https://c.mql5.com/6/1013/splash-preview-771790.png "[XAUUSD]: Weekly Liquidity Activation Points (timings), June 22-26, 2026")