Why Range Trading Support and Resistance Works Best in Neutral Markets
Trading support and resistance can be tricky when market direction is unclear. When the macroeconomic environment lacks a strong directional push, currency pairs often move sideways in neat ranges. This is where combining technical price action with fundamental data gives you an unbeatable edge.
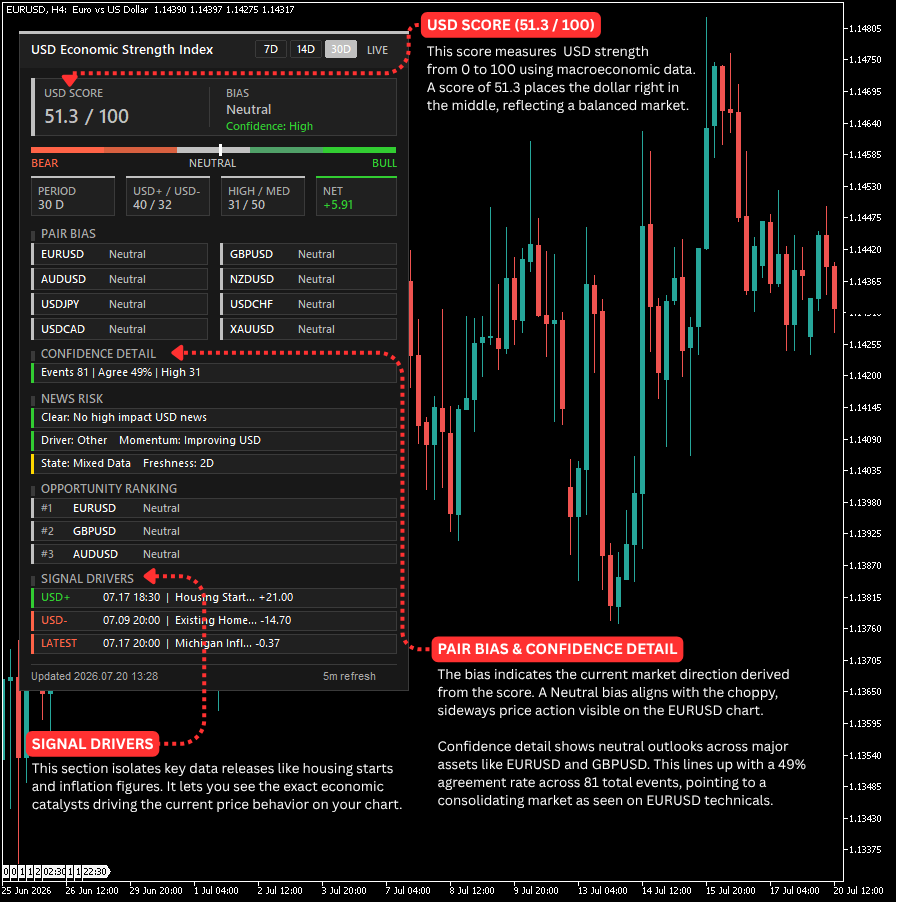
Take a look at the live chart below to see how institutional metrics map out market behavior.
1. Decoding the USD Score
Point to: "USD SCORE 51.3 / 100"
-
The Core Health Check: The USD Score measures overall US Dollar strength from 0 to 100 using real-time macroeconomic data.
-
Balanced Conditions: A score of 51.3 sits right in the middle, signaling a balanced market . This neutral reading tells you that neither buyers nor sellers have total control.
2. Neutral Bias and Sideways Price Action
Point to: "BIAS: Neutral"
-
Directional Edge: The market bias reflects the current directional trend derived directly from the score.
-
Chart Alignment: A Neutral bias aligns perfectly with the choppy, sideways price action visible on the EURUSD chart . It confirms that price is likely to bounce between established support and resistance levels rather than break out.
3. Bullish vs Bearish Data Split
Point to: "USD+ / USD- 40 / 32"
-
Data Distribution: This row tracks the total count of positive and negative economic data releases.
-
Stability Explained: With 40 positive and 32 negative events, the data leans slightly positive but remains balanced . This division explains why the currency is holding stable without a runaway trend.
4. Event Impact Depth
Point to: "HIGH / MED 31 / 50"
-
Weight of Research: This metric counts the high and medium-importance news events factored into the index.
-
Solid Foundation: Having 31 high-impact and 50 medium-impact events ensures your market view is backed by deep research . It proves the neutral score is built on heavy data, not random noise.
5. Positive Net Surprise Value
Point to: "NET +5.91"
-
The Bottom Line: The net value sums up all data surprises compared to market forecasts.
-
Holding Ground: A positive net score of +5.91 shows data is beating expectations slightly . This explains why the currency holds its ground nicely inside a range.
6. Pair Bias and Confidence Detail
Point to: "PAIR BIAS" table and "Events 81 | Agree 49% | High 31"
-
Asset Outlook: Pair bias shows neutral outlooks across major assets like EURUSD .
-
Consolidation Clues: This lines up with a 49% agreement rate across 81 total events, pointing directly to a consolidating, range-bound market .
7. Aligning Signal Drivers
Point to: "SIGNAL DRIVERS" section
-
Catalyst Isolation: This section isolates key data releases like housing starts and inflation figures.
-
Actionable Execution: It lets you see the exact economic catalysts driving the current price behavior on your chart . Use these insights to trade support and resistance with ultimate confidence!