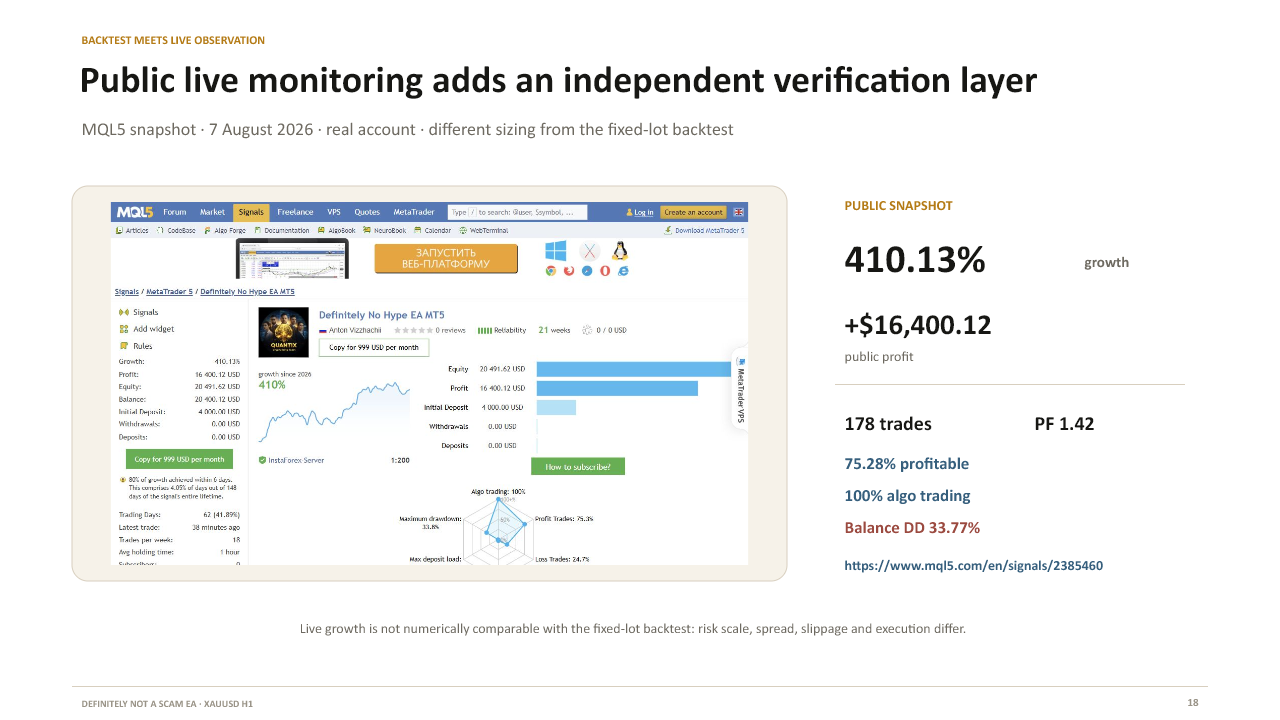
Public MQL5 snapshot captured on 7 August 2026. Live values continue to change.
A public live signal is one of the most useful forms of evidence for an automated trading system. It shows that the strategy is operating outside the tester, that trades are being recorded by an independent monitoring service and that both profitable and difficult periods remain visible.
However, a live signal is often interpreted incorrectly. Some readers expect every execution detail to be identical to a fixed-lot backtest, including the exact price, candle, lot number and monetary result. That expectation is too strict: the principal signals should remain recognisable on overlapping dates, while broker-specific execution details and risk scaling can differ.
This article explains what the public Definitely Not a Scam EA signal proves, what it does not prove and how it should be compared with the fixed-lot IC Markets real-tick tests.
The public signal
The live account is publicly monitored through MQL5: https://www.mql5.com/en/signals/2385460
The snapshot used in this article was captured on 7 August 2026. At that time, the public page displayed 410.13% growth, $16,400.12 profit, 178 trades, a Profit Factor of 1.42, 75.28% profitable trades, 100% algorithmic trading and 33.77% Balance drawdown.
These values will change as new trades are recorded. The public MQL5 page, rather than a static screenshot, should always be treated as the current source.
What the live signal genuinely proves
The signal provides independent evidence that the strategy is operating on a real account rather than only inside Strategy Tester.
It records the sequence of trades, account growth, drawdown, trade frequency and the relationship between profitable and losing outcomes.
It also prevents the presentation from relying exclusively on one historical report. A prospective user can open the public page and examine the account directly.
This is meaningful evidence of live operation. It is not a guarantee of future profitability.
What the live signal does not prove
A live signal does not prove that every future month will be profitable or that the current growth rate will continue.
It does not mean that a fixed-lot backtest and a live account must show identical percentages, drawdown, lot numbers or entry prices. At the same time, this is not an argument for unrelated trades: where the test and live account cover the same market period, the core signals should remain recognisable and broadly aligned.
It does not remove broker risk, execution risk, market risk or the possibility of losses.
It should therefore be read as an independently observable operating record, not as a promise or a numerical replica of a simulation.
Why the live account and the backtest differ
The fixed-lot reference tests use IC Markets real ticks, 99% history quality, XAUUSD H1, a $10,000 starting deposit and a constant 0.10 lot position size. The live account operates through InstaForex under a different symbol specification and a different effective risk scale.
The InstaForex XAUUSD.ls symbol shown in the terminal uses a 500 oz contract. A position of 0.01 lot therefore represents 5 ounces of gold. On a 100 oz gold contract, the same 5-ounce exposure would be 0.05 lot. The lot number alone is not a valid cross-broker comparison.
A complete explanation of the InstaForex contract is available here: InstaForex gold contract explained - My Trading - Draft - Traders' Blogs
Spread, commission, swap, slippage, price feed, execution latency and order-filling rules can create modest differences in entry price, exit price, timing and whether a borderline order is filled. Even when the underlying strategy logic is the same, two brokers do not create an identical execution environment.
The important point is that broker differences should change the details, not erase the strategy signature. On overlapping periods, the live account and the corresponding test should show broadly matching trade direction, approximate timing and recognisable trading sequences, while exact price, volume and monetary result can differ.
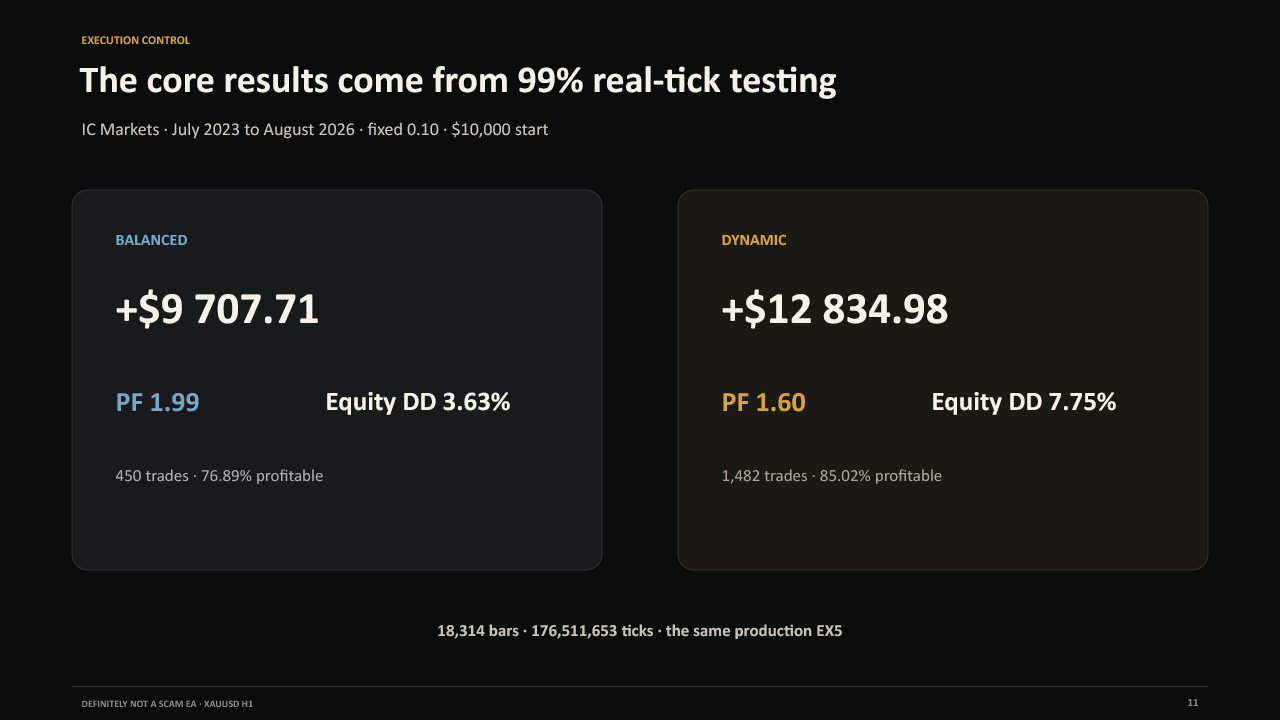
The fixed-lot reference test and the live account answer different questions and use different execution conditions.
Why a faster live curve can also mean higher risk
The final fixed-lot Balanced reference test showed 3.63% Equity drawdown, while the public live snapshot showed 33.77% Balance drawdown. These are different measurements under different sizing and execution conditions, so they should not be presented as directly equivalent.
The difference indicates that the live account is operating at a materially more aggressive effective risk scale than the fixed-lot Balanced test. Faster percentage growth is therefore accompanied by greater sensitivity to adverse periods.
This is why headline profit should never be separated from drawdown, deposit load, Balance and Equity behaviour.
The concentration-of-growth warning
At the time of the 7 August 2026 snapshot, MQL5 displayed a warning that 80% of the account growth had been achieved within six days. This is an important observation and should not be hidden.
Concentrated growth does not automatically invalidate the strategy, but it means that the headline return was not accumulated evenly. A reader should examine the full history, the periods before and after the growth impulse and the drawdown required to obtain it.
A credible presentation shows both the strong impulse and the quieter or more difficult periods around it.
How to compare the signal with the backtest
First compare trades on the same dates. The principal entries should broadly coincide in direction and timing because the same strategy logic is being used. A shift of several points, a slightly different candle, a different lot number or a different profit figure can be normal across brokers; a completely unrelated sequence would require investigation.
Then compare the trading logic and market participation rather than expecting identical account percentages.
Review whether both histories contain active phases, flat periods, losing sequences and subsequent recovery rather than judging only the final balance.
Compare Balance and Equity, maximal drawdown, Profit Factor, number of trades, trade direction, holding time and concentration of returns.
Normalise position size into actual gold exposure and monetary stop-loss risk before comparing lot numbers between brokers.
The complete historical evidence archive will be available here: Full evidence archive — 25 screenshots - My Trading - Draft - Traders' Blogs
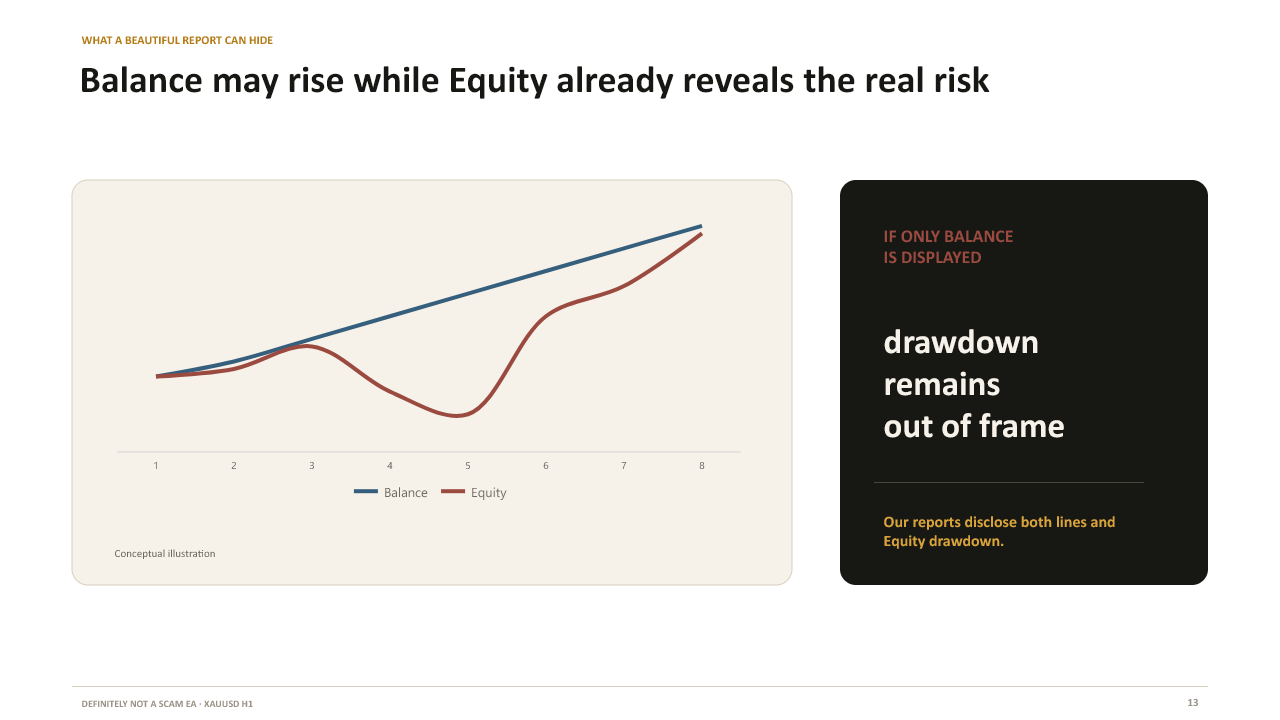
Balance alone is not enough; open-position Equity risk must remain visible.
A practical checklist for readers
1. Open the public MQL5 page instead of relying only on a screenshot.
2. Check the date of the latest trade and whether algorithmic trading remains active.
3. Review both Balance and Equity drawdown.
4. Look for concentration of profit in a small number of days or trades.
5. Compare broker contract size and effective exposure before comparing lot numbers.
6. Treat backtests as historical simulations and live monitoring as an evolving record.
7. Choose a risk profile according to acceptable drawdown, not according to the largest headline return.
Conclusion
The public signal is valuable because it makes the strategy observable in real time. It confirms live operation, reveals drawdown and records the actual sequence of outcomes.
Its purpose is not to reproduce a fixed-lot backtest number for number. On overlapping dates, its trades should nevertheless broadly correspond to the same underlying signals. The live record therefore provides an independent bridge between historical logic and real execution.
The correct interpretation is therefore balanced: recognise the live evidence, disclose the differences in broker specification and risk scale, and evaluate growth together with the drawdown required to achieve it.
Sources and risk disclosure
Public live signal: https://www.mql5.com/en/signals/2385460
Fixed-lot reference test: IC Markets real ticks, XAUUSD H1, July 2023 to August 2026, 99% history quality.
InstaForex contract explanation: Full evidence archive — 25 screenshots - My Trading - 8 August 2026 - Traders' Blogs
Complete evidence archive: Full evidence archive — 25 screenshots - My Trading - 8 August 2026 - Traders' Blogs
Past performance does not guarantee future results. Backtests are simulations, and live trading can differ because of spread, slippage, execution, broker conditions, position sizing and future market behaviour. Trading leveraged instruments involves the risk of losing capital.