
HOW TO TRADE - Webinar by Suri Duddella: The Success and Failure of Chart Patterns
10 March 2015, 03:11

1
1 544
Suri Duddella, 19+ years full-time Futures/Equities/Options Trader.
Patterns based Algorithmic Trading. Author -- "Trade Chart Patterns
Like The Pros" book.
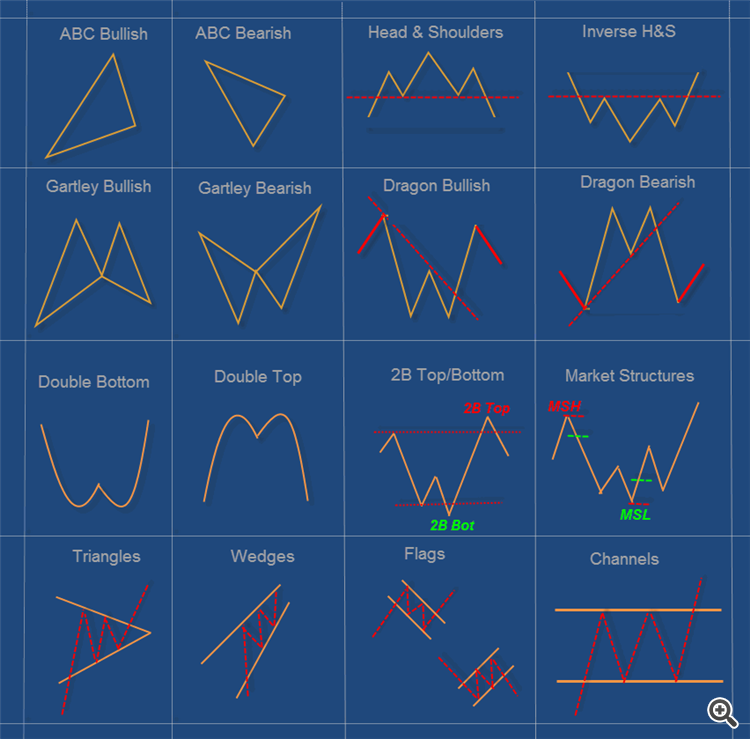
Identifying chart patterns is simply a system for predicting stock market trends and turns! Well, a trend is merely an indicator of an imbalance in the supply and demand. These changes can usually be seen by market action through changes in price. These price changes often form meaningful chart patterns that can act as signals in trying to determine possible future trend developments. Research has proven that some patterns have high forecasting probabilities. These patterns include: The Cup & Handle, Flat Base, Ascending and Descending Triangles, Parabolic Curves, Symmetrical Triangles, Wedges, Flags and Pennants, Channels and the Head and Shoulders Patterns.
- Chart Pattern Modeling
- Essential pattern structure components and analysis
- Practical statistics of patterns success and failures
- Examples of many patterns
======
Identifying chart patterns is simply a system for predicting stock market trends and turns! Well, a trend is merely an indicator of an imbalance in the supply and demand. These changes can usually be seen by market action through changes in price. These price changes often form meaningful chart patterns that can act as signals in trying to determine possible future trend developments. Research has proven that some patterns have high forecasting probabilities. These patterns include: The Cup & Handle, Flat Base, Ascending and Descending Triangles, Parabolic Curves, Symmetrical Triangles, Wedges, Flags and Pennants, Channels and the Head and Shoulders Patterns.


")