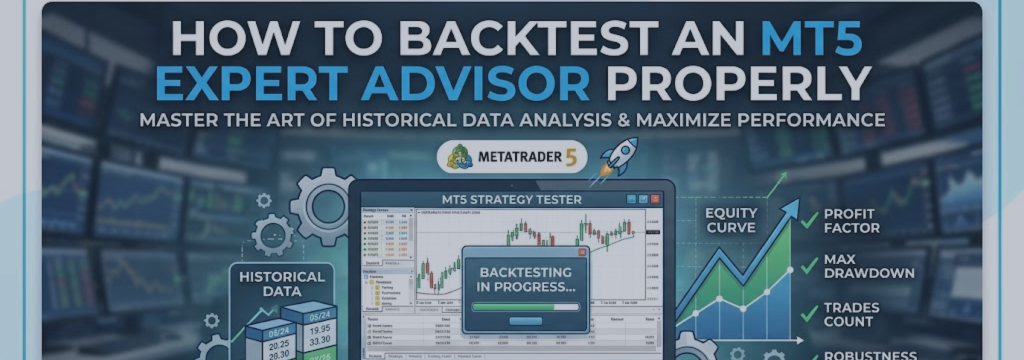

Backtesting is the process of running an Expert Advisor (EA) against historical market data to see how its rules would have behaved in the past. MetaTrader 5 includes the Strategy Tester for this purpose, allowing traders to test, optimize, visualize, and review an EA before using it on a live account.
A backtest is useful, but it is not a prediction. It cannot guarantee future performance because live markets include changing liquidity, spread variation, execution delays, slippage, broker-specific conditions, news events, and market behavior that may not match the past.
The goal of a good backtest is not to produce the highest possible historical profit. The goal is to find out whether an EA has a logical, repeatable edge that remains reasonably stable under realistic assumptions and across different market conditions.
Important: Backtesting does not remove trading risk. Historical results, optimized results, and demo results do not guarantee future performance. Always use careful risk management and test any EA thoroughly before allowing it to trade a live account.
Why Many Backtests Are Misleading
A weak backtest can create a false sense of confidence. A strategy may show an attractive equity curve because its test conditions were unrealistic, not because the strategy has a durable edge.
Common backtesting mistakes include:
- Testing only a short or unusually favorable market period.
- Using unrealistic spread, commission, swap, or execution-delay assumptions.
- Ignoring slippage and rejected-order conditions.
- Using an inappropriate price-modeling mode.
- Optimizing too many input parameters until the EA fits past noise.
- Evaluating optimized settings on the same data used to create them.
- Ignoring the effect of position sizing, margin requirements, and broker contract specifications.
- Focusing only on net profit while ignoring drawdown, trade count, and loss sequences.
An equity curve that rises smoothly in a report is not enough. You need to understand how the strategy earned its result, what conditions it depends on, how much risk it took, and how it behaved during unfavorable periods.
Step 1: Open the Strategy Tester
To open the MetaTrader 5 Strategy Tester:
- Open MetaTrader 5.
- Select View → Strategy Tester.
- Or press Ctrl+R on your keyboard.
The Strategy Tester panel opens at the bottom of the terminal. This is where you select the EA, symbol, timeframe, historical period, modeling method, account conditions, and test parameters.
You can also right-click an EA in the Navigator window and choose the testing option to load it into the Strategy Tester.
Step 2: Select the Correct EA, Symbol, and Timeframe
In the Strategy Tester settings, select the Expert Advisor you want to test. Then select the correct symbol and timeframe for that EA.
These settings should match the EA documentation and intended live setup. For example, if an EA was designed for EURUSD on M15, do not assume that testing it on XAUUSD H1 will produce meaningful results.
Review the following items carefully:
- Expert: The EA being tested.
- Symbol: The instrument used for the test, such as EURUSD, GBPUSD, XAUUSD, or an index.
- Period: The chart timeframe used by the EA, such as M5, M15, H1, or H4.
- Account currency: The currency used for the simulated deposit and report.
- Deposit: The starting account balance for the test.
- Leverage: Affects margin availability and may affect whether positions can be opened.
Use settings that resemble the intended live account whenever possible. If the EA will run on a small account with 1:100 leverage and USD as its deposit currency, testing it with an unrealistically large deposit, different leverage, or another account currency may hide important risk and margin behavior.
Step 3: Choose a Meaningful Historical Period
Do not judge an EA based on a few weeks or months of data. A short test period may contain only one market regime, such as a strong trend, a quiet range, or an unusually volatile news period.
Where enough high-quality data is available, test across multiple market conditions, including:
- Trending markets.
- Ranging or mean-reverting markets.
- High-volatility periods.
- Low-volatility periods.
- Periods with major economic or geopolitical events.
- Different sessions, if the EA trades only at certain times.
For many strategies, multiple years of data are more informative than a recent short period. However, the appropriate amount of data depends on the strategy frequency. A high-frequency intraday strategy may generate many trades in a year, while a long-term trend-following system may need several years to produce enough trades for meaningful evaluation.
Enable Use Date in the Strategy Tester and choose a clear start and end date. Keep a written record of every test period and configuration so you can reproduce your results later.
Step 4: Use an Appropriate Modeling Method
The modeling method determines how MetaTrader 5 simulates price movement during the test. This choice can significantly affect results, especially for EAs that use tight stops, intrabar entries, scalping logic, pending orders, or trailing-stop management.
For serious testing of most automated strategies, select:
Every tick based on real ticks
This mode uses historical tick information available through the broker’s data environment. It is generally the most detailed built-in choice for evaluating strategies that depend on intrabar price movement.
Other modes may be useful during early development or for fast preliminary checks, but they may not be suitable for final evaluation.
| Modeling Method | Best Use | Important Limitation |
|---|---|---|
| Every tick based on real ticks | Detailed testing of entries, stops, trailing logic, scalping, and intrabar behavior. | Quality depends on the available broker data and may take longer to run. |
| Every tick | General testing when real-tick mode is unavailable or unnecessary. | Generated tick behavior may differ from actual historical tick sequencing. |
| 1 minute OHLC | Faster preliminary testing for strategies that do not depend heavily on intrabar movement. | May miss important price movement inside each one-minute bar. |
| Open prices only | Fast testing for EAs designed to act only at the start of a new bar. | Not appropriate for most intrabar entry, exit, or stop-management systems. |
Do not use a fast modeling mode merely because it produces a more attractive result. Select the mode that reflects how the EA actually makes decisions and manages trades.
Step 5: Model Trading Costs Realistically
A backtest should include realistic trading costs. If costs are underestimated, a strategy with a small edge can appear profitable in testing but fail in live trading.
Important costs and execution factors include:
- Spread: The difference between bid and ask prices.
- Commission: A direct charge per lot or per transaction on many account types.
- Swap: Overnight financing charges or credits for positions held past rollover.
- Slippage: The difference between expected and actual execution price.
- Execution delay: The delay between a trade request and order execution.
- Stop-level restrictions: Broker rules that may limit where stop-loss or pending orders can be placed.
Spread is especially important for short-term strategies. A strategy targeting only a few points per trade may be highly sensitive to spread widening, commission, and slippage.
Whenever possible, test using the same broker, account type, symbol, and approximate trading session that you intend to use live. A broker’s EURUSD symbol, spread behavior, commission structure, and execution conditions may differ from another broker’s version of the same instrument.
Avoid assuming that today’s current spread represents the spread that existed throughout the full historical test period. Review whether the chosen test settings reflect the conditions under which the EA is expected to trade.
Step 6: Review EA Inputs Before Testing
Click Expert Properties to review the EA settings before starting a test. The Inputs tab may include lot sizing, risk percentage, stop loss, take profit, trading session, spread limit, news filter, indicator periods, trailing-stop settings, and other strategy controls.
For an initial single backtest, use a defined and documented set of inputs. Do not change parameters repeatedly until the report looks attractive. That process can lead to overfitting, where the EA becomes highly tuned to the past but less likely to behave robustly in new market conditions.
Check these settings carefully:
- Lot size, risk percentage, or money-management mode.
- Stop-loss and take-profit configuration.
- Maximum spread limit.
- Maximum number of positions or trades per day.
- Session start and end times.
- Broker-server time assumptions.
- News-filter behavior, if the EA uses one.
- Magic number and trade-management settings.
If the developer provides a .set file, you can load it in the Inputs tab. Still review every value before running the test. A preset suitable for one broker, account size, or symbol may not be suitable for another.
Step 7: Run a Baseline Backtest
Before optimizing anything, run one baseline test using a fixed, documented configuration. This gives you a starting point for understanding the EA’s behavior.
- Select the EA, symbol, timeframe, and historical date range.
- Choose the appropriate modeling method.
- Set realistic deposit, leverage, and cost assumptions.
- Load or enter the selected input values.
- Confirm that optimization is disabled for the baseline test.
- Click Start.
After the test completes, review the available tabs, including:
- Overview: High-level performance statistics.
- Settings: The configuration used in the test.
- Results: Individual trade and operation history.
- Graph: Balance and equity behavior over time.
- Report: Detailed performance metrics.
- Journal: System messages, initialization information, and errors.
Do not skip the Journal. A test may complete while still containing warnings, rejected orders, unavailable data, invalid stops, or logic errors that affect the result.
Step 8: Use Visual Mode to Inspect Trade Logic
Visual mode plays the test on a chart so you can watch how the EA enters, manages, and closes trades. It is especially useful when developing or debugging an EA.
Visual mode can help you identify issues such as:
- Trades opening on unexpected candles.
- Stop losses or take profits being placed incorrectly.
- Trailing stops behaving differently than expected.
- Multiple entries being opened when only one was intended.
- Session filters using unexpected broker-server times.
- Indicator buffers or multi-timeframe signals using the wrong bar.
Visual mode is not required for every full historical test because it can be slower. It is most valuable when verifying strategy logic, diagnosing suspicious results, or reviewing a small sample of trades.
Step 9: Separate In-Sample and Out-of-Sample Data
One of the most important ways to reduce overfitting is to separate the historical data used for development from the data used for evaluation.
In-sample data is the historical period used to develop, adjust, or optimize the EA. Out-of-sample data is a separate period kept untouched until the strategy rules and parameters are finalized.
A simple approach is to divide the full historical period into two sections:
- Use the first section to develop and optimize the strategy.
- Lock the selected settings.
- Run the exact same settings on the later, untouched section.
For example, a trader could use earlier years for strategy development and reserve the most recent portion for a final out-of-sample evaluation. The exact split depends on the strategy, amount of available data, and number of trades, but the key principle remains the same: do not tune the strategy using the data you later present as independent validation.
MetaTrader 5 also offers a forward-testing option during optimization that reserves part of the selected period for forward evaluation. This is useful, but you should still understand exactly which data was used for optimization and which data remained untouched.
Step 10: Optimize Carefully and Avoid Curve Fitting
Optimization runs the EA across multiple combinations of input values. It can be useful for exploring robust parameter ranges, but it can also create misleading results if used carelessly.
To optimize an EA:
- Enable optimization in the Strategy Tester.
- Open Expert Properties → Inputs.
- Select only a limited number of meaningful parameters for optimization.
- Define sensible start, step, and stop values.
- Choose an optimization criterion that fits the strategy objective.
- Run the optimization.
- Review results for stable parameter regions, not only the single highest-profit result.
For example, if moving-average periods of 19, 20, 21, 22, and 23 all produce broadly similar results, that may be more encouraging than one isolated setting that performs extremely well while nearby settings fail.
Warning signs of overfitting include:
- One exact parameter combination performs exceptionally well while nearby values perform poorly.
- Small changes in a setting completely reverse profitability.
- The strategy uses a large number of optimized inputs relative to its trade count.
- Performance collapses on the untouched out-of-sample period.
- The optimized equity curve is unusually smooth but cannot be explained by the strategy logic.
Optimization should help you understand robustness. It should not be used to manufacture a perfect historical result.
Step 11: Perform Walk-Forward Analysis
Walk-forward analysis is a more demanding version of out-of-sample validation. Instead of optimizing once and testing once, you repeat the process through multiple rolling historical windows.
A basic manual walk-forward workflow can look like this:
- Choose an initial optimization window, such as two years of historical data.
- Optimize the selected parameters only on that window.
- Lock the settings and test them on the next period, such as the following three months.
- Record the forward-test result.
- Move the entire window forward.
- Repeat the process across the available history.
- Combine and review the separate forward-test periods.
This process better reflects the real-world challenge of selecting parameters using only information that would have been available at that time. It does not guarantee live performance, but it helps reveal whether a strategy depends heavily on one historical period.
MetaTrader 5 can reserve a forward portion of the selected optimization period. For a full rolling walk-forward study, traders may use repeated manual testing, custom reporting, or specialized external analysis tools.
Step 12: Stress-Test the Results
Backtests represent one historical sequence. Real trading will not necessarily deliver trades in the same order, at the same spread, or with the same execution quality.
Stress testing asks a practical question: How vulnerable is this strategy if conditions are worse than the historical test suggests?
Useful stress tests include:
- Increasing assumed spread and commission.
- Testing with execution delays or random delay settings where appropriate.
- Testing alternative brokers or account types.
- Testing a wider range of market periods.
- Testing slightly different parameter values around the chosen settings.
- Reducing leverage or deposit to inspect margin sensitivity.
- Increasing slippage assumptions for fast-moving markets.
- Testing during high-volatility and low-liquidity periods.
Monte Carlo analysis is another useful method. It may randomize trade order, vary execution assumptions, perturb trade outcomes, or apply other controlled changes to estimate a range of possible drawdowns and equity paths.
MetaTrader 5 does not require Monte Carlo analysis for ordinary backtesting, and traders may use external software, spreadsheets, Python tools, or custom scripts for this step. The purpose is not to predict an exact future equity curve. It is to understand whether the strategy remains acceptable under less favorable but plausible conditions.
Metrics to Review
There is no single number that proves an EA is good. Review several metrics together and interpret them in the context of the strategy, market, timeframe, and number of trades.
| Metric | Why It Matters |
|---|---|
| Net profit | Shows the total historical result, but should never be reviewed alone. |
| Profit factor | Compares gross profit with gross loss. A value above 1 means historical gross profit exceeded gross loss, but transaction costs and robustness still matter. |
| Maximum drawdown | Shows the largest historical decline in balance or equity. It helps estimate the strategy’s potential pain and capital requirements. |
| Relative drawdown | Expresses drawdown as a percentage, making comparisons across account sizes easier. |
| Number of trades | More trades generally provide more information, although trade quality and independence also matter. |
| Expected payoff | Represents the average result per trade in the test. |
| Win rate | Shows the share of profitable trades, but a high win rate can still hide large occasional losses. |
| Average profit and average loss | Shows whether the strategy depends on many small wins, large winners, or a particular reward-to-risk profile. |
| Largest consecutive loss sequence | Helps evaluate whether your position sizing can tolerate a difficult run of losses. |
| Recovery factor | Relates net profit to drawdown and can help compare return against historical downside. |
| Equity curve behavior | Shows whether gains and losses are distributed consistently or concentrated in a small period. |
Be especially careful with a strategy that has a high win rate but very large losing trades. Some averaging, grid, or martingale-style systems can show long periods of smooth results while carrying a risk of severe loss during an adverse sequence.
Questions to Ask Before Going Live
Before using an EA on a live account, ask yourself:
- Was the EA tested over multiple market conditions?
- Were spread, commission, swap, and execution assumptions realistic?
- Was the EA tested using suitable tick modeling?
- Did the strategy perform reasonably on untouched out-of-sample data?
- Are the results stable across nearby input values?
- Can the account tolerate a drawdown larger than the historical maximum?
- Can the account tolerate a longer losing streak than the historical one?
- Do I understand exactly how the EA enters, exits, sizes, and manages risk?
- Has the EA been forward-tested on demo or very conservative live risk?
If you cannot answer these questions clearly, the strategy may not yet be ready for live deployment.
Final Thoughts
Backtesting is a decision-support process, not a profit certificate. A high-quality backtest uses realistic data, realistic costs, sufficient history, careful validation, and honest evaluation of risk.
MetaTrader 5 provides the Strategy Tester to test and optimize EAs before live use, including detailed reports and forward-testing tools. Use those tools to identify weaknesses early, then confirm behavior with forward testing before committing meaningful capital. [34][48]
Risk disclosure: This article is provided for educational purposes only and does not constitute investment advice, a recommendation, or a guarantee of results. Trading forex, CFDs, futures, and other leveraged instruments involves substantial risk and may not be suitable for all traders. Past performance and backtest results do not guarantee future results.