
Brian Shannon managed 2.5Mil in his twenties in 1994. He has remained a profitable trader through the dot-com boom and crash, the 2008 crisis, the 2020 COVID crash, the 2022 bear market, and recent market crazyness.
Brian invented the Anchored VWAP and published books and hundreds articles.
After reading this article, you will know two things:
- 1) In what market situation Anchored VWAP works best
- 2) How to make an automated trading agent that uses it
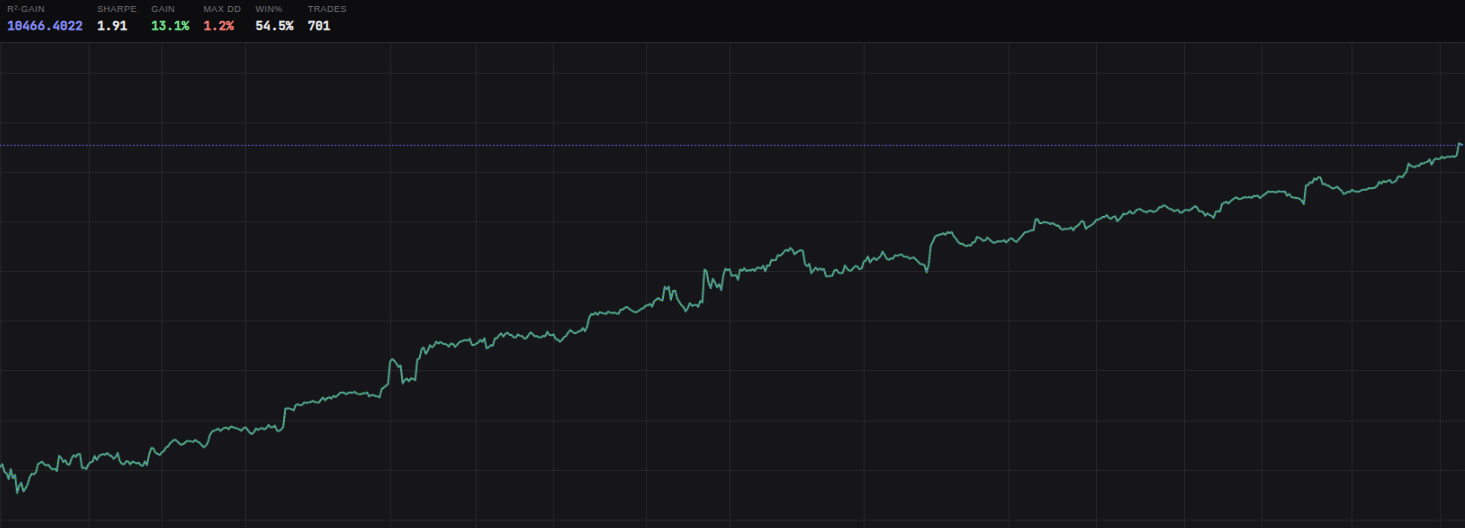
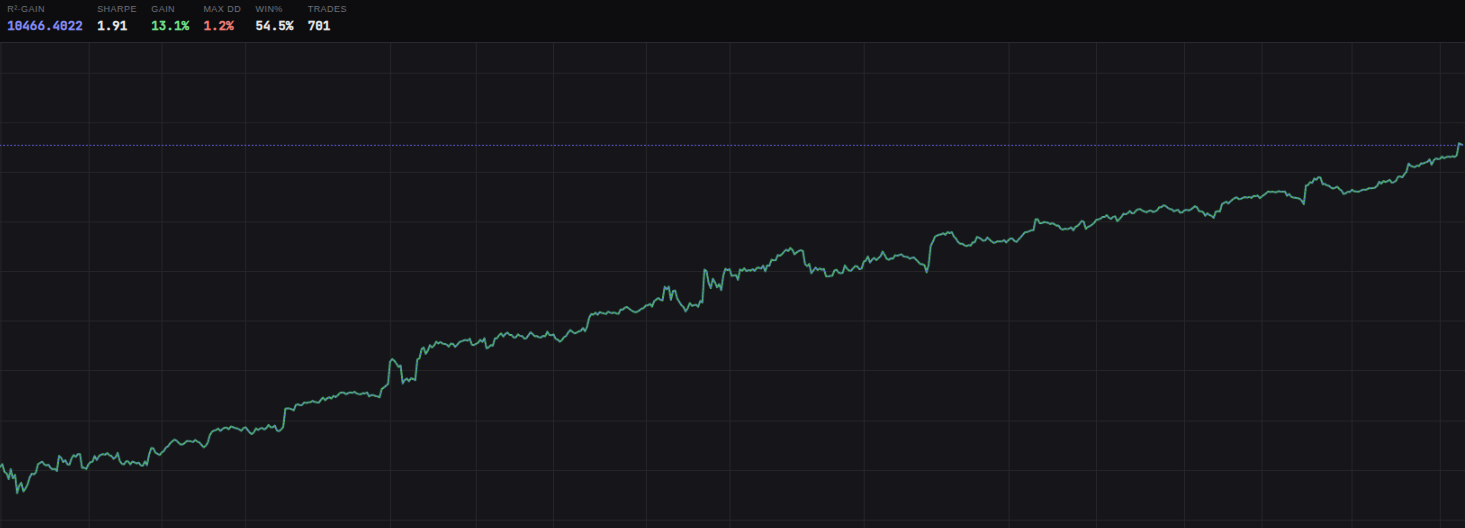
This performance is the result after following the steps in this article.
What Is Standard VWAP?
VWAP stands for Volume Weighted Average Price. In simple terms, it represents the average cost basis of the market for the day. To calculate it: multiply each block of shares traded by their price, add them up, then divide by total shares.
In the stock market where thousands of transactions happen daily, VWAP gives you a rough sense of whether buyers are in the money or out of the money. Critically, VWAP is a key metric used by institutional traders running algorithms. Execution traders at hedge funds and major banks try to execute as favorably as possible versus VWAP while minimizing market impact and slippage.
Key insight: VWAP estimates the price movements better than EMA because it uses the volume of moved capital to weight the price changes.The Limitation of Standard VWAP
Standard VWAP resets every day. If something important happens, such as earnings or a major breakout, you lose the continuity. That's where Anchored VWAP comes in.
Anchored VWAP is simply VWAP, but instead of starting from the beginning of the trading day, you pick the anchor point. The anchor could be:
- The low of a panic sell-off
- An episodic pivot (as Christian Kalamagi teaches)
- The day a trend started
- Even the IPO day
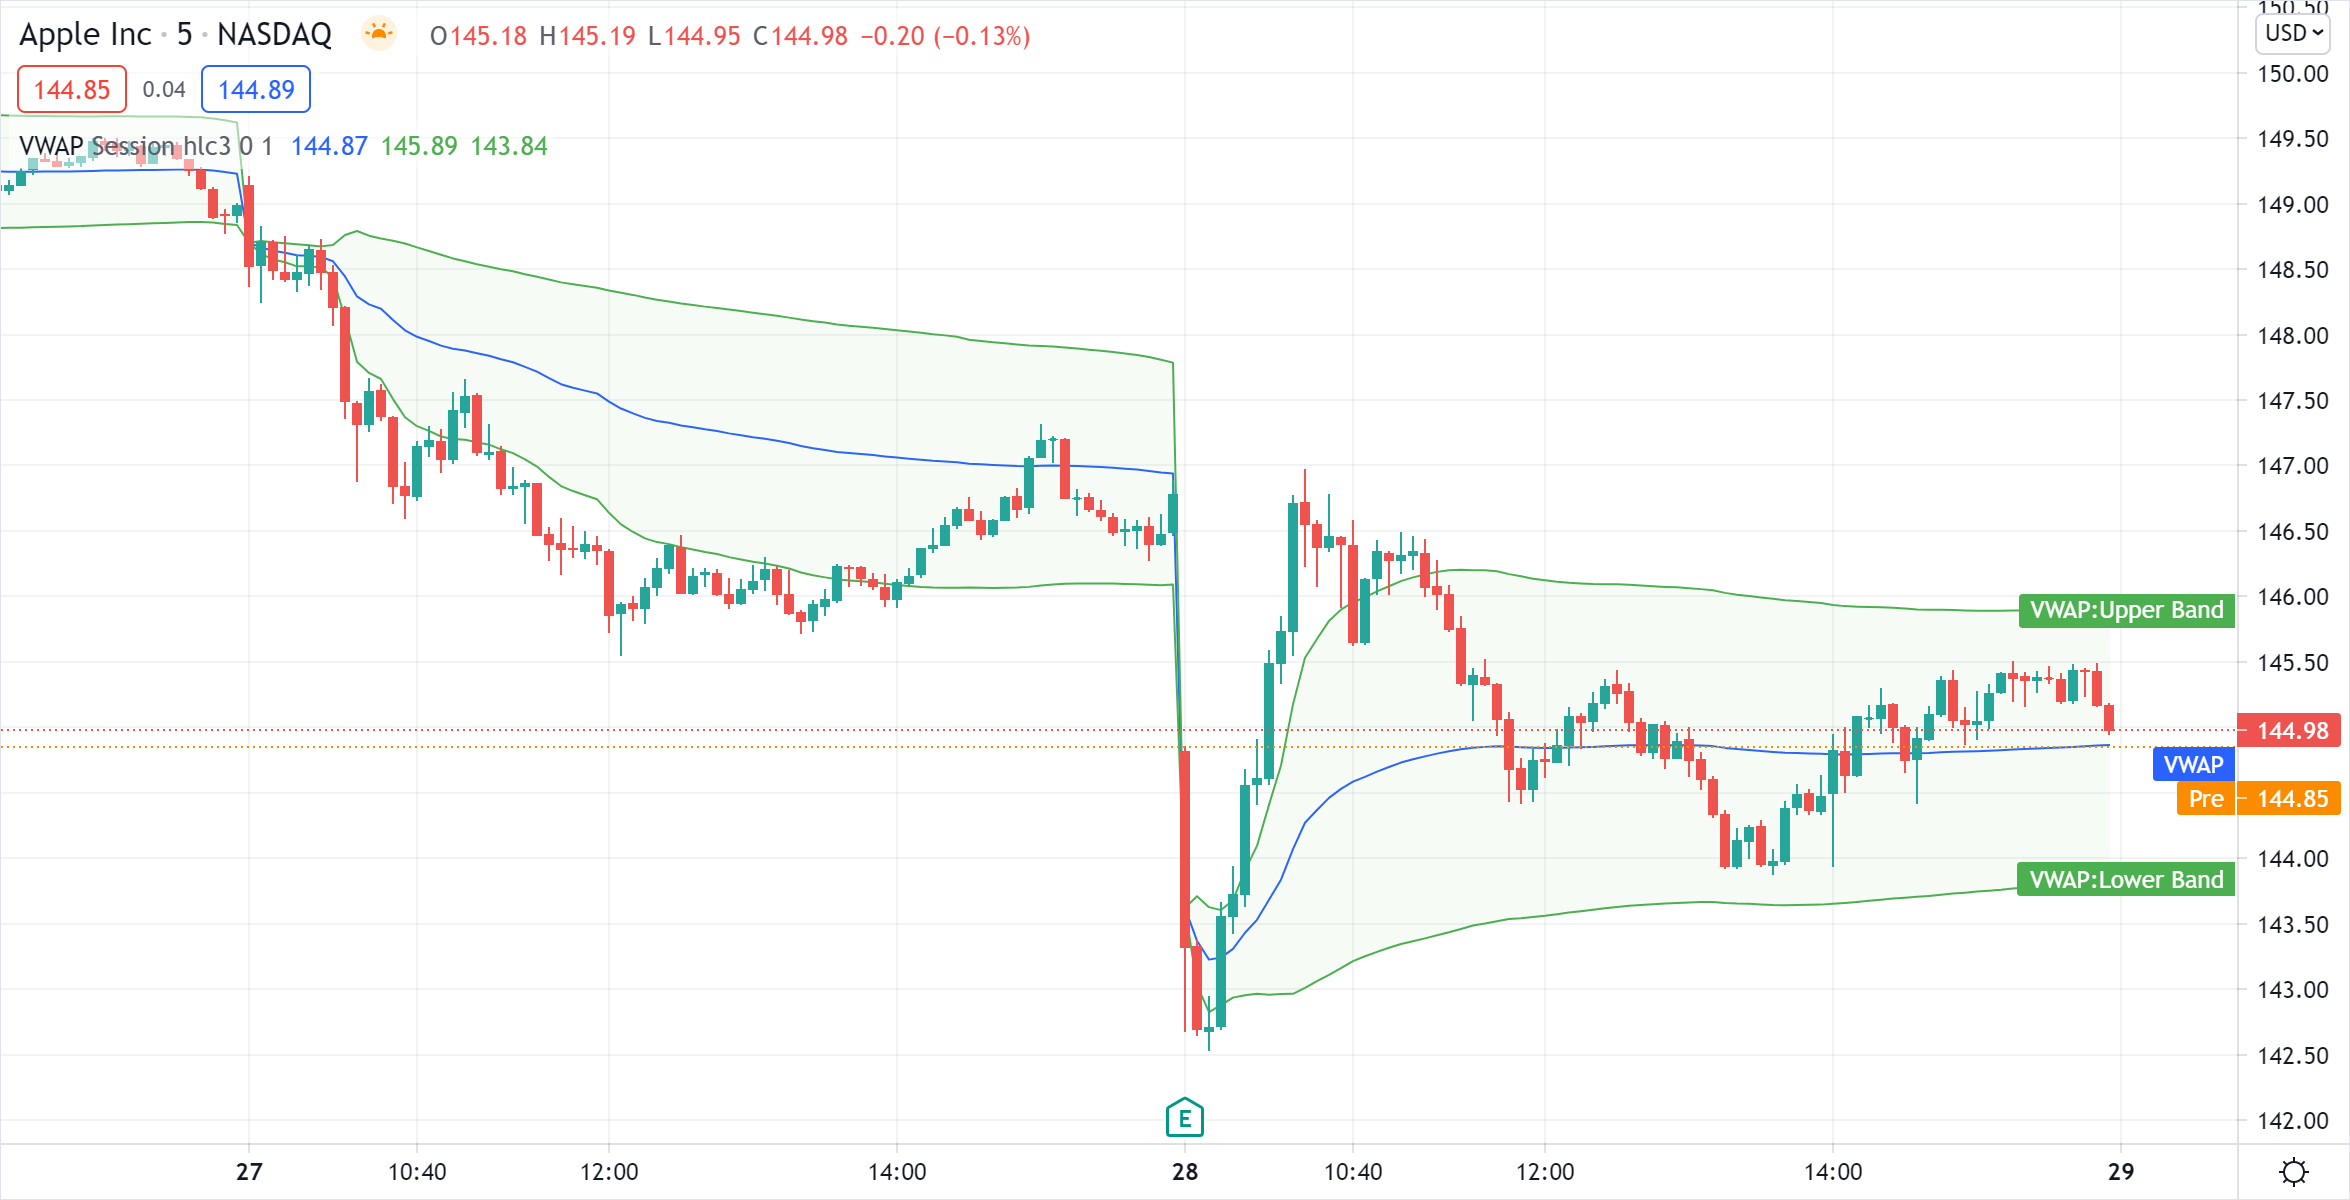
From that point forward, the line tells you the average price of all volume since that moment. That's insanely valuable because markets are about positioning.
Why Anchored VWAP Works
Every single transaction, every chart, and all of technical analysis is really just a visual representation of the psychology of the holders and those transacting. What Anchored VWAP does is provide a visual approximation of the rough average price of the average holder since key catalyst events or significant moments in the chart.
If price is above Anchored VWAP, the average buyer since that key moment is in profit. If it's below, they're underwater. People who are underwater behave differently: they panic, they sell, and they chase. Anchored VWAP helps you see that psychology in real time.
Anchor Examples
One key heuristic from experienced traders: don't short a stock above Anchored VWAP unless it has capitulated, and don't long a stock below Anchored VWAP unless it has capitulated.
Example: Circle IPO. Following Circle's IPO, the stock exploded from $110 towards $300. The rule of not shorting above Anchored VWAP kept traders out of trouble. Only after a big capitulation day on June 23rd did it become viable to attack the stock on the short side. Simple systems like this keep you out of trouble when the trend is against you, yet keep you involved once the trend has reversed.
United Healthcare (UNH) was getting hammered on bad news, with the nail in the coffin being a criminal investigation for alleged Medicare fraud on May 15th, 2025. That day saw massive volume, capitulation lower, yet the stock retraced and closed strong. Ever since, price held above Anchored VWAP anchored to that news event. This created a clean structure for a swing long that, as of the analysis, still hadn't been stopped out.
How to automate trading with VWAP?
We evaluated several AI models and coding harnesses in building a profitable strategy. And though this sounds trivial, AI-Backbone is the only one that delivered.
The process is simple: think, build, improve.
1. Think
First of all, lets chose when to start the VWAP anchor. Since its hard to predict the news or its impact, let's anchore the VWAP on moments, where the volatility spikes. This can be measured with ADX.
2. Build
We will ask the builder to build that strategy.
- If Volatility (e.g. jump up) spikes, start VWAP Anchor
- If the price remains above VWAP, open a long position.
- Close when the price touches VWAP
Now lets ask the Ai builder to build that strategy for us:
Build me a new strategy. It measures the volatility with ADX (use variable parameters).
If Volatility spikes (e.g. price jumps up), start VWAP Anchor.
If the price remains above VWAP, open a long position.
Close when the price touches VWAP or the opposite stadard_deviation*k (use parameters to let me chose which variant and which k).
Introduce a second ADX that simulates the volume (can be specified via variable parameters) for VWAP (Forex data does not provide real volume).
Ask questions and propose improvements from your knowledge hub.
The builder will take some seconds to do the research about your idea and come back with the results and questions.
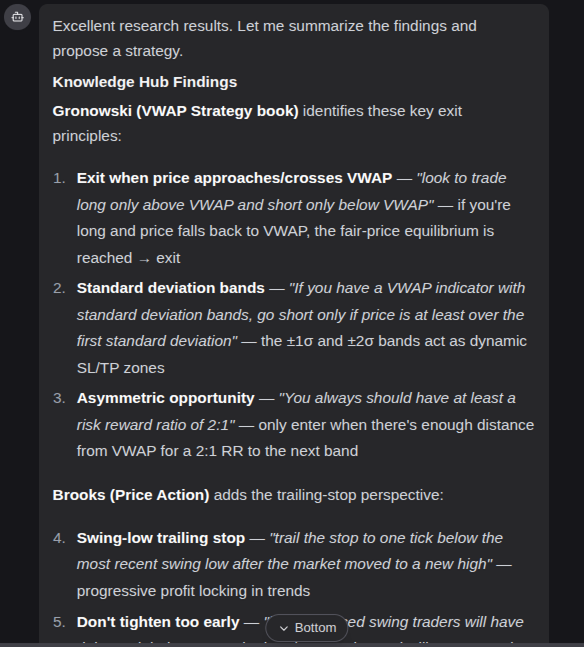
It will also ask you a few clarifications that you can directly answer in the chat
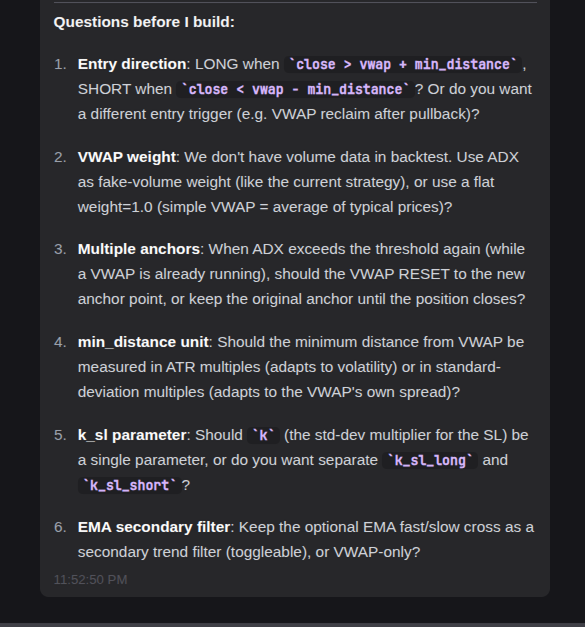
3. Improve
After the builder delivers the first draft of the strategy, it will do something special:
It will define parameters, that we can change in order to foster the initial idea to our market asset.
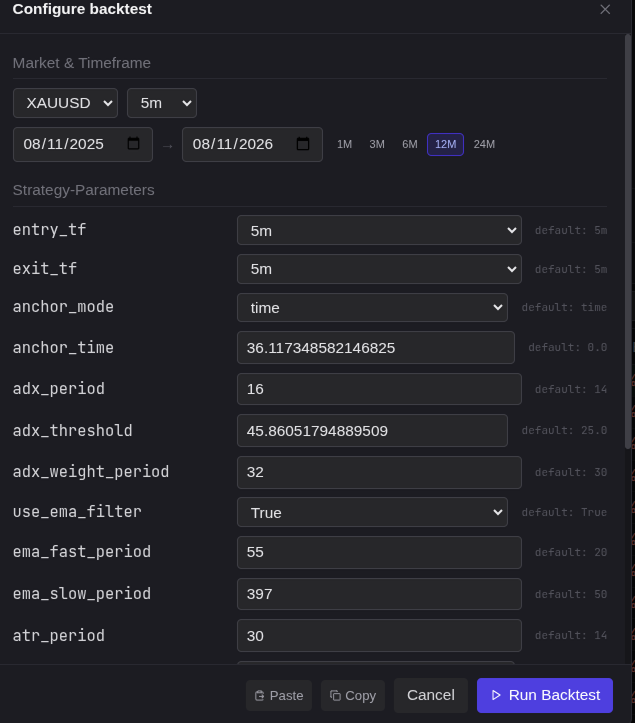
And now comes the crazy part: Given the free parameters, we apply one of the most novel scientific algorithms to improve the strategy.
The optimization does the second heavy lifting.
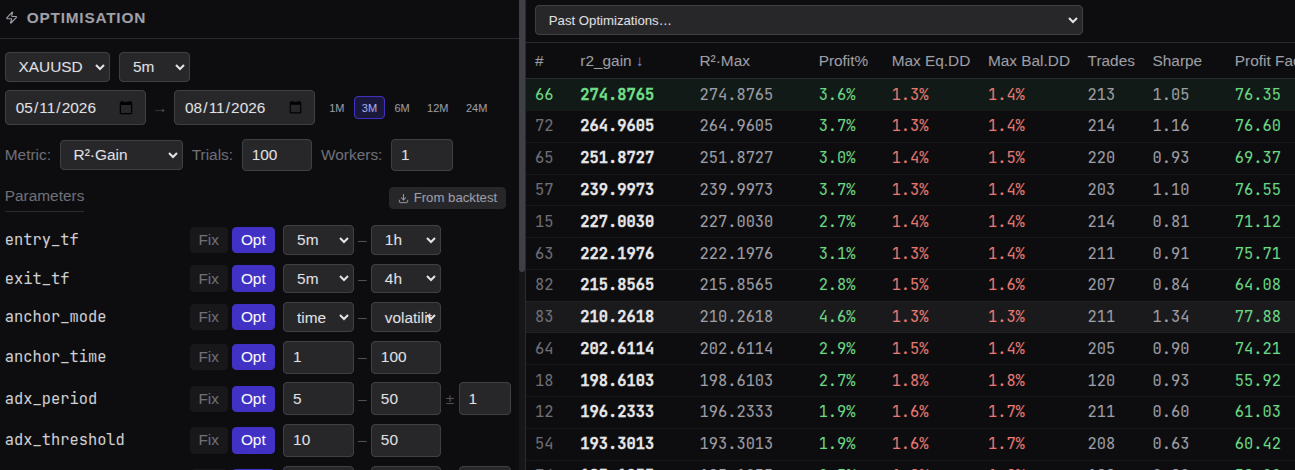
Did you notice the r2_gain column? It is the result of our proprietary robustness metric of the strategy, that we will cover in our future article.
Final Results
The optimizer delivers several variants. Let simply take the one with the best r2_gain value
The generated strategy has following properties:
- It does not use martingale or grid
- It uses fixed lot sizes only. Dynamic position sizes have usually great potential to improve a strategy
- The strategy is robust against market shocks and different regimes.