
Learn how to design a trading system by Parabolic SAR

Introduction
In this article, you will learn in detail about a new useful technical indicator that can be used in your trading as per your trading style if it is suitable. This technical indicator is the Parabolic SAR. We will learn how to design a trading system to be used in the MetaTrader5 trading platform after writing the code of this trading system by the MetaQuotes Language Editor built in with the MetaTrader 5. If you want to learn how to get the MetaTrader 5 and how to find the MetaQuotes Language Editor you can check the topic of Writing MQL5 code in the MetaEditor. We will learn the core of this article through topics that will cover it and these topics are:
- Parabolic SAR definition
- Parabolic SAR strategy
- Parabolic SAR strategy blueprint
- Parabolic SAR trading system
- Conclusion
Through the previous topics, we will learn how to design a simple trading system based on simple strategies of Parabolic SAR indicator and the concept behind it. Through the Parabolic SAR definition topic, we will learn in more detail what is the Parabolic SAR indicator or what does it mean and how we can calculate this indicator to learn the concept behind it and this approach will make it easy to use this Parabolic SAR indicator effectively. Then we will learn how to use this Parabolic SAR indicator through simple strategies based on the concept of this indicator as per what we learned and we will learn this through the topic of Parabolic SAR strategy. Then, we will design a blueprint for mentioned simple strategies and this blueprint will help us to design our trading system step-by-step through a clear blueprint for strategies and for what we need to build. Then we will go through the most interesting topic in this article as we will learn how to write the code of the trading system to let the computer to examine our designed conditioned and return signal according to our strategies and this process will be automatically and accurately through the designed expert advisor based on our simple strategies.
Before we go through our topics I like to give some advice and it is to apply what you learn by yourself because this approach will deepen your understanding and you must test any strategy or anything thing before using it in the real account especially if you learned it from educational sources because it might be not useful for your trading.
Disclaimer: All information provided 'as is' only for educational purposes and is not prepared for trading purposes or advice. The information does not guarantee any kind of result. If you choose to use these materials on any of your trading accounts, you will do that at your own risk and you will be the only responsible.
Now let us start our interesting journey through the topics of this article.
Parabolic SAR definition
In this part, we will learn in more detail about the Parabolic SAR indicator that is created by Welles Wilder. the name of this indicator came from "Parabolic" which refers to the formation of the indicator on the chart and "SAR" refers to Stop And Reverse, or you may find its name Parabolic Time/Price system the same as Welled Wilder called it in his book "New Concepts in Technical Trading Systems".
The Parabolic SAR indicator is a trend following indicator and used during the trending markets, this indicator allows the instrument to react during the few periods after you placed a trade then stop levels begin to move. So, we can say that the main objective of this indicator is to allow you to set suitable stops according to the current market direction or trend and you can read the trend definition topic to know more about the trend if you do not know.
In other words, the main objective of this Parabolic SAR indicator is to create trailing stops. The stop is a function of two things: time and price, according to the function of price, we can find that the stop will move up or down as per the price movement relatively and according to the function of time, we can find that the stop will move every period regardless the direction of the price.
So, we need first to determine the trend then we can use the Parabolic SAR tactics. So far, we learned what the Parabolic SAR indicator stands for and what it can tell us and now we need to know how we can calculate this indicator manually to learn the concept behind it and the following is the way to do that.
As per what we learned we need first to determine the trend or the direction of the market and then according to this determination, we will divide the calculation into two cases, one of them is how to calculate the Parabolic SAR during the rising market and it will return the rising SAR and the other case is how to calculate the Parabolic SAR during the declining market and it will return the falling SAR. So, we will calculate these two things: The rising SAR in case of the rising market and the falling SAR in case of the declining market.
- The rising SAR:
- Determine the prior SAR value = the previous SAR value of the previous period.
- Determine the extreme point (EP) = the highest high value of the current uptrend.
- Determine the acceleration factor (AF) = value between 0.02 and 0.20. After determining the first minimum value which is 0.02, the value will be determined as per the (EP) as AF will be increased by 0.02 every time EP creates a new high to approach the maximum value of 0.20 regardless of how long the trend will extend.
- Current Parabolic SAR value = prior SAR (step 1) + prior AF * (prior EP-prior SAR).
Let us take an example of this case which is the rising SAR if we have the following data from the market:
| Day | High | Low |
|---|---|---|
| 1 | 45 | 43 |
| 2 | 44 | 43.5 |
| 3 | 46 | 43 |
| 4 | 47 | 42 |
| 5 | 48 | 42.5 |
| 6 | 47.5 | 42.75 |
| 7 | 48 | 42.60 |
| 8 | 47.75 | 42.5 |
| 9 | 48 | 43 |
| 10 | 49 | 42.5 |
| 11 | 48.75 | 42.60 |
| 12 | 50 | 42 |
| 13 | 51 | 42.5 |
| 14 | 52 | 43 |
| 15 | 51.5 | 42.5 |
| 16 | 51 | 42 |
| 17 | 52 | 43 |
| 18 | 53 | 44 |
| 19 | 54 | 45 |
Now we need to calculate the rising SAR and it will be the same as the following:
- Determine the prior SAR value = the previous SAR value of the previous period and in this example, the first value in yellow color, is given for simplification which is equal to 42.
- Determine the extreme point (EP) = the highest high value of the current uptrend, which is will be 48
- Get the difference between EP and SAR, the difference will be 48-42 =6
- Determine the acceleration factor (AF) = value between 0.02 and 0.20, it will be 0.02 for the first value
- Multiply AF by the difference between EP and SAR, the value will be 0.12
- Calculate the current SAR by adding the result of multiplying prior AF by the difference between EP and SAR which is the result of step five to prior SAR, the value will be 42.12
The following is a picture of all calculated values of the example:

As we can see in the SAR column, the SAR values rise every day during the period.
- The falling SAR:
- Determine the prior SAR value = the previous SAR value of the previous period.
- Determine the extreme point (EP) = the lowest low value of the current downtrend.
- Determine the acceleration factor (AF) = value between 0.02 and 0.20. After determining the first minimum value which is 0.02, the value will be determined as per the (EP) as AF will be increased by 0.02 every time EP creates a new low to approach the maximum value of 0.20 regardless of how long the trend will extend.
- Current Parabolic SAR value = prior SAR (step 1) - prior AF * (prior EP-prior SAR).
Let us take an example of this case which is the falling SAR if we have the following data from the market:
| Day | High | Low |
|---|---|---|
| 1 | 54 | 45 |
| 2 | 53 | 44 |
| 3 | 52 | 43 |
| 4 | 51 | 42 |
| 5 | 51.5 | 42.5 |
| 6 | 52 | 43 |
| 7 | 51 | 42.5 |
| 8 | 50 | 42 |
| 9 | 48.75 | 42.6 |
| 10 | 49 | 42.5 |
| 11 | 48 | 43 |
| 12 | 47.75 | 42.50 |
| 13 | 48 | 42.60 |
| 14 | 47.50 | 42.75 |
| 15 | 48 | 42.50 |
| 16 | 47 | 42 |
| 17 | 46 | 43 |
| 18 | 44 | 43.50 |
| 19 | 45 | 43 |
Now, we will calculate the falling SAR values for the given period and it will be the same as the following:
- Determine the prior SAR value = the previous SAR value of the previous period and in this example, the first value in yellow color, is given for simplification which is equal to 51.
- Determine the extreme point (EP) = the lowest low value of the current downtrend, which is will be 42
- Get the difference between EP and SAR, the difference will be 51-42 =9
- Determine the acceleration factor (AF) = value between 0.02 and 0.20, it will be 0.02 for the first value
- Multiply AF by the difference between EP and SAR, the value will be 0.18
- Calculate the current SAR by subtracting prior SAR from the result of step 5, the value will be 50.82
The following is a picture for the calculation of all values during the given period:
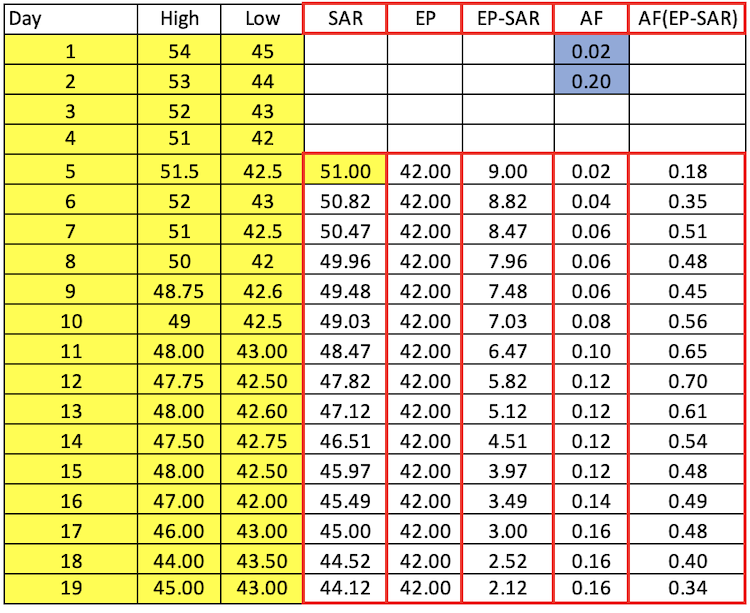
As we can see in the SAR column, the SAR values decline every day during the period.
Fortunately, we do not need to calculate the Parabolic SAR indicator or any other indicator because we have this indicator built in with the MetaTrader 5 trading platform and all that we need is to select the indicator among the available indicators. The following is how we can do that:
While opening the MetaTrader 5, you can click the insert tab --> select Indicators --> select Trend --> select Parabolic SAR

After that we can find the Parabolic SAR parameters window the same as the following:

1- to determine the step (AF) that will be added every time the price creates a new high or low.
2- to determine the maximum value of (AF) and the same as we learned that the default is 0.20.
3- to determine the color of the indicator.
4- to determine the style of the indicator.
After determining the suitable parameters of the Parabolic SAR indicator and pressing "OK", we can find it attached to the chart the same as the following:

As we can see in the previous picture that during the up movement, we can find the Parabolic SAR is moving below prices and continuing moving to up as per the movement and the vice versa, during the down movement, we can find the Parabolic SAR indicator is moving above prices and continuing moving to down as per the movement.
Parabolic SAR strategy
In this topic, we will learn some simple strategies that can be used by the Parabolic SAR and do not forget you have to test any strategy before using it on your real account as the main objective here is to learn the concept of a new tool and how to design a trading system for it.
We mentioned that this Parabolic SAR indicator is a trend following, and we can use it during trending markets, uptrends, and downtrends. So what we will do is first determine the trend then we can use the Parabolic SAR accordingly.
- Strategy one: uptrend strategy:
According to this strategy, for every tick, we need to compare the Parabolic SAR value with the prices and decide if there is a buy signal or not because we can find that the buy signal will be generated when the Parabolic SAR value is less than the lowest price, and we may have another signal and it is a take profit signal when the SAR value becomes above the highest price.
SAR value < the price low = buy
SAR value > the price high = take profit
- Strategy two: downtrend strategy:
This strategy will be the opposite of the uptrend strategy, according to it, for every tick we need to compare the Parabolic SAR value with the prices and decide if there is a sell signal or not because we can find that the sell signal will be generated when the Parabolic SAR value is greater than the highest price, and we may have another signal and it is a take profit signal when the SAR value becomes below the lowest price.
SAR value > the price high = sell
SAR value < the price low = take profit
- Strategy three: buy signal with trailing stop strategy:
According to this strategy, for every tick, we need to compare SAR value with prices and decide if we have a buy signal, and determine trailing stops for every tick according to the Parabolic SAR indicator value. So when the SAR value is less than the price low, this will be a buy and we will get the trailing stop loss level according to the indicator value.
SAR value < the price low = buy --> trailing stop value as per SAR value
- Strategy four: sell signal with trailing stop strategy:
According to this strategy, at every tick, we need to compare SAR value with prices and decide if we have a sell signal, and determine trailing stops for every tick according to the Parabolic SAR value. So when the SAR value is greater than the price high, this will be a sell and we will get the trailing stop level according to the SAR value.
SAR value > the price high = sell --> trailing stop value as per SAR value.
Parabolic SAR strategy blueprint
In this topic, we will design a blueprint for our strategies to help us to write the code of the trading system for them as it will allow us to arrange and structure our minds to know what we need to inform the expert advisor to do step-by-step, so the following is a blueprint for each strategy.
- Strategy one: uptrend strategy:
We will inform the computer or the expert advisor about what he needs to check and what it will return in case of conditions are met, and in this strategy, we need to check the SAR value and compare it to the price level and then decide if SAR value is less than the low price or not and if not we need it to return nothing or if yes we need the expert to return a buy signal then when checking them and comparing two value again and decide if SAR value is greater the high value or not and if not we need the program to return nothing or if it is, we need it to return a take profit signal.
SAR value < the price low = buy
SAR value > the price high = take profit

- Strategy two: downtrend strategy:
In this strategy, we need to check the SAR value and compare it to the price level and then decide if the SAR value is greater than the high price or not, if not we need it to return nothing or if yes we need the expert to return a sell signal then when checking and comparing two value again and decide if SAR value is less than the low value or not and if not we need the program to return nothing or if it is, we need it to return a take profit signal.
SAR value > the price high = sell
SAR value < the price low = take profit

To write the code of this strategy, we the program to check the SAR value and return the trailing stop value and check this value with the high and low and decide if the SAR value is less than the low price or not and if not return the trailing stop value only and if it is, we need it to return a buy signal and the trailing stop value.
trailing stop level only --> SAR value < the price low = buy --> trailing stop value as per SAR value

- Strategy four: sell signal with trailing stop strategy:
To write the code of this strategy, we the program to check the SAR value and return the trailing stop value and check this value with the high and low and decide if the SAR value is greater than the high price or not and if not return the trailing stop value only and if it is, we need it to return a sell signal and the trailing stop value.
trailing stop value only --> SAR value > the price high = sell --> trailing stop value as per SAR value

Parabolic SAR trading system
In this interesting topic, we will learn how to write the code of every mentioned strategy by MQL5 (MetaQuotes Language Editor) to design a trading system for each one of them to execute these strategies on the MetaTrader 5 trading platform automatically and accurately.
First, we will learn how to write a code to design a simple trading system to return a comment with the Parabolic SAR value, and to write this simple expert we will follow the below steps.
- Create an array for Parabolic SAR and we will use "double" function:
double SARArray[]; - Sort the array from the current data by using "ArraySetAsSeries" function and it return a boolean:
ArraySetAsSeries(SARArray,true);
- Define SAR indicator by using "iSAR" function:
int SARDef=iSAR(_Symbol,_Period,0.02,0.2);
- Fill SARArray with SAR definition by using "CopyBuffer" function:
CopyBuffer(SARDef,0,0,3,SARArray);
- Calculate the value of SAR by using "NormalizeDouble" function after creating a variable for SAR value by "double" function:
double SARValue=NormalizeDouble(SARArray[0],5);
- Chart output with the SAR value by using a comment function:
Comment("Parabolic SAR value is ",SARValue);
After that we can find the code as a full block the same as the following:
//+------------------------------------------------------------------+
//|                                  Simple Parabolic SAR System.mq5 |
//|                                  Copyright 2022, MetaQuotes Ltd. |
//|                                             https://www.mql5.com |
//+------------------------------------------------------------------+
#property copyright "Copyright 2022, MetaQuotes Ltd."
#property link      "https://www.mql5.com"
#property version   "1.00"
//+------------------------------------------------------------------+
void OnTick()
  {
   //create a SAR array
   double SARArray[];

   //sort array from current data
   ArraySetAsSeries(SARArray,true);

   //define SAR EA
   int SARDef=iSAR(_Symbol,_Period,0.02,0.2);


   //fill SARArray with SARDef
   CopyBuffer(SARDef,0,0,3,SARArray);

   //calculate value of last data
   double SARValue=NormalizeDouble(SARArray[0],5);

   //chart comment with the signal
   Comment("Parabolic SAR value is ",SARValue);
  }
//+------------------------------------------------------------------+
After writing and compiling this code, we can find it in the navigator the same as the following picture:

We will double-click or drag and drop the file on the chart to execute the expert advisor and get the results or outcomes of the system, then we will find the following window:

Then, we will tick next to "Allow Algo Trading" and press ok and we can find the system or the expert advisor is attached to the chart the same as the following:

And the following picture is an example of generated signals of this system:

- Strategy one: uptrend strategy:
The same as what I mentioned in this strategy we need to set our conditions for the trading system to generate a buy signal when the SAR value is less than the low price and generate a take profit signal when the SAR value becomes greater than the high price and the following is how to code this strategy:
- Create a string variable for the signal by using the "string" function:
string signal="";
- Create an array for price by using the "MqlRates" function, it stores information about the prices, volumes and spread:
MqlRates PriceArray[]; - Sort the price array from the current data by using the "ArraySetAsSeries" function:
ArraySetAsSeries(PriceArray,true);
- Fill the array with price data by using the "CopyRates" function, this function gets history data of "MqlRates" structure after storing Data as an integer:
int Data=CopyRates(_Symbol,_Period,0,3,PriceArray);
- Create another array for SAR value by using the "double" function:
double SARArray[]; - Sort the SAR array from the current data by using the "ArraySetAsSeries" function:
ArraySetAsSeries(SARArray,true);
- Define the SAR indictor for the EA by using the "iSAR" function as it returns the handle of the Parabolic SAR indicator after storing "SARDef" as an integer to refer to the SAR definition:
int SARDef=iSAR(_Symbol,_Period,0.02,0.2);
- Fill the SARArray with SARDef by using the "CopyBuffer" function as it gets data of a specific buffer of a specific indicator:
CopyBuffer(SARDef,0,0,3,SARArray);
- Calculate the SAR value of the last data by using the "NormalizeDouble" function that it returns the double value type:
double SARValue=NormalizeDouble(SARArray[0],5);
- Set conditions of the "buy" signal by using the "if" function, if SAR value is less than the price low, it must return the "Buy" signal:
   if(SARValue < PriceArray[1].low)
   {
      signal="Buy";
   }
- Set conditions of the "take profit" signal by using the "if" function, if the SAR value is greater than the high price, it must return the "Take Profit" signal:
   if(SARValue > PriceArray[1].high)
   {
      signal="Take Profit";
   }
- Comment generated signal on the chart by using the "Comment" function:
Comment("The signal is ",signal);
Through the previous steps, we created a trading system for this strategy and the following is the full code in one block:
//+------------------------------------------------------------------+
//|                      Parabilic SAR System - Uptrend Strategy.mq5 |
//|                                  Copyright 2022, MetaQuotes Ltd. |
//|                                             https://www.mql5.com |
//+------------------------------------------------------------------+
#property copyright "Copyright 2022, MetaQuotes Ltd."
#property link      "https://www.mql5.com"
#property version   "1.00"
//+------------------------------------------------------------------+
void OnTick()
  {
   //create an string variable for signal
   string signal="";

   //create a price array
   MqlRates PriceArray[];

   //sort array from the current data
   ArraySetAsSeries(PriceArray,true);

   //fill array with price data
   int Data=CopyRates(_Symbol,_Period,0,3,PriceArray);

   //create a SAR array
   double SARArray[];

   //sort array from current data
   ArraySetAsSeries(SARArray,true);

   //define SAR EA
   int SARDef=iSAR(_Symbol,_Period,0.02,0.2);


   //fill SARArray with SARDef
   CopyBuffer(SARDef,0,0,3,SARArray);

   //calculate value of last data
   double SARValue=NormalizeDouble(SARArray[0],5);

   //buy signal
   //if current SAR value below candle 1 low
   if(SARValue < PriceArray[1].low)
   {
      signal="Buy";
   }

   //take profit signal
   //if current SAR value above candle 1 high
   if(SARValue > PriceArray[1].high)
   {
      signal="Take Profit";
   }

   //comment with the signal
   Comment("The signal is ",signal);
  }
//+------------------------------------------------------------------+
After compiling this code, we can find it in the navigator window the same as the following picture:

By double-clicking or dragging and dropping the file on the chart, the following window will appear:

After pressing "OK", we will find the expert advisor attached to the chart the same as the following picture:

After that, we can find signals generated on the chart as comments the same as the following pictures as examples from testing:
- Buy signal:

- Take profit signal:

- Strategy two: downtrend strategy:
In this strategy, we need to set our conditions for the trading system to generate a sell signal when the SAR value is greater than the high price and generate a take profit signal when the SAR value becomes less than the low price the following is how to code this strategy:
//+------------------------------------------------------------------+
//|                    Parabolic SAR System - Downtrend Strategy.mq5 |
//|                                  Copyright 2022, MetaQuotes Ltd. |
//|                                             https://www.mql5.com |
//+------------------------------------------------------------------+
#property copyright "Copyright 2022, MetaQuotes Ltd."
#property link      "https://www.mql5.com"
#property version   "1.00"
//+------------------------------------------------------------------+
void OnTick()
  {
   //create an string variable for signal
   string signal="";

   //create a price array
   MqlRates PriceArray[];

   //sort array from the current data
   ArraySetAsSeries(PriceArray,true);

   //fill array with price data
   int Data=CopyRates(_Symbol,_Period,0,3,PriceArray);

   //create a SAR array
   double SARArray[];

   //define SAR EA
   int SARDef=iSAR(_Symbol,_Period,0.02,0.2);

   //sort array from current data
   ArraySetAsSeries(SARArray,true);

   //fill SARArray with SARDef
   CopyBuffer(SARDef,0,0,3,SARArray);

   //calculate value of last data
   double SARValue=NormalizeDouble(SARArray[0],5);

   //buy signal
   //if current SAR value below candle 1 low
   if(SARValue > PriceArray[1].high)
   {
      signal="Sell";
   }

   //take profit signal
   //if current SAR value above candle 1 high
   if(SARValue < PriceArray[1].low)
   {
      signal="Take Profit";
   }

   //chart comment with the signal
   Comment("The signal is ",signal);
  }
//+------------------------------------------------------------------+
- Differences in this strategy code are:
- Conditions of sell signal - when SAR value becomes greater than the high price:
   if(SARValue > PriceArray[1].high)
   {
      signal="Sell";
   }
- Conditions of take profit signal - when SAR value becomes less than the low price:
   if(SARValue < PriceArray[1].low)
   {
      signal="Take Profit";
   }
After compiling this code, we will find it in the navigator window as an expert advisor the same as the following picture:

After dragging and dropping the file on the chart to execute the expert, the following window will open:

After pressing "OK", the expert will be attached to the chart the same as the following picture:

Then, we can find signals of this strategy appear on the chart as comments the same as the following pictures as examples from testing:
- Sell signal:

- Take profit signal:

- Strategy three: buy signal with trailing stop strategy:
In this strategy, we need to view a buy signal on the chart and trailing stops on the chart as comments as per the Parabolic SAR value and prices through specific conditions which are to see the trailing stops value on the chart and then generate any new buy signal if the SAR value becomes below the low price. We can find the following code for designing a trading system for this strategy:
//+------------------------------------------------------------------+
//|         Parabolic SAR System - Buy signal with trailing stop.mq5 |
//|                                  Copyright 2022, MetaQuotes Ltd. |
//|                                             https://www.mql5.com |
//+------------------------------------------------------------------+
#property copyright "Copyright 2022, MetaQuotes Ltd."
#property link      "https://www.mql5.com"
#property version   "1.00"
//+------------------------------------------------------------------+
void OnTick()
  {
   //create an string variable for signal
   string signal="";

   //create a price array
   MqlRates PriceArray[];

   //sort array from the current data
   ArraySetAsSeries(PriceArray,true);

   //fill array with price data
   int Data=CopyRates(_Symbol,_Period,0,3,PriceArray);

   //create a SAR array
   double SARArray[];

   //define SAR EA
   int SARDef=iSAR(_Symbol,_Period,0.02,0.2);

   //sort array from current data
   ArraySetAsSeries(SARArray,true);

   //fill SARArray with SARDef
   CopyBuffer(SARDef,0,0,3,SARArray);

   //calculate value of last data
   double SARValue=NormalizeDouble(SARArray[0],5);

   //buy signal
   //if current SAR value below candle 1 low
   if(SARValue < PriceArray[1].low)
   {
      signal="Buy";
   }

   //chart comment with the signal and trailing Stop
   Comment("The signal is ",signal,"\n", "Trailing Stop is ",SARValue);
  }
//+------------------------------------------------------------------+
- Difference is:
- Adding trailing stop value which is the SAR value in a new line as a comment on the chart:
Comment("The signal is ",signal,"\n", "Trailing Stop is ",SARValue);
After compiling this code, we can find the expert advisor file in the navigator the same as the following:

When we want to execute this expert to the chart, we will drag and drop it on the chart and then the following window will open:

After pressing "OK", the expert will be attached to chart the same as the following:

The following pictures are examples of generated signals according to this strategy from testing:

The following picture show how the trailing stop value will increase with the price:

- Strategy four: Sell signal with trailing stop strategy:
In this strategy, we need to view a sell signal on the chart and trailing stops on the chart as comments as per the Parabolic SAR value and prices through specific conditions which are to see the trailing stops value on the chart and then generate any new sell signal if the SAR value becomes above the high price. We can find the following code for designing a trading system for this strategy:
//+-----------------------------------------------------------+
//| Parabolic SAR System - Sell signal with trailing stop.mq5 |
//| Copyright Copyright 2022, MetaQuotes Ltd.                 |
//| https://www.mql5.com                                      |
//+-----------------------------------------------------------+
#property copyright "Copyright 2022, MetaQuotes Ltd."
#property link      "https://www.mql5.com"
#property version   "1.00"
//+-----------------------------------------------------------+
void OnTick()
  {
   //create an string variable for signal
   string signal="";

   //create a price array
   MqlRates PriceArray[];

   //sort array from the current data
   ArraySetAsSeries(PriceArray,true);

   //fill array with price data
   int Data=CopyRates(_Symbol,_Period,0,3,PriceArray);

   //create a SAR array
   double SARArray[];

   //define SAR EA
   int SARDef=iSAR(_Symbol,_Period,0.02,0.2);

   //sort array from current data
   ArraySetAsSeries(SARArray,true);

   //fill SARArray with SARDef
   CopyBuffer(SARDef,0,0,3,SARArray);

   //calculate value of last data
   double SARValue=NormalizeDouble(SARArray[0],5);

   //buy signal
   //if current SAR value below candle 1 low
   if(SARValue > PriceArray[1].high)
   {
      signal="Sell";
   }

   //chart comment with the signal and trailing Stop
   Comment("The signal is ",signal,"\n", "Trailing Stop is ",SARValue);
  }
//+------------------------------------------------------------------+
- Difference is:
- Conditions of sell signal:
   if(SARValue > PriceArray[1].high)
   {
      signal="Sell";
   }
After compiling the code, we can find the expert in the navigator the same as the following:

We can execute it by dragging and dropping the file on the chart after that we will find the expert window will appear:

After pressing "OK", the expert will be attached:

The following pictures are examples of generated signals:

The following shows the decrease of trailing stops with the price:

Conclusion
Now, we can say that we learned some basics of the Parabolic SAR technical indicator in detail as we learned what is the indicator and what it measures, and how we can calculate it manually to understand the concept behind it, we learned how we can use it through simple strategies, we designed a blueprint for these strategies to help us to design a trading system based on them, and we learned how to code these strategies by MQL5 to execute them on the MetaTrader 5 to generate signals automatically and accurately.
I hope that you tried to code these strategies by yourself as this will enhance your learning curve because practice is a very important factor to master anything and you can test that when you learn anything as you can find that your awareness will be increased when you practice or apply what you learned more than you did not practice.
I hope also that you found this article useful, it gave you powerful and useful insights to enhance your trading, and it opened your eyes to new ideas about the topic of the article or about any related topic. I need to confirm also that you must test any new tool or strategy during a reasonable period before using it on your real account to make sure that it will enhance your trading results.
Warning: All rights to these materials are reserved by MetaQuotes Ltd. Copying or reprinting of these materials in whole or in part is prohibited.
This article was written by a user of the site and reflects their personal views. MetaQuotes Ltd is not responsible for the accuracy of the information presented, nor for any consequences resulting from the use of the solutions, strategies or recommendations described.

 Data Science and Machine Learning (Part 03): Matrix Regressions
 Multiple indicators on one chart (Part 05): Turning MetaTrader 5 into a RAD system (I)
 Multiple indicators on one chart (Part 06): Turning MetaTrader 5 into a RAD system (II)
- Free trading apps
- Over 8,000 signals for copying
- Economic news for exploring financial markets
You agree to website policy and terms of use
New article Learn how to design a trading system by Parabolic SAR has been published:
Author: Mohamed Abdelmaaboud
Hello, thank you for this amazing portrait. After hitting the stop loss in up and down trend strategies will the order be closed automatically? Like in loop ?
In these examples, I did not find the code to automatically open or close orders. Even the moment of triggering the trailing stop. Just comments on the chart. You should add it yourself.
New article Learn how to design a trading system by Parabolic SAR has been published:
Author: Mohamed Abdelmaaboud
Hello, Mohamed Abdelmaaboud, I appreciated the article here. However, the article did NOT address the point: "How to calculate the parabolic SAR manually?" . The article does NOT show how the initial values: 52 and 51 of the SAR was calculated manually?
Hello, Mohamed Abdelmaaboud, I appreciated the article here. However, the article did NOT address the point: "How to calculate the parabolic SAR manually?" . The article does NOT show how the initial values: 52 and 51 of the SAR was calculated manually?
Hello Sibusiso,
Thanks for your comment. If you read the full article, you can read the manual calculation in the topic of Parabolic SAR definition.
Hi Mohamed,
thanks for this article, a bit too much for a newbie like me 😉. I would appreciatee if you could write me the code to plot the indicator on the chart, since the EA doesn't do that.
Thanks a lot. Best
G.