
Developing a cross-platform grider EA (part III): Correction-based grid with martingale
Introduction
We have already developed two different grider EAs in the previous articles of the series (Developing a cross-platform grider EA and Developing a cross-platform grider EA (part II): Range-based grid in trend direction).
The first EA was good enough, except that it could not make a profit over a long period of time. The second EA could work at intervals of more than
several years. Unfortunately, it was unable to yield more than 50% of profit per year with a maximum drawdown of less than 50%. Besides, we
were not able to control the maximum drawdown itself. In this regard, everything depended on the market. So, does this mean grider EAs are
unable to make profit safely? Let's try to answer this question in this article.
Setting tasks
In this article, we will develop the next (and possibly the last) version of a grider EA. It will follow the martingale strategy setting a grid only if the price moves in an unfavorable direction. The volume of orders in the grid will constantly increase. Thus, as soon as the price reverses or a correction occurs, all orders in a grid will be closed with an overall profit.
Separate orders placed by the EA will not feature stop levels. A take profit will be activated when the overall profit for all currently open positions exceeds the value set in the EA parameters.
In fact, this is not a grider in the full meaning of the word since no grids are formally set. Instead, it may be called a common martingale. On
the other hand, we open each position at the same distance from the previous one if the price goes against us, which clearly means forming a
grid. Actually, there is no point in tinkering with the terms. Our main objective is to make the EA more profitable than the other grid EAs we
developed before. This is what we are going to check out.
Risk management
Like all grids, martingale has one main issue — it is impossible to manage risks when using it. This may cause losing the entire deposit in no time. Using both the grid and the martingale seemingly makes for a perfect explosive mix. So what kind of risk management can we talk about in that case? Can we develop a "safe" EA at all?
It turns out we can! We can manage our risks in at least two ways. First, we can close the entire grid with a loss when equity by balance is decreased by a certain amount. Second, we can close the entire grid with a loss if it reaches the N th step. In both cases, we acknowledge that something is going wrong and just start trading anew hoping that future profits will cover the current loss. Only tests can show us whether our hopes are justified.
The option involving decreasing equity has one drawback — we cannot trade several symbols simultaneously on a single account. Since the
account equity shows the overall picture, it remains unclear what loss we have at each specific symbol. Therefore, we will use the second
option to manage risks.
Entering the first deal
One question still remains. How to define the first deal's direction? You might ask, why only the first deal matters here. The reason is the remaining positions are to be opened in the same direction as the first one and only if the price moves against us for a number of points specified in the EA settings.
Of course, we can simply toss a coin. But in that case, the test results will be different each time. Besides, we can always enter in one direction only. But this does not look like an intelligent solution. Therefore, let's try to add at least some intelligence to our EA and test several ways to determine the first entry direction:
- entering in the previous bar's direction;
- entering according to a Moving Average;
- entering against the direction of N unidirectional bars;
- entering following the direction of N unidirectional bars.
EA inputs
We have already developed two grider EAs. Therefore, there is no point in describing in details the development of another one. Instead,
let's have a look at the inputs our new EA is going to have. The EA's source code is attached to the article.
Lot size. Lot size at the grid's first step. The lot size at the subsequent steps depends on the "Increasing a lot in a chain" parameter.
Increasing a lot in a chain. This parameter allows selecting the lot size at the subsequent grid steps. The following values are available:
- Fixed: the lot size is fixed at all grid steps and equal to the volume specified in the "Lot size"
parameter;
- Arifmet: with each new step, the lot volume is increased by the "Lot size" parameter, for example: 1,
2, 3, 4, 5, 6, 7;
- Geomet: with each new step (starting from the third one), the lot volume is doubled, for example: 1, 1, 2, 4, 8, 16.
According to the tests, using a fixed volume is the worst option. The exponential increase of a lot in a chain (Geomet) shows the best results on Forex. For most stock market instruments, the exponential increase of a lot is also a better option, although there are exceptions when the arithmetic progression is preferable. Therefore, all tests below are to be conducted with the parameter set to Geomet unless explicitly stated otherwise.
Grid size in points. The distance between open positions in a grid. For example, if the parameter is set to 30 and the current price decreases by 30 points from the first Long order, the second order in the grid is opened. If the price is decreased by 30 points relative to the second grid order, the third order is opened, etc.
Do not open Long and Do not open Short. The parameters disable opening Long/Short positions.
Since the majority of stock market instruments are bullish on the long run, using these parameters may increase profitability. If you see that a stock has been bullish most of the time, then it is reasonable to trade it only in the direction of the global trend.
'Closing all positions' group. The group's parameters allow you to configure take profit and stop loss levels for all positions in a chain.
Closing a position by take profit is managed by the parameters "Profit, $", "Profit at step 1, $", " Profit at step 2, $", ..., "Change take profit level after a step". Only the "Profit, $" parameter is obligatory. Other parameters allow changing the " Profit, $" parameter at a certain chain step, for example, to increase the chances of closing the entire chain in profit at further steps.
A stop loss is managed by the "If equity decreased, $" and "Close all at trade number" parameters. I have
already described them above.
'Use entry by bar only' group. The parameter allows opening the first position in the direction of the previous bar. To do this, simply assign TRUE to the " Use entry by bar only" parameter.
'Bar series' group. These are the settings of opening the first position either following the direction of unidirectional bar series or moving against it. To enable the check, set the number of bars that should move in one direction in the " Enter if N bars in one direction" parameter.
MA group. The parameter allows you to configure entering the first position by moving average. To use this entry option, set the
moving average period different from 0 in the
"Period" parameter.
Test rules and list of instruments
In theory, our EA should work in both range and trend markets. Therefore, we will test it both in Forex and US stock market. Generally, the EA can trade efficiently in almost all instruments. This is especially true of the stock market, in which only 1-2 instruments do not bring profit under any settings. Therefore, we will perform tests only on the instruments the EA has shown its best on. However, this does not mean it showed itself poorly on other instruments.
Tested instruments. The tests will be conducted on the following instruments: USDCAD, NZDUSD, SBUX, XOM, INTC, CMCSA and PG.
Period. In all the tests, the EA will work on M5. Once again, the test has shown that this is the most suitable period for grider EAs.
Test rules. On USDCAD and NZDUSD, the test is to be performed from 2010 to 2019. The search for suitable parameters is performed in the "1 minute OHLC" mode. The best result found is additionally tested in the "Every tick based on real ticks" mode.
Stock market instruments will be tested on the period 2013-2019. The broker the tests are performed on simply has no more data, while both
optimization and the final test of the best result detected are to be performed in the
"Every tick based on real ticks" mode.
Selection of the best result is performed by the "Balance" and "Max recovery factor" parameters.
Testing entry by the previous bar
We have explored following the previous bar direction in the previous article of the series. It increased the EA profitability when using D1
and sometimes MN bars. We will test both following D1 bar, as well as W1 and MN timeframes.
Entering in the direction of a previous bar allows trading in the direction of the current local trend. Therefore, let's start from testing this particular entry method. If the EA has no open deals at the moment, the first one is to be Long if the previous bar on the selected timeframe is bullish. If the bar is bearish, the first deal opened is to be Short.
The best test results are provided in the table below.
| Symbol |
Recovery factor |
% per year |
Maximum drawdown |
Profit factor | Total trades |
Trades per year |
Maximum step |
Stop losses |
|---|---|---|---|---|---|---|---|---|
| USDCAD |
8.12 | 90% |
948.76 | 1.68 | 3 577 | 397 | 8 | 2017.02 |
| NZDUSD |
8.03 | 89% |
1 404 | 1.91 | 2 850 | 316 | 9 | - |
| SBUX * ** |
5.31 | 88% | 93.17 | 2.36 | 386 | 64 | 9 | 2013.05, 2014.11, 2016.02, 2016.11, 2019.05 |
| XOM |
5.94 | 99% | 180.78 | 2.52 | 506 | 84 | 8 | 2013.08 |
| INTC * |
6.7 | 111% |
88.13 | 3.02 | 289 | 48 | 8 | - |
| CMCSA ** | 7.74 | 129% |
34.02 | 3.7 | 281 | 46 | 8 | - |
| PG ** | 6.42 | 107% |
102.85 | 2.2 | 767 | 127 | 9 | 2013.01, 2013.09, 2014.11, 2018.04 |
* timeframe of 1 month.
** arithmetic increase of a lot in a chain.
The contents of all columns is self-explanatory. However, it should be noted that:
- the "Stop losses" column specifies dates when a stop loss was activated for all open positions; in other words, we reached the maximum step set in the EA parameters;
- the "% per year" sets the EA profitability percentage per year at the maximum possible slippage (i.e. (recovery
factor/test period)*100).
The "Recovery factor" column is of most interest for us. The column value shows the ratio of a profit obtained by the EA to the maximum drawdown, i.e. recovery factor = profit/maximum drawdown. Thus, the greater the value, the more profitable the EA becomes on a tested instrument. The test period should also be considered for the correct comparison.
The test period for Forex comprises 9 years, while for a stock market it is 6 years. Thus, for example, the recovery factor of 9 for Forex is equal
to 100% of profit per year, while for stock market instruments, it is equal to 150% of profit per year.
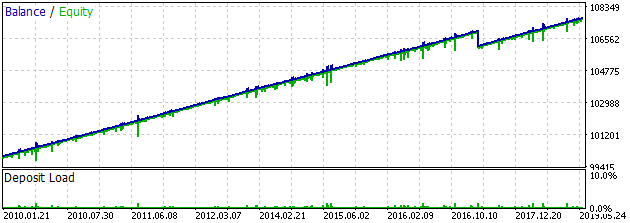
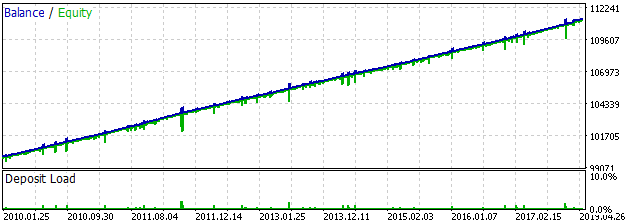
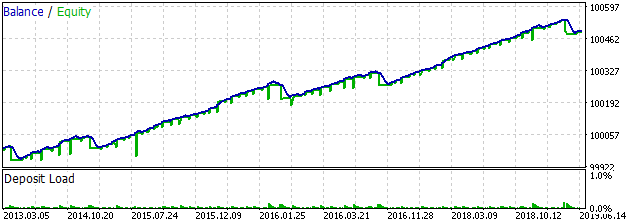
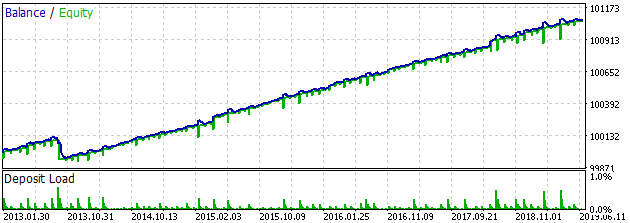
The balance graphs are provided below.
USDCAD:
NZDUSD:
SBUX:
XOM:
INTC:
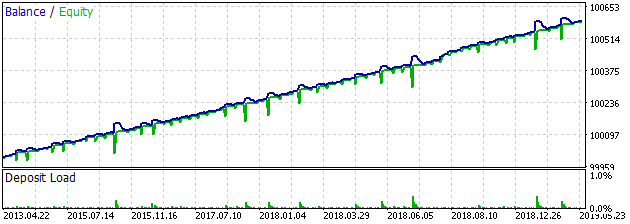
CMCSA:
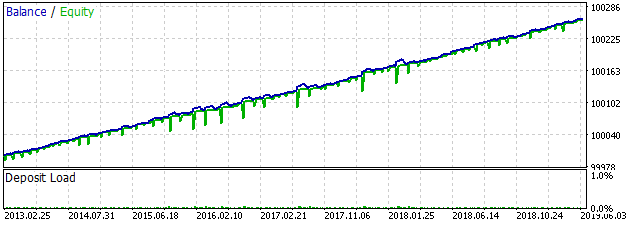
PG:
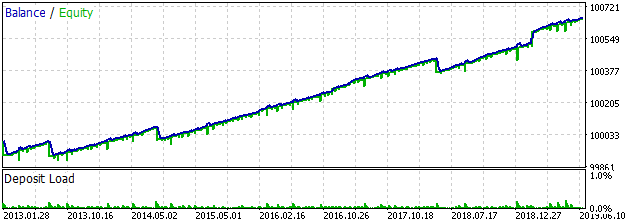
The strategy tester reports are attached to the article.
Testing entry using moving average (MA)
The moving average is probably the very first type of indicator invented by traders to facilitate understanding of the market. Over the years, its relevance remains unscathed.
Initially, moving averages were used only on D1 bars. According to the tests, moving averages on D1 bars are most suitable for our EA. Therefore, we
will optimize only the MA period (in the range from 30 to 54) rather than the timeframe.
The MAs will be used in the simplest interpretation. If no deal is opened by the EA yet, a Long deal is opened in case the current price is located above the MA. If the current price is below the MA, a Short deal is opened.
The best results are as follows:
| Symbol |
Recovery factor |
% per year |
Maximum drawdown |
Profit factor | Total trades |
Trades per year |
Maximum step | Stop losses |
|---|---|---|---|---|---|---|---|---|
| USDCAD |
7.18 | 79% |
939.88 | 1.72 | 1 861 | 206 |
8 | - |
| NZDUSD |
6.51 | 72% |
1 672.77 | 1.74 | 3 232 | 359 | 9 | - |
| SBUX |
6.95 | 115% |
159.67 | 2.62 | 536 | 89 | 9 | - |
| XOM * |
5.64 | 94% |
179.15 | 2.2 | 513 | 85 | 9 | - |
| INTC |
5.13 | 85% |
149.67 | 2.34 | 525 | 88 | 9 | 2015.06 |
| CMCSA * | 12.26 | 204% |
33.39 | 11.35 | 218 | 36 | 9 | - |
| PG ** | 7.37 | 122% |
85.86 | 2.27 | 846 | 141 | 8 | 2014.09, 2014.11, 2015.08, 2016.12 |
* only Long deals.
** arithmetic increase of a lot in a chain.
Generally, stock market results are slightly better than when following the previous bar. In case of Forex, the first option is more preferable.
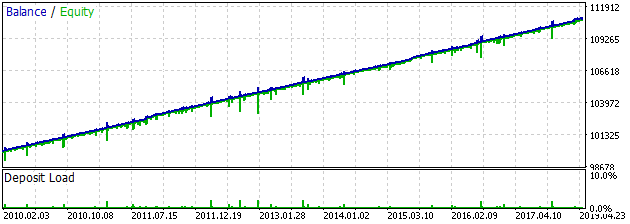
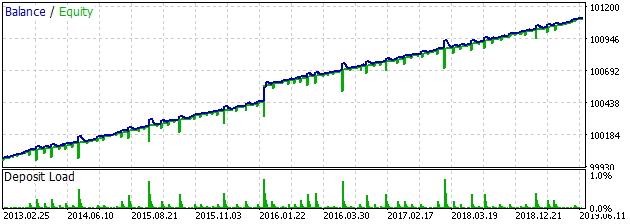
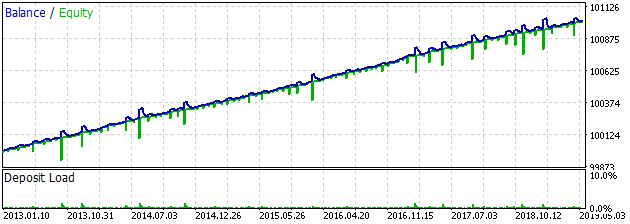
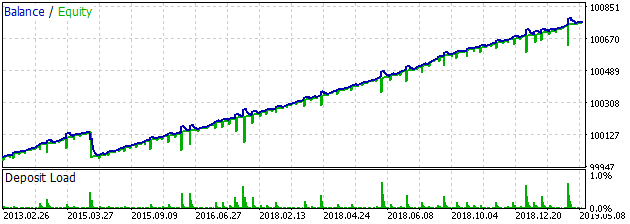
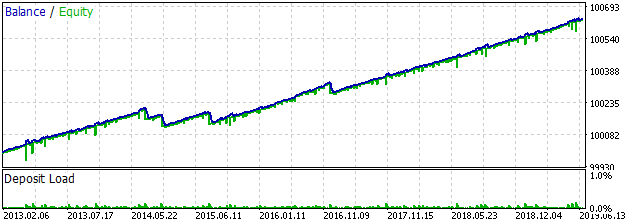
Now let's have a look at the balance graphs. If, according to the tests, there was not a single stop loss, the graphs look as ordinary lines
inclined upwards.
USDCAD:
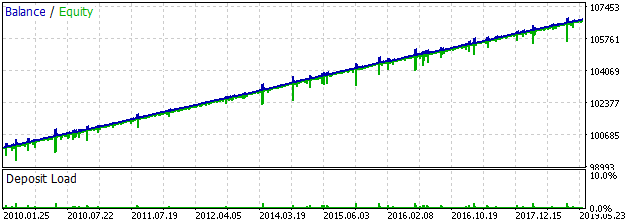
NZDUSD:
SBUX:
XOM:
INTC:
CMCSA:
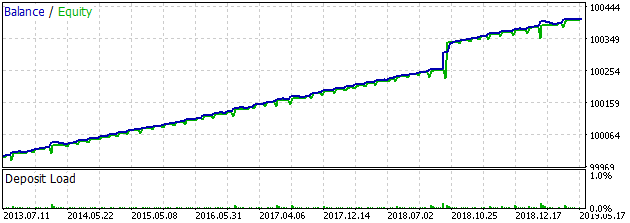
PG:
Testing entry against N bars in one direction
I found out about this entry method during one of the workshop sessions. According to the speaker, this method increases your chance to get profit because the likelihood of a correction increases after prolonged unidirectional movements. In theory, this sounds reasonable.
So if the price moved five bars in one direction, it is time to enter against the price assuming that a correction is on its way.
Let's test this entry method as well. We will optimize both the timeframe for bars (selecting among M5, M15, H1, H4 and D1), and the number of unidirectional bars (3-7).
The best results are as follows:
| Symbol |
Recovery factor |
% per year |
Maximum drawdown |
Profit factor | Total trades |
Trades per year |
Maximum step | Stop losses | Timeframe |
|---|---|---|---|---|---|---|---|---|---|
| USDCAD |
7.75 | 86% | 575.26 | 2.09 | 1 123 | 124 | 8 | - | H4 |
| NZDUSD |
6.13 | 68% | 1 184.53 | 1.83 | 3 224 | 358 | 9 | - | H1 |
| SBUX |
5.67 | 94% | 127.49 | 4.93 | 202 | 33 | 8 | - | M15 |
| XOM |
8.07 | 134% | 143.81 | 2.06 | 963 | 160 | 8 | 2013.08, 2015.01, 2015.08 | M15 |
| INTC |
7.53 | 125% | 56.08 | 2.03 | 521 | 86 | 6 | 13 stop losses | M15 |
| CMCSA | 10.04 | 167% | 28.4 | 16.1 | 97 | 16 | 6 | - | M15 |
| PG | 7.98 | 133% | 137.02 | 3.34 | 446 | 74 | 8 | - | M15 |
Generally, at some points, the results are better compared to the previously described methods. At some points, they are worse.
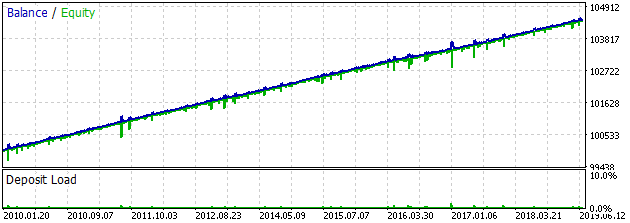
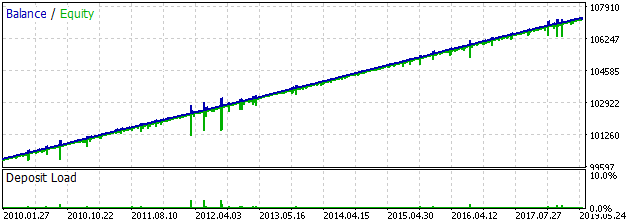
Let's have a look at the profit balance.
USDCAD:
NZDUSD:
SBUX:
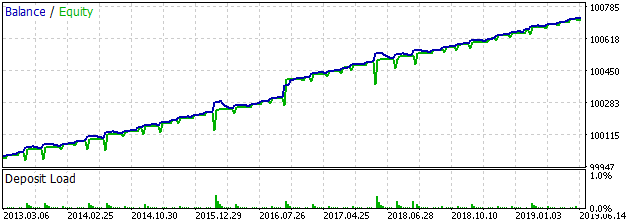
XOM:
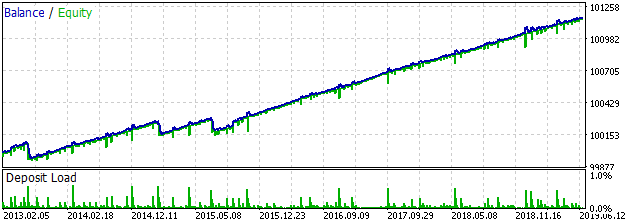
INTC:
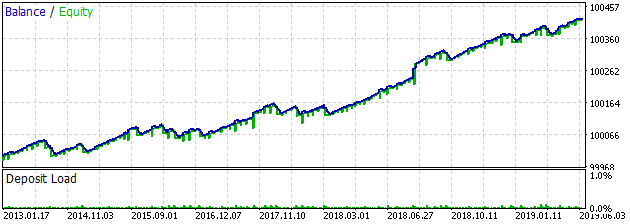
CMCSA:
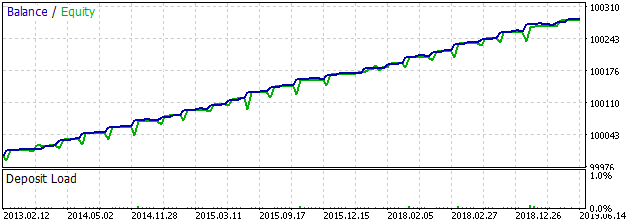
PG:
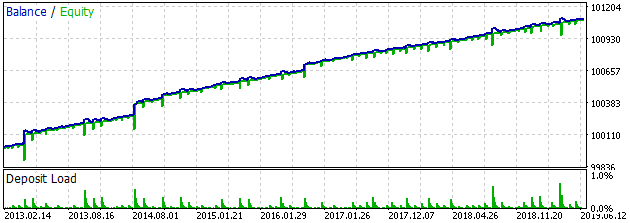
Testing entry following N bars in one direction
Since we tested entering against N bars in one direction, let's test an entry that follows N bars in one direction. Sunc entry method may also seem reasonable. For example, if the price moves in one direction non-stop, this means the start of a trend. So, why not enter in the direction of this movement?
This entry method is similar to the very first one we examined — following the previous bar. However, in this case, we make sure that at least
three bars go in the same direction, while the timeframe of these bars is less than D1. The test is to be performed for M15, H1, H4 and D1 bars. The
number of bars in one direction varies from 3 to 7. The best results are as follows:
| Symbol |
Recovery factor |
% per year |
Maximum drawdown |
Profit factor | Total trades |
Trades per year |
Maximum step | Stop losses | Timeframe |
|---|---|---|---|---|---|---|---|---|---|
| USDCAD |
7.39 | 82% |
63.77 | 4.25 | 120 | 13 | 7 | - | D1 |
| NZDUSD |
4.86 | 54% |
546.01 | 1.66 | 1 504 | 167 | 7 | - | D1 |
| SBUX ** |
7.39 | 123% | 82.26 | 3.35 | 312 | 52 | 9 | 2014.01, 2014.10, 2017.03 | M15 |
| XOM |
12.52 | 208% | 114.98 | 2.92 | 723 | 120 | 8 | 2013.10 | H4 |
| INTC |
9.34 | 155% | 72.56 | 3.62 | 283 | 47 | 8 | - | M15 |
| CMCSA | 8.68 | 144% | 32.41 | 4.35 | 289 | 48 | 8 | - | M15 |
| PG | 10.28 | 171% | 152.61 | 2.21 | 1 444 | 240 | 9 | 2013.04, 2016.03, 2019.01 | M15 |
** arithmetic increase of a lot in a chain.
Stock market results are quite interesting. This is not the case with Forex though.
USDCAD:
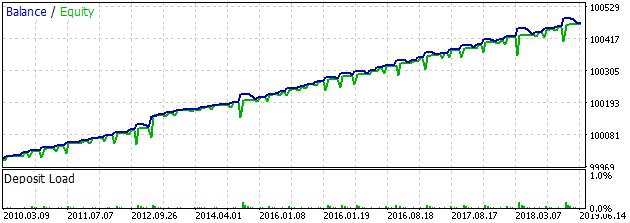
NZDUSD:
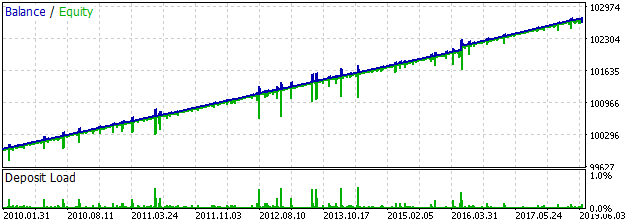
SBUX:
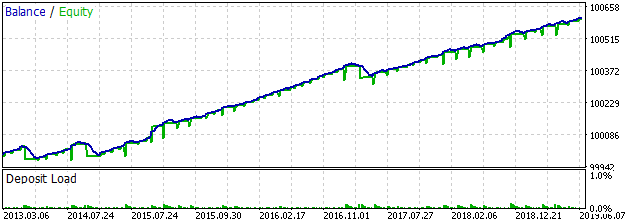
XOM:
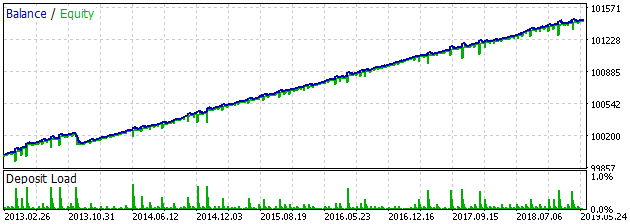
INTC:
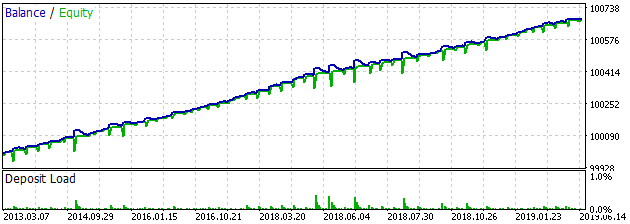
CMCSA:
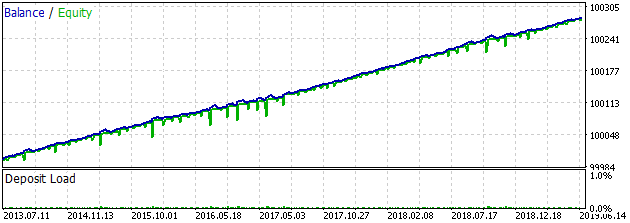
PG:
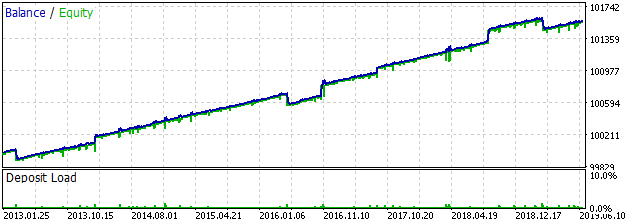
Testing entry with no conditions
We have already tested the four methods of opening the first position. However, we are free not to use any of them. Let's test opening the first position with no conditions. In other words, if the EA currently has no open positions, it immediately opens a position in the direction selected in the settings. If opening Long positions is not disabled, the EA will always open Long positions. If opening Long positions is disabled, the EA will always open Short positions.
Let's have a look at the test results:
| Symbol |
Recovery factor |
% per year |
Maximum drawdown |
Profit factor | Total trades |
Trades per year |
Maximum step | Stop losses |
|---|---|---|---|---|---|---|---|---|
| USDCAD |
7.92 | 88% |
1 236 | 1.98 | 2 484 | 276 | 9 | - |
| NZDUSD |
7.54 | 83% |
1 101 | 1.63 | 2 843 | 315 | 8 | 2011.10, 2013.04, 2013.10 |
| SBUX * |
8.49 | 141% |
122.29 | 3.15 | 413 | 68 | 8 | 2016.01, 2018.06 |
| XOM |
7.09 | 118% |
232.14 | 2.61 | 789 | 131 | 9 | - |
| INTC * |
5.08 | 84% |
81.65 | 2.07 | 481 | 80 | 7 | 2019.05 |
| CMCSA ** * | 8.85 | 147% | 48.59 | 2.9 | 611 | 101 | 9 | 2015.08, 2018.03 |
| PG | 5.9 | 98% | 118.29 | 1.87 | 514 | 85 | 7 | 2013.01, 2013.11, 2014.12, 2015.10, 2016.01, 2019.03 |
** arithmetic increase of a lot in a chain.
Even without any entry conditions, the martingale is able to yield profit if the EA follows the global trend. For almost all stock market
instruments, this is, of course, Long. However, if you use any of the methods for defining the first position, the results may be better.
Summing up the test results
According to the tests, following the previous D1 bar is the best option for Forex, while on a stock market, this option is the worst. In this case, it is
worth paying attention to other options. A specific entry method may be best suited for certain instruments, while working much worse for
some others. Only the tests will help you find the best strategy for a specific instrument.
Also, the tests showed that limiting the maximum number of steps in the grid allows us to actually gain an advantage on the market while keeping risks under control and avoiding the loss of an entire deposit, unless you use the first deal volume, in which case the maximum drawdown exceeds your deposit according to the tests. The grid should be large enough to withstand medium-term corrections. As can be seen from the tables, the number of transactions rarely exceeds 100 per year in the stock market.
As for the option to increase a lot, only geometric progression works in the Forex market, while both geometric and arithmetic progressions
may work on the stock market.
Another conclusion drawn from the tests is that during a long-term trading, there is no point in expecting more than 100% of profit per year for
Forex and more than 150% of profit per year for the stock market, especially if you do not want to risk more than 90% of your deposit to do that. If
you need a maximum drawdown of no more than 20% of the deposit, then the expected profit is unlikely to exceed 20-25% per year.
Real-time test
Two trading signals were created to test the EA operation.
The first one was a demo account signal. It trades the following instruments: USDCAD, SBUX, CMCSA, GM, KO, MCD, MSFT, ORCL and HPE. The applied volumes are minimal, which means the signal can be used only to define the general nature of movements by the EA's balance and profitability. It cannot display what percentage of profit can be obtained considering funds placed on a deposit.
The second signal was launched on a real account recently. At the time of
writing, it trades only stock market instruments: SBUX, MCD, KO, MSFT, NKE, ORCL, ADBE, CMCSA, LLY and HPE.
The EA trading on both accounts is a modified version of the one described in the article. It uses an entry method that is different from the ones I described here. It will be considered in the article series later.
There is also the third signal. This is an old signal that was previously
used to trade using reversing (
the last article of the series). Then it was used by the grider EA from the previous
part of the series. Currently, it is used by this EA using the previous bar-following entry method on USDCAD and NZDUSD. However, USDCHF
deals from the previous EA remain on the signal. They will eventually be closed over time and only deals of the current EA will remain.
Conclusion
The EA we have developed has two significant drawbacks:
- First, long take profits show themselves best in the tests. So, if we manage to guess the deal direction right at the very start, we have to wait a very long time until the price reaches our take profit. In some cases, it can take more than one month to reach that take profit. The thing is that a position with a minimum volume is used at the first step of the chain. No additional positions are opened if the price moves favorably right away.
- We have already mentioned the second drawback: a small profitability when adhering to the rule of maximum drawdown of no more than 20% of the deposit.
We will try to overcome these shortcomings in the following parts of the series.
Translated from Russian by MetaQuotes Ltd.
Original article: https://www.mql5.com/ru/articles/7013
Warning: All rights to these materials are reserved by MetaQuotes Ltd. Copying or reprinting of these materials in whole or in part is prohibited.
This article was written by a user of the site and reflects their personal views. MetaQuotes Ltd is not responsible for the accuracy of the information presented, nor for any consequences resulting from the use of the solutions, strategies or recommendations described.
- Free trading apps
- Over 8,000 signals for copying
- Economic news for exploring financial markets
You agree to website policy and terms of use
The code is really neat for a cross-platform, with time-series and all, BUT, I am trying to dig which Ask/Bid price my MT4 tester (build 1260) gets for this code to open trades. Each attempt of OrderSend ends with error 138 (New Prices), as if the MqlTick structure produces a wrong Ask/Bid for the tick?? or is it pulling the data from alt. timeframes? - I ran it at all the same timeframes as the operational tf, and it's still the same.
Does anybody here who tried the EA, experience similar problem and what may be the reason for error 138 in the tester?
Also, as the problem above, filling an order at market price (as could be the only option for a broker/instrument) doesn't seem an option in this EA, at least for MQL4 compillation:
(but I shouldn't show my arrogance by asking if such a choise is required for MT5 platform... ;-)
Also, not being a programmer myself, I came across a sample of code where it is postulated that ..'Running on every incoming tick is mandatory for strategy tester, but real-time processing is best onTimer event - standard 200 ms.' How does this may affect the EA performance, particularly a multi-timeframe like this one?
Thank you forany comment on the above.
This topic is about MQL5, you don't seem to know what platform you are using.
Anything concerning MT4 should be posted in the MT4 section.
It is also possible to take out these returns directly in the Tester, making an ordinary TS in one line.
Bottom line.
As a result, I can't understand where I am wrong in my conclusion. All refilling TSs are a kind of self-deception - profit reduction. I am not talking about the drain in the form of a poker, but about profit reduction. After all, it is possible to pull out a more profitable TS from any refilling TS. It seems that everything is logically correct in this conclusion. But I can't understand why I am not sure, since I had such an experiment.
I don't see the same conclusion. Input number two has no memory, as well as the following ones, which means its MO is the same as any other input in this TC, i.e. zero. It is like waiting for the fifth black after the fourth red, only because the probability of 5 reds in a row is negligible. In reality, we have the same 50/50, which means that trading with martin or such a grid requires infinite capital to get a guaranteed fixed return.
I don't see the same conclusion. Input number two has no memory, as well as the following ones, and therefore its MO is the same as any other input in this TS, i.e. equal to zero. It is like waiting for the fifth black after the fourth red, only because the probability of 5 reds in a row is negligible. In reality, we have the same 50/50, which means that trading with martin or such a grid requires infinite capital to get a guaranteed fixed return.
I guess you misinterpreted my words.