Discussion of article "Developing a cross-platform grider EA (part III): Correction-based grid with martingale"
The article is basically nothing ....
Talking is not talking :-)))))
Dmitiry Ananiev:
And what, even such articles are paid? I can write 2-3 articles like this a day.
The article is basically nothing....
You write at least one article, even if it is "worthless", then make such loud statements ;-)
OK. Question for the administration. Will I be paid for such an article. A rough outline of the article.
I take any expert such as this one from kodobaza - https://www.mql5.com/en/code/26013.
I test by prices. Then I input prices by MA. and let's say the prices given by Parabolic.
I do tests on different TFs and 5 instruments.
I put the data in the table and pour water that the robot is not bad in principle, but drains the bastard...
But in the next article we will screw to it stoploss and trailing stop classic and based on indicators.
I understand the price is 200 quid! Yes, it will be almost the easiest money!

- www.mql5.com
OK. Question for the administration. Will I be paid for such an article. A rough outline of the article.
I take any expert like this for example from kodobaza - https://www.mql5.com/en/code/26013.
I test by prices. Then I input prices by MA. and let's say the prices given by Parabolic.
I do tests on different TFs and 5 instruments.
I put the data in the table and pour water that the robot is not bad in principle, but it drains the bastard...
But in the next article we will screw to it stoploss and trailing stop classic and based on indicators.
I understand the price is 200 quid! Yes, it will be almost the easiest money!

- 2010.02.19
- www.mql5.com
Thanks to the author, I was interested in digging into the topic.
I don't understand the reasoning about annual profitability. For me, the annual profitability is as follows
- We ran the Expert Advisor for 10 years.
- We divided the first 9 years into 1000 intervals of equal length. The beginning of each interval TimeBegin[i].
- TimeEnd[i] = TimeBegin[i] + year.
- At each interval (TimeBegin[i]; TimeEnd[i]) looked at profit (Profit[i]) and drawdown (DD[i]).
- The minimum Profit value out of these 1000 pieces is the profitability of the TS.
- The recovery factor is the minimum value of Profit[i]/DDD[i].
USDCAD_ALWAYS.html report contains only BUY positions.
Please attach the sets, because as it turns out, the tester reports are abysmal for understanding the input parameters.
@Rashid Umarov, I suggest watching any report from the article to fully understand this reporting issue.
Literally ran right into one of these G's.
There are two thoughts on the topic that I would like to see thoughtful responses to.
The first thought.
Such a MM can be attached to any TS. And MQL allows you to do it in such a way that you take any TS, insert one line into it, and it starts to have this MM. For example, let's take a common example on MAs from the delivery. We wrote a line in the source, after which the МАшка began to refill in case of failures. That is, it is simply logical to write such a bible.
The second thought.
Let's imagine that each refill has its own MA. Entry - 0. The first refill - 1. The second refill is 2. And so on. Then for each majic we can plot the returns. Obviously, it will turn out that 0-return will be negative. 1-yield will be better. And as the number increases, the yield will increase. Then a reasonable question arises, why do we have unprofitable returns in the TS? They can simply be thrown away. Obviously, the higher the Magic is, the better the yields are, but the number of trades drops.
It is also possible to take out these returns directly in the Tester, making a regular TS in one line.
Bottom line.
As a result, I can't understand where I am wrong in my conclusion. All refilling TSs are a kind of self-deception - profit reduction. I am not talking about the drain in the form of a poker, but about profit reduction. After all, it is possible to pull out a more profitable TS from any refilling TS. It seems that everything is logically correct in this conclusion. But I can't understand why I'm not sure, as there was such an experiment.
Experiment.
I took a good channel scalper - we trade from the channel boundaries inwards. I.e. 99% of the TS is an algorithm of channel building.
I applied something like what is described in "First Thought" to him. Roughly speaking, I allowed opening a second position if the price went out of the channel for some distance. It is clear that the profit increased purely for mathematical reasons. But the deposit load was also increasing. That is why it was logical to look at the changes in the recovery factor. And it was improving.
I.e. what was happening. I could classically trade the channel for 1 lot and get Profit1. I could classically trade a 1 lot channel, but the channel would be expanded, and get Profit2. Or I could combine these TSs by making a dolivka, as I wrote above. At the same time, the main entry would be 0.5 lot and the replenishment would be the same amount. I would get Profit3. Obviously, Profit3 = (Profit1+Profit2)/2. But only with drawdown was there a significant improvement.
In fact, I come to the conclusion that if there are two profitable equities, then combining them (with weights whose sum is one) gives a more attractive equity. Actually, gridder is a combination of several TS with the same coefficients, martin - with different ones. And the stupidity of these approaches consists only in the fact that in the portfolio of such combinations plum (first values of majics) summands are allowed. I.e. grider/martin is a special case of combining a portfolio of TSs with stupidity enabled (there are unprofitable ones in the portfolio).
There are two thoughts on the topic that I would like to see thoughtful responses to.
...In fact, I come to the conclusion that if there are two profitable equities, then their combination (with weighting coefficients, the sum of which is one) gives a more attractive equity. Actually, gridder is a combination of several TS with the same coefficients, martin - with different ones. And the stupidity of these approaches consists only in the fact that in the portfolio of such combinations plum (first values of majics) summands are allowed. I.e. grider/martin is a special case of combining a portfolio of TS with stupidity enabled (there are unprofitable ones in the portfolio).
Well, here is the ready Plan of the article )
It remains to implement in code, run the signals for a couple of months and write the article.
- Free trading apps
- Over 8,000 signals for copying
- Economic news for exploring financial markets
You agree to website policy and terms of use
New article Developing a cross-platform grider EA (part III): Correction-based grid with martingale has been published:
In this article, we will make an attempt to develop the best possible grid-based EA. As usual, this will be a cross-platform EA capable of working both with MetaTrader 4 and MetaTrader 5. The first EA was good enough, except that it could not make a profit over a long period of time. The second EA could work at intervals of more than several years. Unfortunately, it was unable to yield more than 50% of profit per year with a maximum drawdown of less than 50%.
The "Recovery factor" column is of most interest for us. The column value shows the ratio of a profit obtained by the EA to the maximum drawdown, i.e. recovery factor = profit/maximum drawdown. Thus, the greater the value, the more profitable the EA becomes on a tested instrument. The test period should also be considered for the correct comparison.
The test period for Forex comprises 9 years, while for a stock market it is 6 years. Thus, for example, the recovery factor of 9 for Forex is equal to 100% of profit per year, while for stock market instruments, it is equal to 150% of profit per year.
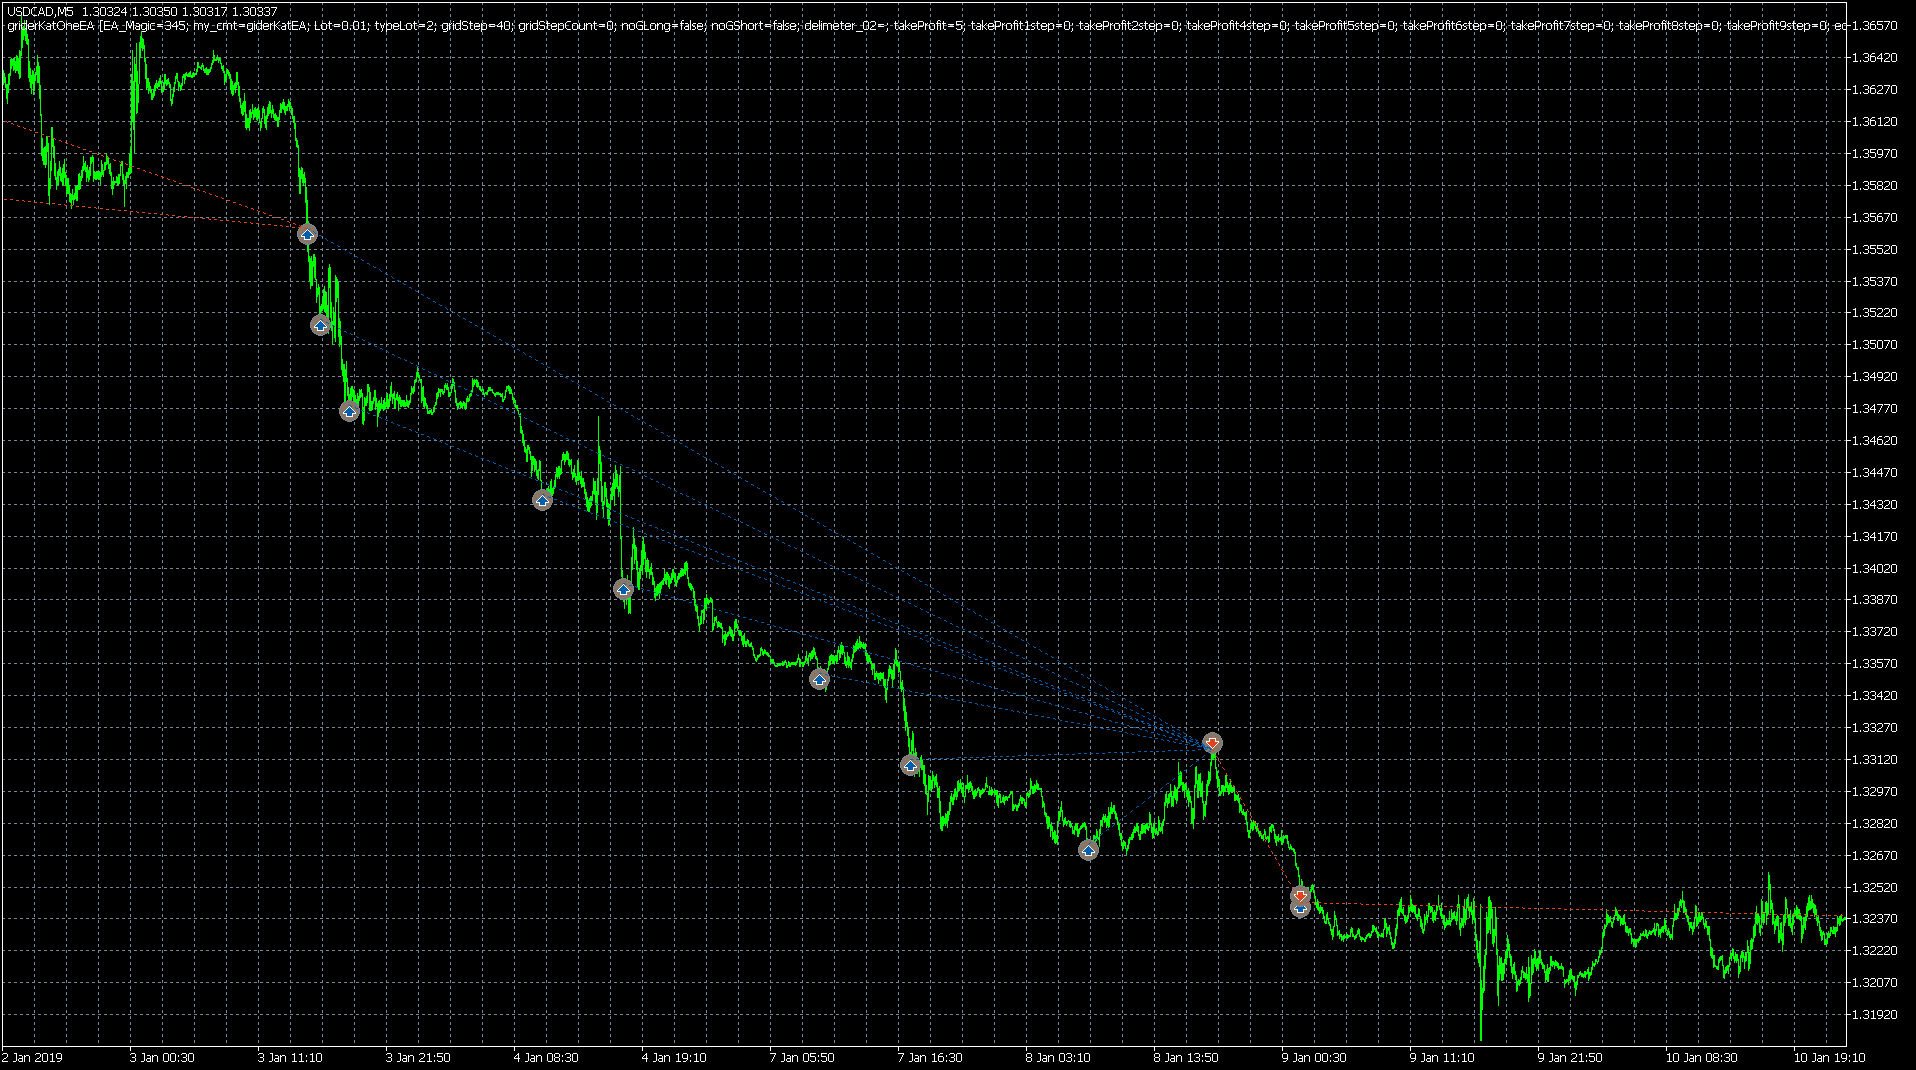
The balance graphs are provided below.
USDCAD:
NZDUSD:
Author: Roman Klymenko