

From Evidence to Execution (Part 1): How to Log, Measure, and Decode a Trading Strategy Inside MetaTrader 5 AI
 254
 0

Table of contents
- Introduction
- System Overview
- Getting Started
- Enumerations and inputs
- The data structures
- Resolving the time window
- Freezing the range
- Opening an event
- Tracking an event
- The per-bar orchestration
- Writing the evidence
- Running the Logger
- Decoding the Evidence with the MT5 AI Assistant
- Phase 1: Understanding the Dataset
- Phase 2: Validate the Data
- Phase 3: Establish the Baseline
- Phase 4-6: Winners versus failed breakouts
- Phase 7: Investigate Useful Thresholds
- Phase 8: UP vs DOWN Breakouts
- Phase 9: Time and Session Behavior
- Conclusion
- Appendix: The Nine Prompts
Introduction
Most Expert Advisors become distorted versions of their original strategies. We start with clear rules, then add filters after a loss, narrow the time window after a weak session, and add confirmation candles for perceived safety. By the time the code compiles, it is a pile of patches wrapped around a memory of an idea. We drift not because we are careless, but because we never knew how our own strategy behaved. We knew the rules; we did not know the mechanics—whether wide ranges break better than narrow ones, whether breakout volume matters, whether a retest is a healthy sign or a warning. Without that knowledge, every development decision is a guess.
Instead of coding the Expert Advisor first, build an instrument that observes the market and records what the strategy would have seen. It does not trade or make decisions. It follows our initial rules, captures every component of the strategy as a measurable number, and writes the result to a file. We then hand that file to the MT5 AI Assistant and work through structured questions about what actually happened: what separates a genuine breakout from a false one, what the winners have in common, and when we should be doing nothing at all. By the time we open MetaEditor to write the real Expert Advisor, we are encoding evidence rather than guessing.
System Overview
The strategy we are instrumenting is the Range Breakout, chosen because it is simple and widely used. In Session Breakout mode the user picks Sydney, Tokyo, London, or New York. In Time-based Breakout mode the user supplies a start and end time in HH:MM form. Both modes feed the same measurement engine, so evidence collected from different windows stays comparable. The logger's life cycle has three stages, and every column in the output belongs to one of them. The range stage accumulates the high, low, tick volume, and bar count while the window is open. When the window closes, the range is frozen and stamped with ATR, the previous day's high and low, and the prior session's boundaries. The breakout stage captures the first bar whose close exits the range, along with its size, body, penetration distance, and relative volume. The tracking stage follows the next twenty-four bars and measures retest behavior, favorable and adverse excursion, and the final outcome.
The key design choice is separating stages. Range and breakout fields are available when the breakout candle closes and can be used for entry. Tracking fields are only known afterward. Maximum favorable excursion, retest depth, and the outcome label itself can only be known afterwards. If we mix the two, we build an Expert Advisor that looks profitable in analysis and collapses in live trading, because it is quietly using information from the future. The logger writes both halves into the same file but labels them clearly, and the first thing we ask the AI to do is enforce that boundary.
Outcome classification uses a first-touch rule. An event is SUCCESS if favorable excursion reaches one full range width before price closes more than halfway back inside the range, FALSE if the reverse happens first, and NEUTRAL if neither occurs within the tracking window. When both trigger on the same bar, the row carries an ambiguity flag so those events can be excluded rather than guessed at. This is a deliberately strict definition, and it produces a sobering baseline.
Getting Started
Enumerations and inputs
//+------------------------------------------------------------------+
//|                                              Breakout Logger.mq5 |
//|                                  Copyright 2025, MetaQuotes Ltd. |
//|                     https://www.mql5.com/en/users/johnhlomohang/ |
//+------------------------------------------------------------------+
#property copyright "Copyright 2025, MetaQuotes Ltd."
#property link      "https://www.mql5.com/en/users/johnhlomohang/"
#property version   "1.00"

//+------------------------------------------------------------------+
//| Enumerations                                                     |
//+------------------------------------------------------------------+
enum ENUM_RANGE_MODE
  {
   RANGE_SESSION      = 0,  // Session breakout
   RANGE_CUSTOM_TIME  = 1   // Time-based breakout
  };

enum ENUM_LOG_SESSION
  {
   SESSION_SYDNEY     = 0,  // Sydney
   SESSION_TOKYO      = 1,  // Tokyo (Asian range)
   SESSION_LONDON     = 2,  // London
   SESSION_NEWYORK    = 3   // New York
  };

enum ENUM_BREAK_TRIGGER
  {
   TRIGGER_CLOSE      = 0,  // Bar close beyond the edge
   TRIGGER_WICK       = 1   // Any touch beyond the edge
  };

enum ENUM_R_BASIS
  {
   R_RANGE            = 0,  // R = range width
   R_ATR              = 1   // R = ATR at range formation
  };

//+------------------------------------------------------------------+
//| Inputs                                                           |
//+------------------------------------------------------------------+
input group "=== Range definition ==="
input ENUM_TIMEFRAMES    InpLogTF          = PERIOD_M5;        // Logging timeframe
input ENUM_RANGE_MODE    InpRangeMode      = RANGE_SESSION;    // Range mode
input ENUM_LOG_SESSION   InpSession        = SESSION_TOKYO;    // Session (session mode only)
input string             InpTimeStart      = "07:00";          // Start HH:MM (time mode only)
input string             InpTimeEnd        = "09:00";          // End HH:MM (time mode only)
input int                InpServerOffsetHr = 0;                // Hours to shift session presets
input int                InpMinRangeBars   = 3;                // Minimum bars for a valid range

input group "=== Breakout detection ==="
input ENUM_BREAK_TRIGGER InpTrigger        = TRIGGER_CLOSE;    // Breakout trigger
input double             InpBufferATR      = 0.05;             // Buffer beyond edge (x ATR)
input int                InpBreakWindowBar = 48;               // Bars after range to hunt breakouts
input int                InpMaxEvents      = 2;                // Max breakouts logged per range
input bool               InpOnePerSide     = true;             // Only first breakout per direction

input group "=== Outcome measurement ==="
input int                InpTrackBars      = 24;               // Bars tracked after each breakout
input int                InpFollowBars     = 3;                // Fixed follow-through horizon (bars)
input ENUM_R_BASIS       InpRBasis         = R_RANGE;          // Basis for the R unit
input double             InpSuccessR       = 1.0;              // Success: MFE >= this many R
input double             InpFailInsidePct  = 50.0;             // False: close this % back inside range
input double             InpRetestTolATR   = 0.10;             // Retest tolerance (x ATR)

input group "=== Context features ==="
input int                InpATRPeriod      = 14;               // ATR period
input int                InpVolAvgPeriod   = 20;               // Bars for average tick volume
input int                InpPriorLookback  = 50;               // Bars for prior high/low reference

input group "=== Output ==="
input string             InpCSVFile        = "RangeBreakoutLog.csv"; // CSV file name
input bool               InpCommonFolder   = true;             // Write to the common folder
input bool               InpAppend         = false;            // Append to existing file
input bool               InpDrawObjects    = true;             // Draw ranges and breakouts
input bool               InpVerbose        = true;             // Print each event to the journal
These inputs are not tuning knobs; they are the research hypothesis written down. The enumerations define what a range is, what counts as a breakout, and what a unit of reward means. ENUM_BREAK_TRIGGER exists because traders genuinely disagree on whether a breakout needs a close beyond the boundary or merely a touch, so we measure it rather than assume it.
Four settings matter. InpServerOffsetHr keeps session presets consistent across brokers (GMT+2 vs GMT+3 changes the Tokyo range). InpBufferATR expresses tolerance in ATR multiples rather than points, so the same value behaves sensibly on other pairs. InpSuccessR and InpFailInsidePct define what winning means, and they are strict by design: a loose definition would flatter the strategy and teach us nothing.
The data structures
//+------------------------------------------------------------------+
//| Structures                                                       |
//+------------------------------------------------------------------+
struct RangeInfo
  {
   bool              valid;
   datetime          startTime;
   datetime          endTime;
   double            high;
   double            low;
   double            size;
   int               bars;
   int               minutes;
   long              tickVol;
   double            atr;
   double            prevDayHigh;
   double            prevDayLow;
   double            priorHigh;
   double            priorLow;
   int               events;
   bool              brokeUp;
   bool              brokeDown;
   int               barsSinceEnd;
  };

struct BreakEvent
  {
   bool              active;
   int               id;
   int               dir;              // +1 up, -1 down
   RangeInfo         rng;              // frozen copy of the parent range
   datetime          brkTime;
   double            brkPrice;
   double            brkOpen;
   double            brkHigh;
   double            brkLow;
   double            brkClose;
   long              brkVol;
   double            volRatio;
   int               spreadPts;
   int               barsAfterRange;
   double            rUnit;
   double            edge;
   //--- tracking
   int               barsTracked;
   double            mfe;
   double            mae;
   int               mfeBar;
   int               maeBar;
   double            followN;
   bool              followNset;
   bool              retestSeen;
   int               retestBar;
   double            retestExtreme;
   int               retestDurBars;
   bool              retestHeld;
   bool              closedInside;
   int               barsToTarget;
   int               barsToFail;
   bool              ambiguous;
   int               outcome;          // 1 success, -1 false, 0 undecided
   bool              truncated;
  };
RangeInfo holds everything known about a range once its window closes, with the valid flag gating out fragments that would poison the statistics. The single most important line in the second structure is RangeInfo rng. Each event carries its own frozen copy of the parent range rather than a reference to the live global. Without it, a second breakout or the arrival of the next session would overwrite range data underneath an event still being tracked. By copying at the moment the breakout fires, every row describes the world exactly as it was when the decision would have been made. This is the structural guarantee against contaminated data, and it is far easier to get right in a logger than to debug inside a live Expert Advisor.
Resolving the time window
bool InWindow(const int m)
  {
   if(g_winStartMin == g_winEndMin)
      return false;
   if(g_winStartMin < g_winEndMin)
      return (m >= g_winStartMin && m < g_winEndMin);
   return (m >= g_winStartMin || m < g_winEndMin);
  }
Both range modes are reduced to a pair of minute-of-day values, and membership is tested against those rather than against dates. The third return statement handles the wrap-around case where the window opens before midnight and closes after it. The Sydney session runs 23:00 to 06:00 and would break any implementation assuming start is always less than end. Because of this, session mode and custom time mode share one code path.
//+------------------------------------------------------------------+
//| Window resolution                                                |
//+------------------------------------------------------------------+
bool ResolveWindow()
  {
   if(InpRangeMode == RANGE_CUSTOM_TIME)
     {
      int s = ParseHHMM(InpTimeStart);
      int e = ParseHHMM(InpTimeEnd);
      if(s < 0 || e < 0)
        {
         Print("Invalid time window. Use HH:MM, for example 07:00 and 09:00.");
         return false;
        }
      if(s == e)
        {
         Print("Start and end time must differ.");
         return false;
        }
      g_winStartMin = s;
      g_winEndMin   = e;
      g_winName     = "CUSTOM_" + InpTimeStart + "-" + InpTimeEnd;
      StringReplace(g_winName, ":", "");
      return true;
     }

   int sh = 0, eh = 0;
   switch(InpSession)
     {
      case SESSION_SYDNEY:
         sh = 23;
         eh =  6;
         g_winName = "SYDNEY";
         break;
      case SESSION_TOKYO:
         sh =  2;
         eh = 10;
         g_winName = "TOKYO";
         break;
      case SESSION_LONDON:
         sh = 10;
         eh = 15;
         g_winName = "LONDON";
         break;
      case SESSION_NEWYORK:
         sh = 15;
         eh = 21;
         g_winName = "NEWYORK";
         break;
     }
   g_winStartMin = WrapMin((sh + InpServerOffsetHr) * 60);
   g_winEndMin   = WrapMin((eh + InpServerOffsetHr) * 60);
   return true;
  }
The session presets are applied and then shifted by the server offset before being wrapped back into a valid minute-of-day. The WrapMin helper performs a double modulo so that negative offsets behave correctly, which a single % operation in MQL5 would not guarantee. The window name is captured as a string at the same time and written into every row, so that files produced from different sessions can be concatenated later without losing track of where each event came from.
Freezing the range
//+------------------------------------------------------------------+
//| Freeze Range                                                     |
//+------------------------------------------------------------------+
void FreezeRange(const int shift)
  {
   g_range.size = g_range.high - g_range.low;

   int tfSec = PeriodSeconds(InpLogTF);
   g_range.minutes = (int)((g_range.endTime - g_range.startTime + tfSec) / 60);

   g_range.atr = AtrAt(shift);

   MqlRates d1[];
   if(CopyRates(_Symbol, PERIOD_D1, 1, 1, d1) == 1)
     {
      g_range.prevDayHigh = d1[0].high;
      g_range.prevDayLow  = d1[0].low;
     }

   int startShift = iBarShift(_Symbol, InpLogTF, g_range.startTime, false);
   double ph = 0.0, pl = 0.0;
   if(HiLo(startShift + 1, InpPriorLookback, ph, pl))
     {
      g_range.priorHigh = ph;
      g_range.priorLow  = pl;
     }

   g_range.events       = 0;
   g_range.brokeUp      = false;
   g_range.brokeDown    = false;
   g_range.barsSinceEnd = 0;

   bool ok = (g_range.bars >= InpMinRangeBars && g_range.size > 0.0 && g_range.atr > 0.0);
   g_range.valid = ok;

   if(ok)
     {
      DrawRange(g_range);
      if(InpVerbose)
         PrintFormat("Range %s -> %s  high=%s low=%s width=%.1f pts  bars=%d",
                     TS(g_range.startTime), TS(g_range.endTime),
                     D(g_range.high, _Digits), D(g_range.low, _Digits),
                     Pts(g_range.size), g_range.bars);
     }
  }
This function runs once per session and is where the range stops being a moving target and becomes an immutable measured object. ATR is sampled at this exact moment rather than recomputed later, so every normalized column in the file shares one consistent volatility reference. The previous day's levels and the prior lookback high and low are captured here too, giving us the structural context the breakout will happen in. As the analysis will show, that context matters more than several features we might have expected to dominate.
Opening an event
//+------------------------------------------------------------------+
//| Event lifecycle                                                  |
//+------------------------------------------------------------------+
void OpenEvent(const int dir, const MqlRates &b, const int shift, const double level)
  {
   BreakEvent e;
   ZeroMemory(e);

   e.active         = true;
   e.id             = ++g_eventSeq;
   e.dir            = dir;
   e.rng            = g_range;
   e.brkTime        = b.time;
   e.brkOpen        = b.open;
   e.brkHigh        = b.high;
   e.brkLow         = b.low;
   e.brkClose       = b.close;
   e.brkVol         = b.tick_volume;
   e.spreadPts      = b.spread;
   e.brkPrice       = (InpTrigger == TRIGGER_CLOSE) ? b.close : level;
   e.edge           = (dir > 0) ? g_range.high : g_range.low;
   e.barsAfterRange = g_range.barsSinceEnd;
   e.rUnit          = (InpRBasis == R_RANGE) ? g_range.size : g_range.atr;

   double avgVol    = AvgTickVol(shift + 1, InpVolAvgPeriod);
   e.volRatio       = (avgVol > 0.0) ? (double)b.tick_volume / avgVol : 0.0;

   e.retestBar      = -1;
   e.retestDurBars  = -1;
   e.mfeBar         = -1;
   e.maeBar         = -1;
   e.barsToTarget   = -1;
   e.barsToFail     = -1;
   e.outcome        = 0;

   int n = ArraySize(g_events);
   ArrayResize(g_events, n + 1);
   g_events[n] = e;

   g_range.events++;
   if(dir > 0)
      g_range.brokeUp = true;
   else
      g_range.brokeDown = true;

   if(InpVerbose)
      PrintFormat("Breakout #%d %s at %s  price=%s  volRatio=%.2f",
                  e.id, (dir > 0 ? "UP" : "DOWN"), TS(b.time),
                  D(e.brkPrice, _Digits), e.volRatio);
  }
The entry price deserves attention. When the trigger is a close, we record the actual close of the breakout candle, because that is where a bar-close Expert Advisor would enter. When the trigger is a wick, we record the buffered trigger level—the boundary offset by the ATR buffer—because that is where a resting stop order would actually have filled. Using the close in both cases would overstate the entry quality of wick-triggered breakouts and quietly corrupt every excursion measurement that follows. The volume ratio is computed against the average of the bars immediately preceding the breakout rather than against the range average, which makes it a measure of surge at the moment of the break rather than a measure of how busy the session was overall. Both concepts turn out to be useful, and the file carries them as separate columns.
Tracking an event
//+------------------------------------------------------------------+
//| Track Event                                                      |
//+------------------------------------------------------------------+
void TrackEvent(BreakEvent &e, const MqlRates &b)
  {
   e.barsTracked++;
   int k = e.barsTracked;

   double fav = (e.dir > 0) ? (b.high - e.brkPrice) : (e.brkPrice - b.low);
   double adv = (e.dir > 0) ? (e.brkPrice - b.low)  : (b.high - e.brkPrice);

   if(fav > e.mfe)
     {
      e.mfe    = fav;
      e.mfeBar = k;
     }
   if(adv > e.mae)
     {
      e.mae    = adv;
      e.maeBar = k;
     }

   if(!e.followNset && k == InpFollowBars)
     {
      e.followN    = (e.dir > 0) ? (b.close - e.brkPrice) : (e.brkPrice - b.close);
      e.followNset = true;
     }

//--- retest bookkeeping
   double tol = InpRetestTolATR * e.rng.atr;
   if(!e.retestSeen)
     {
      bool touched = (e.dir > 0) ? (b.low <= e.edge + tol) : (b.high >= e.edge - tol);
      if(touched)
        {
         e.retestSeen    = true;
         e.retestBar     = k;
         e.retestExtreme = (e.dir > 0) ? b.low : b.high;
        }
     }
   else
      if(e.retestDurBars < 0)
        {
         if(e.dir > 0 && b.low  < e.retestExtreme)
            e.retestExtreme = b.low;
         if(e.dir < 0 && b.high > e.retestExtreme)
            e.retestExtreme = b.high;

         bool resumed = (e.dir > 0) ? (b.close > e.brkHigh) : (b.close < e.brkLow);
         if(resumed)
           {
            e.retestDurBars = k - e.retestBar;
            e.retestHeld    = true;
           }
        }

//--- did the bar close back inside the range at all
   bool inside = (e.dir > 0) ? (b.close < e.rng.high) : (b.close > e.rng.low);
   if(inside)
      e.closedInside = true;

//--- outcome resolution, first touch wins
   if(e.outcome == 0)
     {
      bool hitTarget = (e.mfe >= InpSuccessR * e.rUnit);

      double failLvl = (e.dir > 0)
                       ? e.rng.high - (InpFailInsidePct / 100.0) * e.rng.size
                       : e.rng.low  + (InpFailInsidePct / 100.0) * e.rng.size;
      bool hitFail = (e.dir > 0) ? (b.close < failLvl) : (b.close > failLvl);

      if(hitTarget && hitFail)
         e.ambiguous = true;
	 //--- same-bar collision: bar data cannot tell us which came first,
	 //--- so leave the event undecided rather than guessing SUCCESS

       else if(hitTarget)
        {
         e.outcome      = 1;
         e.barsToTarget = k;
        }
      else
         if(hitFail)
           {
            e.outcome    = -1;
            e.barsToFail = k;
           }
     }
  }
Three things happen on every tracked bar. Excursions are measured from the recorded entry price with the direction sign applied, and the bar index is stored alongside each extreme—that index is what later distinguishes a breakout that peaked immediately and died from one that built steadily.
Retest detection runs as a two-state machine. The first branch waits for price to return within tolerance of the broken boundary; the second tracks how deep it goes and watches for a close back beyond the breakout candle's extreme, which is our definition of the retest holding. Retest depth turns out to be the most decisive behavioral difference between winners and losers in the dataset.
Outcome resolution is guarded by e.outcome == 0, implementing the first-touch rule: once resolved, the verdict is locked, though tracking continues so excursion statistics stay complete. When both conditions trigger on the same bar the ambiguity flag is set, because bar data cannot tell us which came first. Marking that uncertainty costs one boolean column and prevents a whole class of silent error. Because the flag now blocks the outcome assignment as well as marking the row, ambiguous events fall through as undecided and never enter the SUCCESS or FALSE counts.
The per-bar orchestration
//+------------------------------------------------------------------+
//| Per-bar processing                                               |
//+------------------------------------------------------------------+
void ProcessBar(const MqlRates &b, const int shift)
  {
   int  mod    = MinuteOfDay(b.time);
   bool inWin  = InWindow(mod);

//--- window edges
   if(inWin && !g_prevInWin)
     {
      FlushActive(true);          // a new window ends any open tracking
      StartRange(b);
      g_prevInWin = true;
      return;
     }

   if(inWin && g_prevInWin)
     {
      UpdateRange(b);
      g_prevInWin = true;
      return;
     }

   if(!inWin && g_prevInWin)
     {
      FreezeRange(shift);
      g_prevInWin = false;
      //--- this bar already sits outside the window, so let it be examined below
     }

   g_prevInWin = false;

   if(!g_range.valid)
      return;

//--- track everything already open
   for(int i = 0; i < ArraySize(g_events); i++)
     {
      if(!g_events[i].active)
         continue;
      TrackEvent(g_events[i], b);
      if(g_events[i].barsTracked >= InpTrackBars)
         FinalizeEvent(g_events[i], false);
     }

//--- hunt for new breakouts
   g_range.barsSinceEnd++;
   if(g_range.barsSinceEnd > InpBreakWindowBar)
      return;
   if(g_range.events >= InpMaxEvents)
      return;

   double buffer  = InpBufferATR * g_range.atr;
   double upLevel = g_range.high + buffer;
   double dnLevel = g_range.low  - buffer;

   double refUp = (InpTrigger == TRIGGER_CLOSE) ? b.close : b.high;
   double refDn = (InpTrigger == TRIGGER_CLOSE) ? b.close : b.low;

   bool allowUp = !(InpOnePerSide && g_range.brokeUp);
   bool allowDn = !(InpOnePerSide && g_range.brokeDown);

   if(allowUp && refUp > upLevel)
      OpenEvent(1, b, shift, upLevel);

   if(g_range.events < InpMaxEvents && allowDn && refDn < dnLevel)
      OpenEvent(-1, b, shift, dnLevel);
  }
The orchestration runs on edge detection rather than date arithmetic, which is what makes wrap-around sessions work without special cases. On the rising edge any events still being tracked are flushed with the truncated flag set—an event cut short by the next session did not reach its natural conclusion, and marking it lets the analysis handle those rows rather than treating a partial observation as complete. On the falling edge the range is frozen and the same bar falls through to be examined for a breakout. Both directions are then tested against the buffered boundary, since a narrow range in high volatility can in principle be pierced on both sides by a single bar.
Writing the evidence
//+------------------------------------------------------------------+
//| Write Row                                                        |
//+------------------------------------------------------------------+
void WriteRow(const string row)
  {
   int h = FileOpen(InpCSVFile, g_fileFlags);
   if(h == INVALID_HANDLE)
     {
      Print("Cannot open CSV file ", InpCSVFile, ", error ", GetLastError());
      return;
     }
   FileSeek(h, 0, SEEK_END);
   if(FileTell(h) == 0)
      FileWriteString(h, CsvHeader() + "\r\n");
   FileWriteString(h, row + "\r\n");
   FileClose(h);
  }
Rows are appended by opening the file, seeking to the end, writing, and closing it. This is slower than keeping the handle open, but events occur at most twice per session. The benefit is a consistently readable file even if the run is interrupted. The header is written only when the file is empty, which lets multiple runs accumulate into a single dataset. The file flags include FILE_COMMON by default, placing the output in the shared folder that both the Strategy Tester agents and the live terminal can reach, so backtest evidence and forward-test evidence land in the same place.
Running the Logger
We attached the logger to GBPUSD on M15 in Session mode (Tokyo) and ran it in the Strategy Tester from January 2025 to August 2026. For this run, InpLogTF was set to M15; all figures below assume that setting. The full run recorded 419 events. However, the statistical analysis from the baseline was performed on a systematic sample of 42 of those events—every tenth row by EventID—so the numbers that follow describe that sample, not the full set, and should be read as indicative rather than settled.
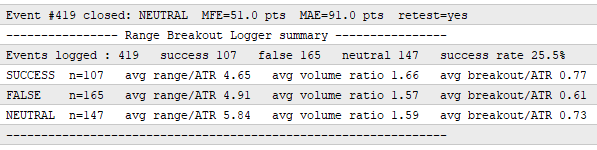
The journal summary printed at the end of the run is the first sanity check. It reports how many events were recorded, how they split across outcomes, and how the average range width, volume ratio, and breakout distance differ between winners and losers. If those three averages had come back identical across outcome groups, we would have known immediately that our chosen features carry no information, and the honest next step would have been to change the features rather than proceed. They did not come back identical.
Decoding the Evidence with the MT5 AI Assistant
We now hand the file to the MT5 AI Assistant. The temptation at this point is to ask one big question: "what rules should my Expert Advisor use?" That is precisely the question that produces strategy drift, because it invites the model to skip straight to conclusions built on statistics nobody has audited. Instead we work through nine phases, each with a narrow goal, and each ending with an explicit instruction not to produce rules yet. The discipline is the method.
Phase 1: Understanding the Dataset
Goal:
Establish what each column measures, when it becomes available, and whether an Expert Advisor could legitimately act on it.
Output:
| Count | Fields |
|---|---|
| Known at or before the breakout (usable for entry) | Range formation, RangeSizePts, RangeSizeATR, ATRpts, prior-day and prior-structure distances, range and breakout volume, VolRatio, all timing fields, Direction, BreakoutPrice, BrkCandlePts, BrkBodyPts, BrkBodyRatio, BrkCandleATR, BrkDistPts, BrkDistATR, SpreadPts |
| Known only after entry (labels and diagnostics) | All retest fields, FollowThrough, MFE/MAE, ClosedBackInside, BarsTracked, Truncated, BarsToTarget, BarsToFail, AmbiguousBar, Outcome |
This split is the contract for the rest of the article. Thirty-nine columns are candidate features for an entry filter; twenty-two are candidate targets for evaluating those features. Any field from the lower row that finds its way into an entry condition produces an Expert Advisor that looks brilliant in analysis and fails live. The breakout-candle fields in the upper row are entry-usable only under a bar-close trigger; with an intra-bar trigger they are still forming when the decision is made, so they belong with the hindsight fields instead.
The AI flagged one field as sitting on the boundary. RetestSeen is something an Expert Advisor can watch for live and legitimately act on mid-trade, but the value recorded in the CSV depends on the entire tracking window and is therefore not knowable at entry. It is an evolving signal, not a static feature—a distinction that will matter when we design trade management in Part 2. It also noted that every breakout-candle metric is conditional on bar-close confirmation: with an intra-bar trigger, those values are still in flight when the decision is made.
Phase 2: Validate the Data
Goal:
Find out whether the file can be trusted before any conclusion is drawn from it.
Output:
| Check | Result |
|---|---|
| Data rows/fields | 419/61 per row, consistent |
| Missing values, NaN, NULL, malformed rows | 0 |
| Duplicate EventIDs/RangeDates/BreakoutTime | none |
| Range, breakout, ratio, and outcome invariants | no arithmetic violations in the sampled rows. |
"Clean" here means the arithmetic is internally consistent, not that the file is free of problems—the defects below are real and some of them affect the analysis. The structure is clean, but this phase produced the most useful warnings. Event 299 carries a spread of −134,076 points and must be excluded. Ten or more rows carry negative retest depths—a sign convention, not a bug, but one that would silently distort any depth statistic. Four events are right-censored and currently resolve as NEUTRAL without having run the full window. Roughly fourteen weekdays are missing from the file and are not standard holidays.
Most importantly, four field definitions could not be confirmed from the data. ClosedBackInside is set on any close back inside the range, but behaves as if it means “inside at the end of tracking”. FollowThroughPts is coded as a fixed-horizon signed move, but is inconsistent in the file. DistPrior* is unverified, and VolRatio's denominator is not range volume per bar. We discovered four ambiguous features by auditing a file rather than by debugging strange live behavior six months from now.
Phase 3: Establish the Baseline
Prompt:
Measure the unfiltered strategy before asking why it works or fails.
One caveat the article would be dishonest without: from here onward the statistics come from a systematic ten percent sample of 42 events spanning the full period, not all 419 rows. The assistant said so rather than presenting sampled figures as exhaustive. Read the numbers as right in direction and roughly right in magnitude.
Output:
| Metric | Mean | Median |
|---|---|---|
| Range size vs ATR | 5.16 | 4.82 |
| Breakout penetration (BrkDistATR) | 0.59 | 0.36 |
| Volume ratio (VolRatio) | 1.54 | 1.48 |
| Max favorable excursion (MFE_R) | 0.81 | 0.65 |
| Max adverse excursion (MAE_R) | 0.82 | 0.49 |
| Time to resolution | 10.9 bars | 11 bars |
| Outcome | Sample (n=42) | Rate |
|---|---|---|
| SUCCESS | 11 | 26% |
| FALSE | 15 | 36% |
| NEUTRAL | 16 | 38% |
A typical Tokyo range is about five ATR wide, pierced by a third of an ATR on one-and-a-half times volume, retested nine times out of ten, and resolved in eleven bars. False outnumber successes three to two.
The excursion pair is the informative line. Mean MFE and MAE are almost identical at 0.81 and 0.82, with a heavy adverse tail reaching 5.5× range balancing the typical upside. Success is therefore not a question of how far price travels, since on average it travels equally far both ways—it is a question of order. Winners take a median 14 bars to reach target; false die in 6.
NEUTRAL is 38% of the sample and is easy to overlook in a SUCCESS-versus-FALSE framing: a filter that cuts false by pushing events into NEUTRAL reduces losers without producing winners, so the two must be read together. Four of these events are also right-censored—they were closed by the tracking horizon rather than by a real outcome—which nudges the NEUTRAL count and matters most in the smallest threshold cells.
Phase 4-6: Winners versus failed breakouts
Goal:
Identify what separates SUCCESS from FALSE, verify which hypotheses survive, and rank the differences by how reliably they separate.
Output:
| Characteristics | SUCCESS (n=11) | FALSE (n=15) | Separation |
|---|---|---|---|
| Distance to prior-day level, breakout side | -39 pts | +330 pts | strong |
| Distance to prior structure, breakout side | +12 pts | +282 pts | strong |
| Retest occurred | 73% | 100% | strong |
| Retest held | 100% (8/8) | 27% (4/15) | strong |
| Retest depth (% of range) | 30 | 82 (mean 135) | strong |
| Candle body ratio | 0.85 | 0.70 | moderate |
| Breakout candle size (points) | 144 | 114 | weak |
| Breakout candle vs ATR | 1.88 | 1.82 | none |
| Volume ratio | 1.41 (mean 1.49) | 1.30 (mean 1.53) | none |
| Range size vs ATR | 4.61 | 4.44 | none |
| ATR level | 66 | 68 | none |
| Breakout hour | 11 | 11 | none |
| Bars after range | 6 | 5 | none |
Positive distance means the range still has headroom to the prior-day level on the breakout side; negative means it already sits at or past it. Winners break from ranges sitting essentially on prior structure; false break from ranges roughly 330 points inside it, with no reference level nearby. This is the largest gap in the dataset and it appears against both references, which is corroboration rather than coincidence. The suggested mechanism—that a level aligned with prior structure carries stop clusters and prior conviction flow, while empty interior space has nothing to push against—is a hypothesis, not a demonstrated cause.
Three of our five false hypotheses held: poor structural location, unfavorable positioning, and rapid reversal back inside. One was half true, falses are not weaker by candle size (1.82 against 1.88) but are markedly wickier (body ratio 0.70 against 0.85). It is decisiveness that fails, not magnitude.
One was refuted outright. Volume did not separate winners from losers in this sample, and falses arrive on 2.8× and 2.6× spikes as readily as successes do. On 11 successes and 15 falses this is an absence of evidence rather than proof of no effect, but it is enough to say volume earns no place in the entry logic until a larger sample argues otherwise. The most widely repeated piece of breakout advice carries no information about outcome here.
Output:
| Feature | SUCCESS (Q1/Med/Q3) | FALSE (Q1/Med/Q3) | Verdict |
|---|---|---|---|
| Distance to prior-day level | −111 / −39 / +256 | ~130 / +330 / ~470 | Strongly useful |
| Distance to prior structure | −39 / +12 / +93 | ~60 / +282 / +474 | Strongly useful |
| BrkBodyRatio | 0.64 / 0.85 / 0.90 | 0.42 / 0.70 / 0.77 | Potentially useful |
| BrkDistATR | 0.32 / 0.54 / 1.38 | 0.20 / 0.32 / 0.65 | Weak |
| RangeSizeATR | 3.48 / 4.61 / 6.48 | 3.86 / 4.44 / 5.78 | Weak |
| VolRatio | 1.09 / 1.41 / 1.71 | 1.01 / 1.30 / 1.90 | Not useful |
| BrkCandleATR | 1.50 / 1.88 / 2.15 | 1.14 / 1.82 / 2.61 | Not useful |
| Breakout hour/BarsAfterRange | identical shapes | identical shapes | Not useful |
"Not useful" above means the feature showed no separation at this sample size, not that it is proven irrelevant—with 11 and 15 events per group these are directional readings, not verdicts.
Distributions sharpen the ranking. The location quartiles are nearly disjoint, which is what real separation looks like. Body ratio gaps widen at every quartile but the groups still overlap broadly. Range size and candle ATR are identical through their middles and differ only in tails.
The smallest separating set is therefore two entry-time dimensions: structure location and candle body decisiveness, with penetration depth surviving as an optional tail adjustment. Note that the strongest separators overall are the retest signals — 100% hold against 27%—but they are post-entry by construction. They can shape exits in Part 2. They can never filter an entry.
Phase 7: Investigate Useful Thresholds
Goal:
Find thresholds that are stable across neighboring values, not thresholds that maximize historical win rate.
Baseline for comparison: SUCCESS 26.2%, FALSE 35.7%.
Output:
| Distance to prior-day level | n | S% | F% | ΔS | ΔF |
|---|---|---|---|---|---|
| ≤ 0 (range at or past reference) | 11 | 54.5 | 9.1 | +28.3 | -26.5 |
| ≤ 50 | 14 | 57.1 | 14.3 | +30.9 | -21.4 |
| ≤ 100 | 15 | 53.3 | 20.0 | +27.1 | -15.7 |
| ≤ 150 | 18 | 50.0 | 27.8 | +23.8 | -7.9 |
| ≤ 250 | 23 | 39.1 | 26.1 | +12.9 | -9.6 |
| ≤ 400 | 30 | 33.3 | 33.3 | +7.1 | -2.4 |
| > 400 (far from structure) | 12 | 8.3 | 41.7 | -17.9 | +6.0 |
This is what a stable effect looks like. Success sits flat at 50–57% across the entire zero-to-150-point band, then decays measurably and is gone by 250–300. The edge is a zone, not a knife edge, and choosing ≤ 0 or ≤ 50 barely changes the result. These bands are nested and share most of their events, so this shows the effect is not concentrated at one cut-off rather than proving it out of sample—the genuine test is the held-out 90% of the data, which we have not yet run. The negative region is as informative as the positive one: beyond 400 points from structure, success collapses to 8% against a 42% false rate.
Output:
| Body ratio | n | S% | F% | ΔS | ΔF |
|---|---|---|---|---|---|
| ≥ 0.80 | 14 | 50.0 | 7.1 | +23.8 | -28.6 |
| ≥ 0.79 | 15 | 53.3 | 6.7 | +27.1 | -29.0 |
| ≥ 0.75 | 18 | 44.4 | 22.2 | +18.2 | -13.5 |
| ≥ 0.70 | 22 | 36.4 | 31.8 | +10.2 | -3.9 |
| < 0.70 | 20 | 15.0 | 35.0 | -11.2 | -0.7 |
Body ratio passes the same test: 0.79 and 0.80 give virtually identical results, so the threshold is robust rather than fitted. The edge drops off quickly below 0.75 and is gone by 0.70. Note the asymmetry—a weak candle is not the mirror image of a strong one. Sub-0.70 events are neutral-heavy rather than false-heavy, and falses actually concentrate in the middle band around 0.43 to 0.77.
The most instructive part of this phase is what the AI explicitly refused to recommend:
Output:
| Tempting pocket | n | S/F/N | S% | Why it was rejected |
|---|---|---|---|---|
| Location ≤ 50 AND body ≥ 0.79 | 7 | 6/0/1 | 85.7 | One event swings it ±14 pp |
| RangeSizeATR ≤ 3.5 | 4 | 3/0/1 | 75.0 | Tail effect, not a stable band |
An 85.7% success rate with zero falses is precisely the number a developer screenshots and builds an Expert Advisor around. On seven events it is noise. Recording where the two strong features agree is a useful diagnostic; deploying it as a threshold is how overfitting happens.
Phase 8: UP vs DOWN Breakouts
Goal:
Test whether bullish and bearish breakouts need different models.
Output:
| Outcome | UP (n=20) | DOWN (n=22) |
|---|---|---|
| SUCCESS | 25.0% | 27.3% |
| FALSE | 20.0% | 50.0% |
| NEUTRAL | 55.0% | 22.7% |
| Retest held | 89% | 55% |
| MFE_R (median) | 0.78 | 0.54 |
| MAE_R (median) | 0.46 | 0.70 |
Success rates are effectively identical across direction, but what happens afterwards is not. UP breakouts drift: more than half never resolve inside the window, retests hold nine times out of ten, favorable excursion builds beyond the range, and adverse excursion stays modest. DOWN breakouts fight: they resolve often and resolve as falses half the time, retests break back inside almost half the time, favorable room is scarce, and adverse excursion runs roughly twice as deep with a tail reaching 3.4 to 4.6× range. Larger, wickier, louder candles on the DOWN side are exactly the signature of impulse without follow-through.
The decisive test was whether the two entry features behave the same way inside each direction, and they do. Structure location separates winners from losers in both groups with the same polarity, and so does body ratio. The signal axis is direction-independent; only the risk profile around it differs. That supports one common entry model, with DOWN breakouts treated as the riskier animal when it comes to sizing and management rather than selection. On samples of twenty and twenty-two with heavy overlap, separate directional rules would be fitting noise.
Phase 9: Time and Session Behavior
Goal:
Determine whether any time period deserves preference, weighting every finding by sample size.
Output:
| Bars after range | n | S% | F% | MFE med | Follow-through med |
|---|---|---|---|---|---|
| ≤ 2 (immediate) | 12 | 16.7 | 50.0 | 0.63 | −0.01 |
| 3-6 | 12 | 33.0 | 25.0 | 0.83 | +0.03 |
| 7-14 | 10 | 30.0 | 60.0 | 0.46 | −0.26 |
| 15+ | 8 | 25.0 | 0.0 | 0.47 | +0.19 |
The 7-14 bar zone is the strongest time signal: false-heavy at 60%, with the worst follow-through and the weakest favorable excursion in the table. Breakouts that take more than about ninety minutes to trigger look like late, contested moves. Immediate breakouts underperform too, at 17% success against 50% false. The 3–6 bar pocket looks best. The 15+ zone's zero percent false rate is an illusion produced by six neutrals in eight events.
Before treating these as three findings, note the confound the AI raised: the range window ends at 09:45, so "10:00 breakout" and "≤ 2 bars after range" are largely the same events seen through two correlated lenses. Hour and bars-after-range are mechanically coupled, and the honest reading is one axis—prompt versus contested breakout timing—rather than two independent discoveries. Follow-through appears in this table despite being one of the fields the audit could not verify, so its column is read only for direction, not magnitude.
Day of week produced the clearest illustration of the sample-size rule in the whole analysis. Wednesday shows 80% success and Friday 0%, both on five events, where a single event moves each figure by twenty percentage points. Those are not findings. Monday, the only weekday cell with real mass at twenty-eight events, does underperform on both success and false safety—and that one is worth carrying forward, though the sample's Monday-heavy grid is itself a candidate artifact.
The overall verdict is preference grading rather than hard filters. Time moves success rates by roughly eight to seventeen percentage points, against twenty-seven to thirty-one from structure location. Time is a secondary order, not a primary separator.
Conclusion
The reason so many Expert Advisors end up as distorted versions of the strategies that inspired them is that we begin coding before we understand how our own rules behave. In this article we inverted that order. We built a Range Breakout logger that takes no trades, supports session-based and time-based range definitions, and records sixty-one measurements per breakout, then ran it across twenty months of GBPUSD Tokyo sessions and interrogated a systematic 42-event sample of the resulting 419 breakouts in nine structured phases. What emerged contradicted most of what we would have assumed. Volume confirmation showed no separation between winners and losers in this sample. Breakout candle size, range size, ATR level, and time of day were similarly flat. Two features carried almost all the signal: where the range sits relative to prior-day structure on the breakout side, and how clean the breakout candle's body is. The strongest separators in the entire dataset—retest depth and whether the retest held—turned out to be post-entry by construction, useful for managing a trade and useless for selecting one.
The analysis also produced warnings we would not have received any other way. Four field definitions could not be verified from the data alone. One row carries a corrupted spread. Roughly fourteen weekdays are missing from the file. And every statistic from the baseline onward rests on a ten percent sample rather than the full dataset, which the assistant stated plainly instead of presenting sampled figures as exhaustive ones. The honest position at the end of Part 1 is therefore that we have a strong candidate signal, a clear ranking of what does not work, and a specific list of things to verify before any of it becomes code. Nothing here has been checked against the 90% of the data the sample left out, so every threshold is a candidate to validate on that held-out set—or on a later period—before it earns any confidence.
What transfers is the method rather than the numbers. The logger here is specific to Range Breakout, but the structure suits any strategy: define the components, instrument them, record the outcome, separate what is knowable at entry from what is only knowable in hindsight, and interrogate the evidence in phases before writing a line of trading logic. In Part 2 we build the Expert Advisor from exactly this evidence. Structure location becomes the primary entry condition with its threshold justified by the stability of the zone rather than the peak of the win rate, body ratio becomes the secondary filter, the retest findings shape exit logic with the constraint that they must be replicated live rather than read from a file, and the UP/DOWN asymmetry is carried as a risk adjustment rather than a separate rule set. The question Part 2 answers is whether evidence-led development actually produces a better Expert Advisor than the intuition-led approach it was designed to replace.
Appendix: The Nine Prompts
These are the prompts used with the MT5 AI Assistant, in order. Each ends with a constraint that prevents the model from collapsing all nine phases into a premature conclusion.
- Understand the dataset: I have provided a CSV dataset generated by my Range Breakout Logger. Before any analysis, help me understand what the data contains. Group the columns into logical categories—range formation, volatility, context, breakout characteristics, volume, timing, retest, MFE/MAE, and outcome. For each column, explain what it measures, when it becomes available, and whether an EA could use it at entry time. Clearly separate what is known at the breakout from what only becomes available afterward. Do not optimize anything yet.
- Validate the data: Perform a data integrity audit. Check for missing values, duplicates, impossible range or breakout values, incorrect MFE/MAE relationships, inconsistent R calculations, suspicious outcome classifications, truncated events, and extreme outliers. Classify each important field as: safe for entry decisions, only available after entry, potentially affected by look-ahead bias, or a data-quality concern. Do not create trading rules yet.
- Establish the baseline: Give me a statistical overview of the entire dataset. Summarize total events, success and false rates, UP vs DOWN distribution, average range size relative to ATR, breakout distance, volume ratio, follow-through, MFE, MAE, retest frequency, and average time to resolution. Use medians alongside averages. The goal is to understand the baseline behavior before investigating why some breakouts succeed and others fail.
- Understand the winning breakouts: Analyze only the SUCCESS events. For each key characteristic—range size, ATR, breakout candle strength, volume, distance from prior structure, timing, day of week, and retest behavior—compare successful breakouts against the overall dataset. Identify patterns but do not assume correlation is causation. Do not turn findings into trading rules yet.
- Understand the failed breakouts: Perform the same analysis on FALSE breakout events. Identify characteristics that appear common in failed breakouts—weak candles, low volume, poor distance, unfavorable structure location, rapid reversal back inside the range—and compare them directly with successful breakouts. Distinguish strong observations from weak or uncertain ones. Do not create filters yet.
- Winners vs losers: Directly compare SUCCESS and FALSE events across the most promising features: RangeSizeATR, VolRatio, BrkBodyRatio, BrkCandleATR, BrkDistATR, timing, day of week, and historical price location. Compare distributions and medians, not just averages. Classify each feature as strongly useful, potentially useful, weak, or not useful. Then identify the smallest group of features that best separates high-quality breakouts from low-quality ones. Do not finalize EA rules yet.
- Investigate useful thresholds: For the strongest candidate features from the previous phase, investigate whether meaningful thresholds exist. For each threshold candidate, show the number of events, success rate, false rate, and the difference from the overall baseline. Prefer thresholds that are stable and retain a reasonable sample size over thresholds that simply produce the highest historical win rate. Do not finalize EA rules yet.
- UP vs DOWN breakouts: Analyze UP and DOWN breakouts separately across success rate, range characteristics, volume, candle strength, timing, retest behavior, MFE, and MAE. Determine whether the data supports one common breakout model for both directions, or whether meaningful differences justify separate conditions. Do not propose separate rules unless the evidence is sufficient.
- Time and Session behavior: Analyze the time-based behavior of breakout events — breakout hour, bars after the range, and day of week. Identify whether certain periods show meaningful differences in success rate, follow-through, MFE, or time to resolution. Weight findings by sample size; a high win rate in a thin time bucket is not evidence. Conclude whether all breakout times can be treated equally or whether certain periods warrant preference or avoidance. Do not finalize time filters yet.
Warning: All rights to these materials are reserved by MetaQuotes Ltd. Copying or reprinting of these materials in whole or in part is prohibited.
This article was written by a user of the site and reflects their personal views. MetaQuotes Ltd is not responsible for the accuracy of the information presented, nor for any consequences resulting from the use of the solutions, strategies or recommendations described.
 From Polling to Events: Building a Reactive MQL5 Trading System with Python and Redis Streams
 Archimedes Optimization Algorithm (AOA)
 Testing Random Walk vs Mean Reversion in MQL5: Implementing the Lo-MacKinlay Variance Ratio Test
 Andean Condor Algorithm (ACA)

- Free trading apps
- Over 8,000 signals for copying
- Economic news for exploring financial markets
You agree to website policy and terms of use