

Formulating Dynamic Multi-Pair EA (Part 10): Asymmetric Stop-Loss Logic Based on Pair-Specific Volatility Signatures
 1 944
1 944
 0
0

Table of contents
Introduction
Most traders who run a multi-pair system eventually hit the same wall. They set a fixed ATR multiplier, apply it across every symbol, and watch it fail in different ways on different pairs. The stop on XAUUSD gets hunted because gold moves in wide, violent swings. The stop on GBPUSD sits too far out and eats into reward. The exotic pair behaves nothing like either of them. A single multiplier cannot describe all of these markets at once. The trader either over-engineers a manual configuration for every symbol or accepts that some pairs will always be mis-sized.
This article solves the problem by having the EA analyze each pair before trading. It collects 1000 bars of history per symbol and builds a volatility signature. This statistical fingerprint captures noise, trend persistence, pullback depth, and range dispersion. A classification engine then labels each pair by its market personality. That label feeds a stop-loss optimization formula that produces a unique ATR multiplier per symbol automatically. Wide, erratic pairs receive a wider stop. Clean, trending pairs receive a tighter one. Lot sizing adjusts in the opposite direction so risk stays constant across the board. The entry signal—a MACD crossover filtered by an EMA trend gate—operates completely independently of this process.
System Overview
The EA is built around ten decoupled modules that each own a single responsibility. The Symbol Manager parses the input string and prepares one data context per pair. The Historical Data Collector loads 1000 bars of H1 data for every symbol independently—no pair borrows statistics from another. The Feature Extractor then works through that data and computes candle-level measurements: average range, body size, upper and lower wick, true range, close-to-close standard deviation, and gap frequency. These numbers flow into the Volatility Signature Builder, which condenses them into a single fingerprint per symbol. The Signature Classification Engine then reads that fingerprint and assigns labels for volatility regime, noise character, trend behavior, and momentum quality.
The Modular Intelligence Core
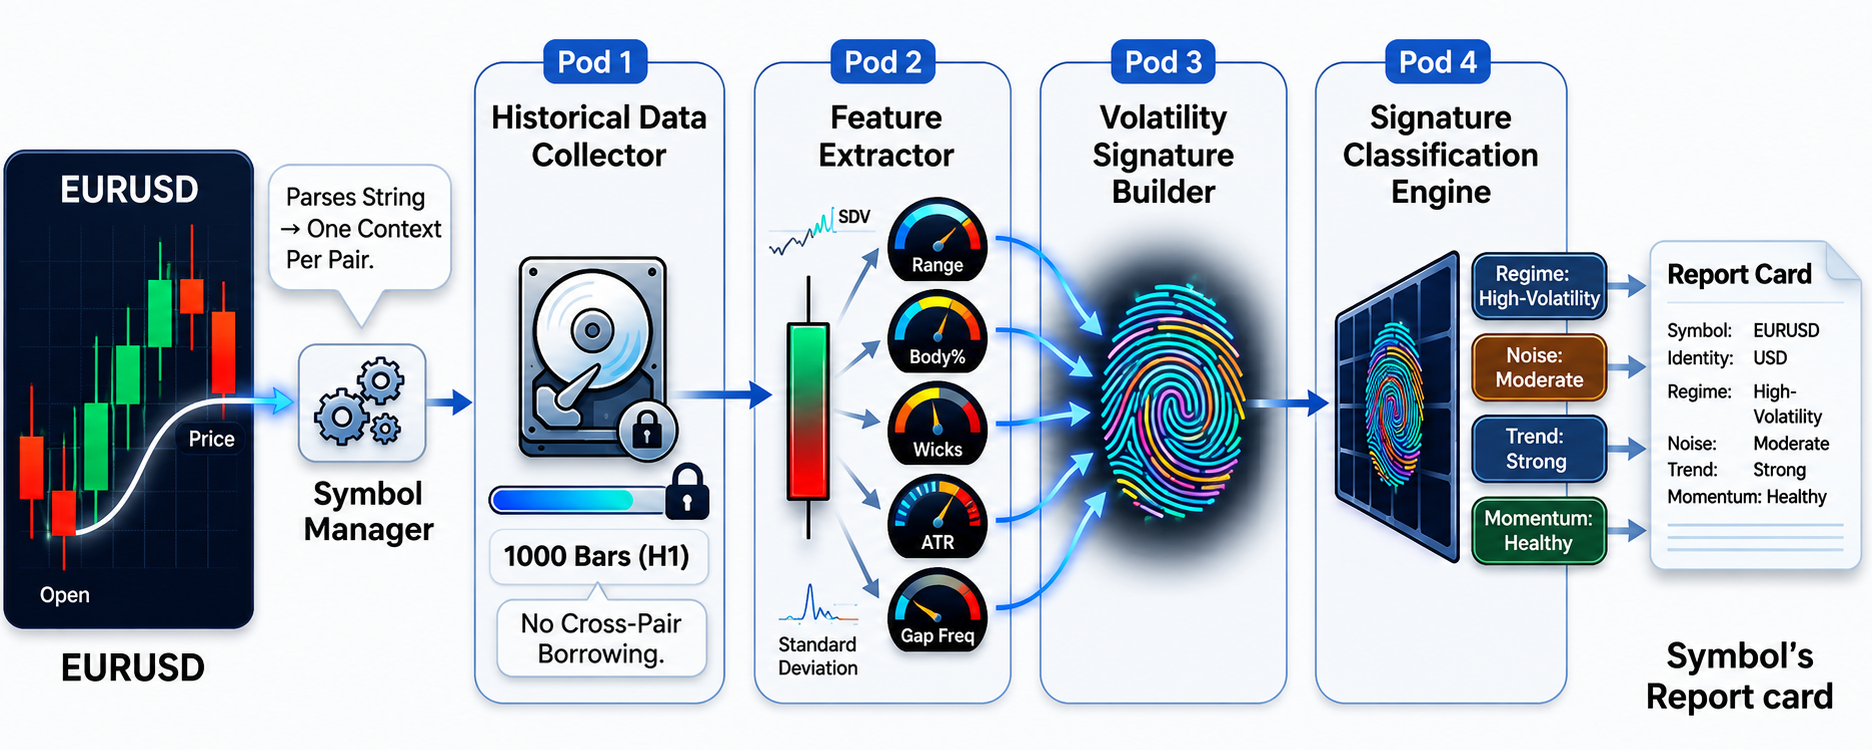
Each symbol is treated as a unique entity—no shared statistics, no generic assumptions. The pipeline dissects price behavior into a quantifiable fingerprint and classifies its trading personality before a single order is ever considered.
The labels feed the Stop-Loss Optimization Engine. It adjusts a base ATR multiplier using five factors: noise, pullback, trend, spread, and volatility dispersion. Each factor nudges the multiplier up or down depending on what the signature revealed about that pair. The final multiplier is clamped within user-defined bounds and multiplied against the current live ATR to produce a stop-loss distance in price. The Risk Management Module then inverts that distance against a fixed percentage of the account balance to size the lot. The Trade Engine sits entirely outside this process. It evaluates a MACD crossover against an EMA trend filter and simply requests a stop-loss distance when it needs one. The Visualization Module displays every signature and computed value on the chart so the trader can inspect what the system learned about each pair.
The Stop-Loss Alchemist and Trade Executor
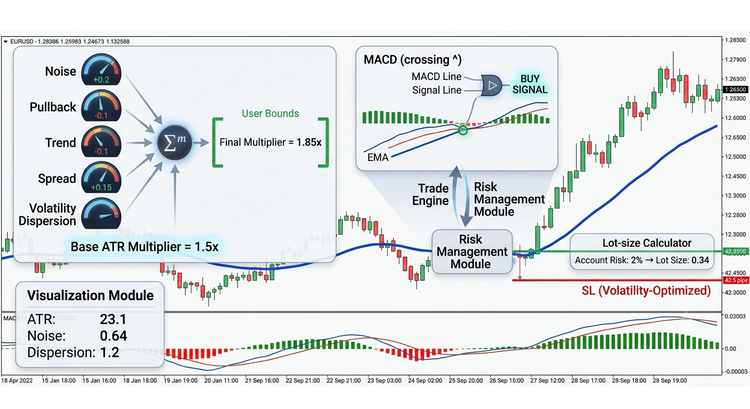
The Trade Engine simply requests a distance; the Risk Module then determines how that distance translates to position size, ensuring every order's stop is a unique product of that pair's specific behavior, not a fixed pip amount.
Getting Started
//+------------------------------------------------------------------+
//|                                                 AsymmetricSL.mq5 |
//|                                  Copyright 2025, MetaQuotes Ltd. |
//|                     https://www.mql5.com/en/users/johnhlomohang/ |
//+------------------------------------------------------------------+
#property copyright "Copyright 2025, MetaQuotes Ltd."
#property link      "https://www.mql5.com/en/users/johnhlomohang/"
#property version   "1.00"

#include <Trade\Trade.mqh>

//+------------------------------------------------------------------+
//| Inputs                                                           |
//+------------------------------------------------------------------+
input group "=== Symbols & Data (Modules 1-2) ==="
input string            InpSymbols        = "XAUUSD,GBPUSD,USDJPY,USDZAR"; // Symbols (comma separated)
input ENUM_TIMEFRAMES   InpTimeframe      = PERIOD_H1;   // Working timeframe
input int               InpHistoryBars    = 1000;        // Bars used to learn the signature
input int               InpUpdateBars     = 100;         // Re-learn signature every N bars

input group "=== Signal Strategy: MACD + EMA ==="
input int               InpEMAPeriod      = 200;         // EMA trend filter period
input int               InpMACDFast       = 12;          // MACD fast EMA
input int               InpMACDSlow      = 26;           // MACD slow EMA
input int               InpMACDSignal     = 9;           // MACD signal period
input bool              InpCloseOnOpposite= true;        // Close position on opposite signal

input group "=== Stop-Loss Engine (Module 6) ==="
input int               InpATRPeriod      = 14;          // ATR period (live SL base)
input double            InpBaseMultiplier = 1.5;         // Base ATR multiplier before factors
input double            InpMinMultiplier  = 1.0;         // Final multiplier floor
input double            InpMaxMultiplier  = 4.0;         // Final multiplier cap
input double            InpRewardRatio    = 1.5;         // TP = SL distance x this

input group "=== Risk Management (Module 7) ==="
input double            InpRiskPercent    = 1.0;         // Risk per trade (% of balance)
input long              InpMagic          = 20260717;    // Magic number

input group "=== Visualization (Module 10) ==="
input bool              InpShowDashboard  = true;        // Show signature dashboard
input int               InpDashX          = 10;          // Dashboard X offset
input int               InpDashY          = 20;          // Dashboard Y offset

//--- globals
SymbolContext  g_ctx[];
CTrade         g_trade;
const string   DASH_PREFIX = "ASLEA_";

//+------------------------------------------------------------------+
//| Classification enums (Module 5)                                  |
//+------------------------------------------------------------------+
enum ENUM_VOL_CLASS   { VOL_LOW, VOL_NORMAL, VOL_HIGH, VOL_EXTREME };
enum ENUM_NOISE_CLASS { NOISE_LOW, NOISE_MEDIUM, NOISE_HIGH };
enum ENUM_TREND_CLASS { TREND_PERSISTENT, TREND_MIXED, TREND_CHOPPY };
enum ENUM_MOMO_CLASS  { MOMO_STRONG, MOMO_WEAK };
To get started, we include the Trade.mqh library, which provides the trading functions needed to open, modify, and close positions. We then organize the EA inputs into separate groups to improve readability and make the system easier to configure. The first group defines the symbols that will be monitored, the working timeframe, the amount of historical data used to learn each symbol's volatility signature, and how often that signature should be updated. The second group contains the MACD and EMA parameters that generate the buy and sell signals. We also include an option to close an open position whenever an opposite trading signal is detected.
The remaining input groups define the risk management and visualization settings. We configure the ATR period together with the minimum, maximum, and base multipliers that the stop-loss engine will use to calculate adaptive stop-loss levels. We also specify the reward-to-risk ratio, the account risk per trade, and the magic number used to identify positions opened by the EA. Finally, we add dashboard settings that allow us to display the learned volatility information directly on the chart. The classification enumerations declared at the end of the code provide labels for volatility, market noise, trend behavior, and momentum strength.
//+------------------------------------------------------------------+
//| Expert initialization function                                   |
//+------------------------------------------------------------------+
int OnInit()
  {
   int total = ParseSymbols();
   if(total == 0)
     {
      Print("[Init] no valid symbols parsed from input.");
      return INIT_FAILED;
     }

   g_trade.SetExpertMagicNumber(InpMagic);
   g_trade.SetDeviationInPoints(20);

   /*--- First learning pass. Failures are tolerated here: history for
         non-chart symbols often needs a few seconds to synchronize, and
         ProcessSymbol() retries lazily. */
   for(int i = 0; i < total; i++)
     {
      if(InitSymbol(g_ctx[i]) && BuildSignature(g_ctx[i]))
        {
         ComputeRiskProfile(g_ctx[i]);
         g_ctx[i].initialized = true;
        }
     }

   EventSetTimer(2);   // drives non-chart symbols between chart ticks
   UpdateDashboard();

   PrintFormat("[Init] Asymmetric SL EA running on %d symbols, TF=%s, %d learning bars.",
               total, EnumToString(InpTimeframe), InpHistoryBars);
   return INIT_SUCCEEDED;
  }

//+------------------------------------------------------------------+
//| Expert deinitialization function                                 |
//+------------------------------------------------------------------+
void OnDeinit(const int reason)
  {
   EventKillTimer();
   for(int i = 0; i < ArraySize(g_ctx); i++)
     {
      if(g_ctx[i].atrHandle  != INVALID_HANDLE)
         IndicatorRelease(g_ctx[i].atrHandle);
      if(g_ctx[i].macdHandle != INVALID_HANDLE)
         IndicatorRelease(g_ctx[i].macdHandle);
      if(g_ctx[i].emaHandle  != INVALID_HANDLE)
         IndicatorRelease(g_ctx[i].emaHandle);
     }
   ObjectsDeleteAll(0, DASH_PREFIX);
   ChartRedraw();
  }

//+------------------------------------------------------------------+
//| Expert tick function                                             |
//+------------------------------------------------------------------+
void OnTick()
  {
   ProcessAll();
  }

//+------------------------------------------------------------------+
//| Timer processing                                                 |
//+------------------------------------------------------------------+
void OnTimer()
  {
   ProcessAll();
  }

//+------------------------------------------------------------------+
//|  ProcessAll                                                      |
//+------------------------------------------------------------------+
void ProcessAll()
  {
   for(int i = 0; i < ArraySize(g_ctx); i++)
      ProcessSymbol(g_ctx[i]);
   UpdateDashboard();
  }
The OnInit() function prepares the Expert Advisor for trading. We start by parsing the list of symbols entered by the user and immediately verify that at least one valid symbol has been found. If no valid symbols are available, the initialization stops to prevent the EA from running incorrectly. Next, we configure the trading object by assigning the magic number and the maximum allowed price deviation. We then perform the first learning pass for every symbol by initializing its indicators, building its volatility signature, and computing its risk profile. If a symbol is successfully prepared, we mark it as initialized so that it can participate in the trading process. Finally, we start a timer to process symbols that are not attached to the current chart, update the dashboard, and print a message confirming that the EA is ready.
The event functions manage the EA during execution. The OnDeinit() function performs cleanup by stopping the timer, releasing all indicator handles, removing the dashboard objects from the chart, and refreshing the display. Both OnTick() and OnTimer() call the ProcessAll() function, ensuring that every symbol is analyzed whether the current chart receives a market tick. Inside ProcessAll(), we loop through every symbol stored in the context array and call ProcessSymbol() to execute the trading logic independently for each one. Once all symbols have been processed, we refresh the dashboard so that the latest volatility signatures, risk profiles, and trading information remain visible on the chart.
//+------------------------------------------------------------------+
//| Volatility Signature (Module 4)                                  |
//+------------------------------------------------------------------+
struct VolatilitySignature
  {
   double            atr;              // statistical ATR (mean true range)
   double            stddev;           // std-dev of bar-to-bar close changes
   double            avgRange;         // mean(high - low)
   double            avgBody;          // mean(|close - open|)
   double            avgUpperWick;     // mean upper wick
   double            avgLowerWick;     // mean lower wick
   double            noiseRatio;       // avgBody / avgRange  (high = clean)
   double            trendPersistence; // average run length in bars
   double            avgPullback;      // average retracement magnitude (price)
   double            gapFrequency;     // gaps per 100 bars
   double            atrDispersion;    // CV of true range (volatility of volatility)
   double            relVolPct;        // atr / avgClose * 100
   ENUM_VOL_CLASS    volClass;
   ENUM_NOISE_CLASS  noiseClass;
   ENUM_TREND_CLASS  trendClass;
   ENUM_MOMO_CLASS   momoClass;
   datetime          lastUpdate;
  };

//+------------------------------------------------------------------+
//| Risk Profile (Modules 6-7)                                       |
//+------------------------------------------------------------------+
struct RiskProfile
  {
   double            noiseFactor;
   double            pullbackFactor;
   double            trendFactor;
   double            spreadFactor;
   double            volFactor;
   double            slMultiplier;     // final ATR multiplier
   double            slDistance;       // current SL distance in price
   double            lot;              // lot size for the current SL
  };

//+------------------------------------------------------------------+
//| Symbol Context (Module 1)                                        |
//+------------------------------------------------------------------+
struct SymbolContext
  {
   string            symbol;
   bool              initialized;
   int               atrHandle;
   int               macdHandle;
   int               emaHandle;
   datetime          lastBarTime;
   int               barsSinceUpdate;
   VolatilitySignature signature;
   RiskProfile       risk;
  };
The foundation of our adaptive risk management system begins with the VolatilitySignature structure, which stores the statistical characteristics of each trading instrument. Rather than relying only on ATR, we collect a wider range of measurements that describe how a market typically behaves. These include the average trading range, candle body size, upper and lower wick lengths, pullback magnitude, gap frequency, and the consistency of price movement over time. We also calculate additional metrics such as the noise ratio, relative volatility, and ATR dispersion to capture both the strength and stability of market activity. Together, these values create a unique volatility signature that represents the trading personality of every symbol.
Once the market behavior has been analyzed, we use the RiskProfile structure to transform that information into practical trading parameters. Each factor adjusts the stop-loss calculation according to a different aspect of the volatility signature. For example, markets with larger pullbacks or greater price noise can receive wider stop-loss distances, while smoother and more persistent trends may require less room. These adjustments are combined into a final ATR multiplier, which determines the stop-loss distance. The same information is then used to calculate the appropriate lot size so that every trade maintains a consistent level of account risk.
To manage multiple trading instruments efficiently, we introduce the SymbolContext structure as the central container for each symbol. This structure stores the symbol name, its initialization status, and the indicator handles required for ATR, MACD, and EMA calculations. It also keeps track of the latest processed bar and the number of bars since the volatility signature was last updated. Most importantly, it combines both the volatility signature and the risk profile into a single object. As a result, every symbol maintains its own independent state, allowing the Expert Advisor to analyze, manage, and trade multiple markets without mixing their data or calculations.
//+------------------------------------------------------------------+
//| Utility                                                          |
//+------------------------------------------------------------------+
double Clamp(const double v, const double lo, const double hi)
  {
   return MathMax(lo, MathMin(hi, v));
  }

//+------------------------------------------------------------------+
//|  Volume to String                                                |
//+------------------------------------------------------------------+
string VolClassToString(const ENUM_VOL_CLASS c)
  {
   switch(c)
     {
      case VOL_LOW:
         return "LOW";
      case VOL_NORMAL:
         return "NORMAL";
      case VOL_HIGH:
         return "HIGH";
      default:
         return "EXTREME";
     }
  }

//+------------------------------------------------------------------+
//|  Noise Class to String                                           |
//+------------------------------------------------------------------+
string NoiseClassToString(const ENUM_NOISE_CLASS c)
  {
   switch(c)
     {
      case NOISE_LOW:
         return "LOW";
      case NOISE_MEDIUM:
         return "MED";
      default:
         return "HIGH";
     }
  }

//+------------------------------------------------------------------+
//|  Trend Class to String                                                             |
//+------------------------------------------------------------------+
string TrendClassToString(const ENUM_TREND_CLASS c)
  {
   switch(c)
     {
      case TREND_PERSISTENT:
         return "PERSISTENT";
      case TREND_MIXED:
         return "MIXED";
      default:
         return "CHOPPY";
     }
  }
This section provides several utility functions that simplify calculations and improve the readability of the Expert Advisor. We begin with the Clamp() function, which ensures that a numerical value always remains within a specified minimum and maximum range. This is particularly useful when limiting values such as stop-loss multipliers or risk factors to prevent unrealistic calculations. The remaining functions convert the volatility, noise, and trend classifications from their enumeration values into descriptive text labels. Instead of displaying numeric constants, the EA can present meaningful values such as "LOW," "NORMAL," "HIGH," "PERSISTENT," or "CHOPPY" on the dashboard. This makes the volatility signatures easier to interpret while improving both debugging and the overall presentation of the system.
//+------------------------------------------------------------------+
//| Module 1 - Symbol Manager                                        |
//+------------------------------------------------------------------+
int ParseSymbols()
  {
   string parts[];
   int cnt = StringSplit(InpSymbols, ',', parts);
   if(cnt <= 0)
      return 0;

   ArrayResize(g_ctx, 0);

   for(int i = 0; i < cnt; i++)
     {
      string s = parts[i];
      StringTrimLeft(s);
      StringTrimRight(s);
      if(StringLen(s) == 0)
         continue;

      if(!SymbolSelect(s, true))
        {
         PrintFormat("[SymbolManager] '%s' is not available - skipped.", s);
         continue;
        }

      int n = ArraySize(g_ctx);
      ArrayResize(g_ctx, n + 1);
      g_ctx[n].symbol          = s;
      g_ctx[n].initialized     = false;
      g_ctx[n].atrHandle       = INVALID_HANDLE;
      g_ctx[n].macdHandle      = INVALID_HANDLE;
      g_ctx[n].emaHandle       = INVALID_HANDLE;
      g_ctx[n].lastBarTime     = 0;
      g_ctx[n].barsSinceUpdate = 0;
      ZeroMemory(g_ctx[n].signature);
      ZeroMemory(g_ctx[n].risk);
     }
   return ArraySize(g_ctx);
  }

//+------------------------------------------------------------------+
//| Create indicator handles for one symbol                          |
//+------------------------------------------------------------------+
bool InitSymbol(SymbolContext &ctx)
  {
   if(ctx.atrHandle == INVALID_HANDLE)
      ctx.atrHandle = iATR(ctx.symbol, InpTimeframe, InpATRPeriod);
   if(ctx.macdHandle == INVALID_HANDLE)
      ctx.macdHandle = iMACD(ctx.symbol, InpTimeframe, InpMACDFast, InpMACDSlow, InpMACDSignal, PRICE_CLOSE);
   if(ctx.emaHandle == INVALID_HANDLE)
      ctx.emaHandle = iMA(ctx.symbol, InpTimeframe, InpEMAPeriod, 0, MODE_EMA, PRICE_CLOSE);

   if(ctx.atrHandle == INVALID_HANDLE ||
      ctx.macdHandle == INVALID_HANDLE ||
      ctx.emaHandle == INVALID_HANDLE)
     {
      PrintFormat("[Init] handle creation failed for %s", ctx.symbol);
      return false;
     }
   return true;
  }
The Symbol Manager begins by parsing the comma-separated list of symbols provided by the user through the InpSymbols input. We split the string into individual symbol names, remove any unnecessary spaces, and ignore empty entries to ensure that only valid symbols are processed. Each symbol is then checked to confirm that it is available in the Market Watch window. If a symbol cannot be selected, it is skipped, and a message is printed to the log. For every valid symbol, we create a new SymbolContext object and initialize its variables, indicator handles, counters, volatility signature, and risk profile. This gives every trading instrument its own independent workspace, preventing data from being shared between symbols.
After the symbol contexts have been created, the InitSymbol() function prepares each one for analysis by creating the indicator handles required throughout the Expert Advisor. We create separate handles for the ATR, MACD, and EMA indicators using the symbol and timeframe stored in the corresponding context. These handles allow the EA to retrieve indicator values efficiently without repeatedly recreating the indicators during execution. Before continuing, we verify that all handles were created successfully. If any indicator fails to initialize, the function reports the problem and returns false; otherwise, it returns true, confirming that the symbol is ready for volatility analysis, signal generation, and risk management.
//+------------------------------------------------------------------+
//| Modules 2-5 - Collect history, classify volatility signature     |
//+------------------------------------------------------------------+
bool BuildSignature(SymbolContext &ctx)
  {
   MqlRates rates[];
   ArraySetAsSeries(rates, true);

   int copied = CopyRates(ctx.symbol, InpTimeframe, 0, InpHistoryBars, rates);
   if(copied < 500)
     {
      PrintFormat("[DataCollector] %s: only %d bars available, need at least 500. Retrying later.",
                  ctx.symbol, copied);
      return false;
     }

   int n = copied;

//--- Pass 1: basic candle statistics + true range
   double sumRange = 0, sumBody = 0, sumUpW = 0, sumLoW = 0;
   double sumTR = 0, sumTR2 = 0;
   double sumD = 0, sumD2 = 0;
   double sumClose = 0;
   int    statCount = 0;

   for(int i = 1; i <= n - 2; i++)   // skip forming bar 0
     {
      double o  = rates[i].open;
      double h  = rates[i].high;
      double l  = rates[i].low;
      double c  = rates[i].close;
      double pc = rates[i + 1].close;

      double range = h - l;
      double body  = MathAbs(c - o);
      double upW   = h - MathMax(o, c);
      double loW   = MathMin(o, c) - l;

      double tr = MathMax(range, MathMax(MathAbs(h - pc), MathAbs(l - pc)));
      double d  = c - pc;

      sumRange += range;
      sumBody  += body;
      sumUpW   += upW;
      sumLoW   += loW;
      sumTR    += tr;
      sumTR2   += tr * tr;
      sumD     += d;
      sumD2    += d * d;
      sumClose += c;
      statCount++;
     }

   if(statCount < 100)
      return false;

   double atr      = sumTR / statCount;
   double avgRange = sumRange / statCount;
   double avgBody  = sumBody / statCount;
   double avgClose = sumClose / statCount;

   double meanD  = sumD / statCount;
   double varD   = MathMax(0.0, sumD2 / statCount - meanD * meanD);
   double stddev = MathSqrt(varD);

   double meanTR = atr;
   double varTR  = MathMax(0.0, sumTR2 / statCount - meanTR * meanTR);
   double trCV   = (meanTR > 0.0) ? MathSqrt(varTR) / meanTR : 0.0;

//--- Pass 2: gaps (needs ATR from pass 1)
   int gapCount = 0;
   for(int i = 1; i <= n - 2; i++)
     {
      double gap = MathAbs(rates[i].open - rates[i + 1].close);
      if(gap > 0.30 * atr)
         gapCount++;
     }

   /*--- Pass 3: run analysis, oldest -> newest
         trend persistence = average run length
         pullback = magnitude of the counter-run following an impulse*/
   int    dir = 0, runLen = 0;
   double runMag = 0;
   double sumRunLen = 0;
   int    runCount = 0;
   double sumPull = 0;
   int    pullCount = 0;
   double prevRunMag = 0;
   int    prevRunLen = 0;

   for(int i = n - 2; i >= 1; i--)   // oldest usable bar first
     {
      double d = rates[i].close - rates[i + 1].close;
      int s = (d > 0.0) ? 1 : ((d < 0.0) ? -1 : 0);
      if(s == 0)
         continue;

      if(s == dir)
        {
         runLen++;
         runMag += MathAbs(d);
        }
      else
        {
         if(dir != 0)
           {
            sumRunLen += runLen;
            runCount++;
            //--- the run that just ended is a pullback if it follows a
            //--- longer impulse and retraces less than the impulse moved
            if(prevRunLen >= 2 && runMag < prevRunMag)
              {
               sumPull += runMag;
               pullCount++;
              }
            prevRunMag = runMag;
            prevRunLen = runLen;
           }
         dir    = s;
         runLen = 1;
         runMag = MathAbs(d);
        }
     }

   double persistence = (runCount > 0) ? sumRunLen / runCount : 1.0;
   double avgPullback = (pullCount > 0) ? sumPull / pullCount : atr;

//--- Fill the signature (Module 4)
   VolatilitySignature sig;
   ZeroMemory(sig);
   sig.atr              = atr;
   sig.stddev           = stddev;
   sig.avgRange         = avgRange;
   sig.avgBody          = avgBody;
   sig.avgUpperWick     = sumUpW / statCount;
   sig.avgLowerWick     = sumLoW / statCount;
   sig.noiseRatio       = (avgRange > 0.0) ? avgBody / avgRange : 0.5;
   sig.trendPersistence = persistence;
   sig.avgPullback      = avgPullback;
   sig.gapFrequency     = 100.0 * gapCount / statCount;
   sig.atrDispersion    = trCV;
   sig.relVolPct        = (avgClose > 0.0) ? 100.0 * atr / avgClose : 0.0;
   sig.lastUpdate       = TimeCurrent();

//--- Classify (Module 5)
   if(sig.relVolPct < 0.10)
      sig.volClass = VOL_LOW;
   else
      if(sig.relVolPct < 0.30)
         sig.volClass = VOL_NORMAL;
      else
         if(sig.relVolPct < 0.70)
            sig.volClass = VOL_HIGH;
         else
            sig.volClass = VOL_EXTREME;

   if(sig.noiseRatio >= 0.55)
      sig.noiseClass = NOISE_LOW;     // clean bodies
   else
      if(sig.noiseRatio >= 0.40)
         sig.noiseClass = NOISE_MEDIUM;
      else
         sig.noiseClass = NOISE_HIGH;    // wick-dominated

   if(persistence >= 2.2)
      sig.trendClass = TREND_PERSISTENT;
   else
      if(persistence >= 1.8)
         sig.trendClass = TREND_MIXED;
      else
         sig.trendClass = TREND_CHOPPY;

   sig.momoClass = (persistence >= 2.0 && sig.noiseRatio >= 0.45)
                   ? MOMO_STRONG : MOMO_WEAK;

   ctx.signature       = sig;
   ctx.barsSinceUpdate = 0;

   PrintFormat("[Signature] %s | ATR=%s relVol=%.2f%% noise=%.2f persist=%.2f pullback/ATR=%.2f gaps=%.1f/100 trCV=%.2f",
               ctx.symbol,
               DoubleToString(atr, (int)SymbolInfoInteger(ctx.symbol, SYMBOL_DIGITS)),
               sig.relVolPct, sig.noiseRatio, persistence,
               (atr > 0 ? avgPullback / atr : 0.0), sig.gapFrequency, trCV);
   return true;
  }
The BuildSignature() function learns each instrument's statistical behavior from historical price data. We begin by loading the required number of price bars and verifying that enough history is available to perform a reliable analysis. Once sufficient data has been collected, the function performs several passes over the historical candles to extract important market characteristics. During the first pass, we calculate measurements such as the average trading range, candle body size, upper and lower wick lengths, true range, standard deviation of price changes, and average closing price. The second pass focuses on identifying price gaps by comparing the opening price of each candle with the previous closing price. Finally, the third pass studies the sequence of price movements to determine how long trends typically persist and how large the average pullbacks are after strong directional moves. These statistics provide a much richer description of market behavior than a single ATR value alone.
After collecting the statistical measurements, we assemble them into a VolatilitySignature object that represents the unique characteristics of the current symbol. Each calculated metric is assigned to its corresponding field, including volatility, noise, pullback size, trend persistence, gap frequency, ATR dispersion, and relative volatility. We then classify these numerical values into meaningful categories such as low or extreme volatility, low or high market noise, persistent or choppy trends, and strong or weak momentum. These classifications transform raw market data into an interpretable volatility profile that can later guide the stop-loss optimization process. Before the function finishes, the completed signature is stored inside the symbol's context, the update counter is reset, and a summary of the learned statistics is printed to the Experts log for monitoring and debugging purposes.
//+------------------------------------------------------------------+
//| Current ATR from the live handle (closed bar)                    |
//+------------------------------------------------------------------+
double CurrentATR(SymbolContext &ctx)
  {
   double buf[1];
   if(CopyBuffer(ctx.atrHandle, 0, 1, 1, buf) != 1)
      return 0.0;
   return buf[0];
  }

//+------------------------------------------------------------------+
//| Module 6 - Stop-Loss Optimization Engine                         |
//+------------------------------------------------------------------+
void ComputeRiskProfile(SymbolContext &ctx)
  {
   VolatilitySignature sig = ctx.signature;
   RiskProfile rp;
   ZeroMemory(rp);

   double atr = sig.atr;
   if(atr <= 0.0)
     {
      ctx.risk = rp;
      return;
     }

   double ask    = SymbolInfoDouble(ctx.symbol, SYMBOL_ASK);
   double bid    = SymbolInfoDouble(ctx.symbol, SYMBOL_BID);
   double spread = MathMax(0.0, ask - bid);

//--- Wick-dominated pairs need breathing room, clean pairs do not.
   rp.noiseFactor    = Clamp(0.80 + (1.0 - sig.noiseRatio) * 0.80, 0.80, 1.50);

//--- Deep average retracements relative to ATR push the SL wider.
   rp.pullbackFactor = Clamp(0.60 + 0.35 * (sig.avgPullback / atr), 0.70, 1.50);

//--- Persistent trends allow tighter stops; choppy structure does not.
   rp.trendFactor    = (sig.trendClass == TREND_PERSISTENT) ? 0.85 :
                       (sig.trendClass == TREND_CHOPPY)     ? 1.20 : 1.00;

//--- Wide-spread symbols (exotics) get a spread cushion.
   rp.spreadFactor   = Clamp(1.0 + 2.0 * (atr > 0 ? spread / atr : 0.0), 1.00, 1.30);

//--- Unstable volatility (high CV of TR) demands extra margin.
   rp.volFactor      = Clamp(0.90 + 0.40 * sig.atrDispersion, 0.90, 1.40);

   rp.slMultiplier = Clamp(InpBaseMultiplier *
                           rp.noiseFactor *
                           rp.pullbackFactor *
                           rp.trendFactor *
                           rp.spreadFactor *
                           rp.volFactor,
                           InpMinMultiplier, InpMaxMultiplier);

   /*--- Live SL distance uses the current ATR, not the historical mean,
      so the distance adapts intrabar-regime while the multiplier is
      the slow-moving "personality" component.*/
   double liveATR = CurrentATR(ctx);
   if(liveATR <= 0.0)
      liveATR = atr;

   double dist = liveATR * rp.slMultiplier;

//--- Broker constraints
   double point    = SymbolInfoDouble(ctx.symbol, SYMBOL_POINT);
   long   stopsLvl = SymbolInfoInteger(ctx.symbol, SYMBOL_TRADE_STOPS_LEVEL);
   double minDist  = (stopsLvl + 1) * point + spread;
   if(dist < minDist)
      dist = minDist;

   rp.slDistance = dist;
   rp.lot        = CalcLot(ctx.symbol, dist);

   ctx.risk = rp;
  }

//+------------------------------------------------------------------+
//| Module 7 - Risk Management: constant money risk per pair         |
//+------------------------------------------------------------------+
double CalcLot(const string symbol, const double slDistance)
  {
   if(slDistance <= 0.0)
      return 0.0;

   double riskMoney = AccountInfoDouble(ACCOUNT_BALANCE) * InpRiskPercent / 100.0;

   double tickValue = SymbolInfoDouble(symbol, SYMBOL_TRADE_TICK_VALUE);
   double tickSize  = SymbolInfoDouble(symbol, SYMBOL_TRADE_TICK_SIZE);
   if(tickValue <= 0.0 || tickSize <= 0.0)
      return 0.0;

   double lossPerLot = slDistance / tickSize * tickValue;
   if(lossPerLot <= 0.0)
      return 0.0;

   double lot = riskMoney / lossPerLot;

   double step   = SymbolInfoDouble(symbol, SYMBOL_VOLUME_STEP);
   double minLot = SymbolInfoDouble(symbol, SYMBOL_VOLUME_MIN);
   double maxLot = SymbolInfoDouble(symbol, SYMBOL_VOLUME_MAX);
   if(step > 0.0)
      lot = MathFloor(lot / step) * step;
   lot = Clamp(lot, minLot, maxLot);
   return lot;
  }
The CurrentATR() function retrieves the latest ATR value from the closed candle by reading the ATR indicator buffer associated with the current symbol. This live ATR serves as the foundation for the Stop-Loss Optimization Engine, where we convert the previously learned volatility signature into a practical risk profile. We begin by extracting the symbol's statistical characteristics and verifying that a valid ATR value is available. The function then calculates several adjustment factors based on market behavior. Symbols with larger wicks receive a wider stop-loss through the noise factor, while those with deeper pullbacks receive additional room through the pullback factor. The trend factor tightens stop-losses in persistent trends and widens them in choppy markets. We also account for spread size and volatility dispersion to ensure that the stop-loss adapts to both trading costs and changing market conditions. These factors are combined with the base ATR multiplier to produce a final stop-loss multiplier that remains within the user-defined minimum and maximum limits.
Once the multiplier is determined, the stop-loss distance is calculated from the current ATR, not the historical average. This lets the EA react to recent conditions while preserving each symbol's long-term volatility profile. We also verify that the calculated distance satisfies the broker's minimum stop-level requirements before storing it in the risk profile. The CalcLot() function then determines the appropriate trading volume by applying a constant percentage risk to the account balance. It estimates the potential loss per lot using the stop-loss distance together with the symbol's tick value and tick size, ensuring that every trade risks approximately the same amount of money regardless of the instrument being traded. Finally, the calculated lot size is adjusted to comply with the broker's minimum, maximum, and volume step requirements before being stored for trade execution.
//+------------------------------------------------------------------+
//| Module 9 interface - the strategy only asks for a stop loss      |
//+------------------------------------------------------------------+
double GetStopLoss(SymbolContext &ctx)
  {
   return ctx.risk.slDistance;
  }

//+------------------------------------------------------------------+
//| Signal engine: MACD cross + EMA filter (evaluated on closed bars)|
//+------------------------------------------------------------------+
int Signal(SymbolContext &ctx)
  {
   double macdMain[], macdSig[], ema[];
   ArraySetAsSeries(macdMain, true);
   ArraySetAsSeries(macdSig, true);
   ArraySetAsSeries(ema, true);

   if(CopyBuffer(ctx.macdHandle, 0, 1, 2, macdMain) != 2)
      return 0;
   if(CopyBuffer(ctx.macdHandle, 1, 1, 2, macdSig)  != 2)
      return 0;
   if(CopyBuffer(ctx.emaHandle,  0, 1, 1, ema)      != 1)
      return 0;

   double close1 = iClose(ctx.symbol, InpTimeframe, 1);
   if(close1 <= 0.0)
      return 0;

   bool crossUp   = (macdMain[0] > macdSig[0]) && (macdMain[1] <= macdSig[1]);
   bool crossDown = (macdMain[0] < macdSig[0]) && (macdMain[1] >= macdSig[1]);

   if(crossUp && close1 > ema[0])
      return 1;
   if(crossDown && close1 < ema[0])
      return -1;
   return 0;
  }

//+------------------------------------------------------------------+
//| Position helpers                                                 |
//+------------------------------------------------------------------+
int PositionDirection(const string symbol)
  {
//--- returns: 0 = no position, 1 = long, -1 = short
   for(int i = PositionsTotal() - 1; i >= 0; i--)
     {
      string posSym = PositionGetSymbol(i);
      if(posSym != symbol)
         continue;
      if(PositionGetInteger(POSITION_MAGIC) != InpMagic)
         continue;
      return (PositionGetInteger(POSITION_TYPE) == POSITION_TYPE_BUY) ? 1 : -1;
     }
   return 0;
  }

bool ClosePosition(const string symbol)
  {
   return g_trade.PositionClose(symbol);
  }
This section forms the interface between the trading strategy and the risk management system. The GetStopLoss() function provides the stop-loss distance calculated by the risk engine, allowing the trading strategy to use it without knowing how it was derived. The Signal() function then evaluates the MACD and EMA indicators using only closed candles to avoid false signals from an unfinished bar. A buy signal is generated when the MACD line crosses above the signal line and the closing price is above the EMA, while a sell signal is generated when the opposite conditions occur. If neither condition is satisfied, the function returns no trading signal. Finally, the position helper functions manage existing trades by checking whether a buy or sell position is already open for the current symbol and magic number, and by providing a simple method for closing that position whenever the trading logic requires it.
//+------------------------------------------------------------------+
//| Open a trade with the signature-derived SL                       |
//+------------------------------------------------------------------+
void OpenTrade(SymbolContext &ctx, const int dir)
  {
   double dist = GetStopLoss(ctx);
   double lot  = ctx.risk.lot;
   if(dist <= 0.0 || lot <= 0.0)
     {
      PrintFormat("[Trade] %s: invalid SL distance (%.5f) or lot (%.2f) - skipped.",
                  ctx.symbol, dist, lot);
      return;
     }

   int    digits = (int)SymbolInfoInteger(ctx.symbol, SYMBOL_DIGITS);
   double ask    = SymbolInfoDouble(ctx.symbol, SYMBOL_ASK);
   double bid    = SymbolInfoDouble(ctx.symbol, SYMBOL_BID);

   double sl, tp;
   bool ok = false;

   if(dir > 0)
     {
      sl = NormalizeDouble(ask - dist, digits);
      tp = NormalizeDouble(ask + dist * InpRewardRatio, digits);
      ok = g_trade.Buy(lot, ctx.symbol, 0.0, sl, tp,
                       "ASL " + DoubleToString(ctx.risk.slMultiplier, 2) + "xATR");
     }
   else
     {
      sl = NormalizeDouble(bid + dist, digits);
      tp = NormalizeDouble(bid - dist * InpRewardRatio, digits);
      ok = g_trade.Sell(lot, ctx.symbol, 0.0, sl, tp,
                        "ASL " + DoubleToString(ctx.risk.slMultiplier, 2) + "xATR");
     }

   if(!ok)
      PrintFormat("[Trade] %s: order failed, retcode=%d (%s)",
                  ctx.symbol, g_trade.ResultRetcode(), g_trade.ResultRetcodeDescription());
   else
      PrintFormat("[Trade] %s %s lot=%.2f SL dist=%s (mult %.2f) risk=%.1f%%",
                  ctx.symbol, (dir > 0 ? "BUY" : "SELL"), lot,
                  DoubleToString(dist, digits), ctx.risk.slMultiplier, InpRiskPercent);
  }

//+------------------------------------------------------------------+
//| Per-symbol processing: new bar -> adapt -> signal -> execute     |
//+------------------------------------------------------------------+
void ProcessSymbol(SymbolContext &ctx)
  {
//--- lazy initialization (history may not be ready at OnInit)
   if(!ctx.initialized)
     {
      if(!InitSymbol(ctx))
         return;
      if(!BuildSignature(ctx))
         return;
      ComputeRiskProfile(ctx);
      ctx.initialized = true;
     }

//--- new bar detection per symbol
   datetime t = iTime(ctx.symbol, InpTimeframe, 0);
   if(t == 0 || t == ctx.lastBarTime)
      return;
   ctx.lastBarTime = t;
   ctx.barsSinceUpdate++;

//--- Module 8: live adaptation of the signature
   if(ctx.barsSinceUpdate >= InpUpdateBars)
      BuildSignature(ctx);

//--- refresh factors, SL distance and lot on every bar
   ComputeRiskProfile(ctx);

//--- Module 9: trade engine
   int sig = Signal(ctx);
   if(sig == 0)
      return;

   int posDir = PositionDirection(ctx.symbol);

   if(posDir == sig)
      return;                       // already positioned with the signal

   if(posDir != 0)
     {
      if(!InpCloseOnOpposite)
         return;
      if(!ClosePosition(ctx.symbol))
         return;
     }

   OpenTrade(ctx, sig);
  }
The OpenTrade() function is responsible for executing trades using the adaptive stop-loss generated by the volatility signature. We begin by retrieving the recommended stop-loss distance and the calculated lot size from the risk profile, ensuring that both values are valid before placing an order. The function then reads the current market prices and computes the stop-loss and take-profit levels according to the trade direction. For buy orders, the stop-loss is placed below the ask price, and the take-profit is positioned above it. For sell orders, the opposite approach is used. Each order also includes a comment showing the ATR multiplier that produced the stop-loss, making it easier to identify how the trade was managed. Once the order has been sent, the function reports either the execution details or the broker's error message if the trade fails.
The ProcessSymbol() function is the per-symbol workflow and runs whenever the EA processes that symbol. It first performs a lazy initialization if the symbol has not yet been prepared, allowing the EA to wait until sufficient historical data becomes available. The function then detects the arrival of a new bar and periodically rebuilds the volatility signature after a specified number of bars so that the symbol's statistical profile remains up to date. On every new bar, the risk profile is recalculated to reflect current market conditions before the MACD and EMA strategy generates a trading signal. The function also checks whether a position already exists in the same direction or whether an opposite trade should be closed before opening a new one. This sequence ensures that every trading decision is based on the latest market analysis while maintaining consistent risk management across all monitored symbols.
//+------------------------------------------------------------------+
//| Module 10 - Visualization                                        |
//+------------------------------------------------------------------+
void CreateLabel(const string name, const int x, const int y,
                 const string text, const color clr)
  {
   if(ObjectFind(0, name) < 0)
     {
      ObjectCreate(0, name, OBJ_LABEL, 0, 0, 0);
      ObjectSetInteger(0, name, OBJPROP_CORNER, CORNER_LEFT_UPPER);
      ObjectSetInteger(0, name, OBJPROP_FONTSIZE, 9);
      ObjectSetString(0, name, OBJPROP_FONT, "Courier New");
      ObjectSetInteger(0, name, OBJPROP_SELECTABLE, false);
      ObjectSetInteger(0, name, OBJPROP_HIDDEN, true);
      ObjectSetInteger(0, name, OBJPROP_BACK, false);
     }
   ObjectSetInteger(0, name, OBJPROP_XDISTANCE, x);
   ObjectSetInteger(0, name, OBJPROP_YDISTANCE, y);
   ObjectSetString(0, name, OBJPROP_TEXT, text);
   ObjectSetInteger(0, name, OBJPROP_COLOR, clr);
  }

//+------------------------------------------------------------------+
//|                                                                  |
//+------------------------------------------------------------------+
void UpdateDashboard()
  {
   if(!InpShowDashboard)
      return;

   int total = ArraySize(g_ctx);
   int rowH  = 16;

//--- background panel
   string bg = DASH_PREFIX + "BG";
   if(ObjectFind(0, bg) < 0)
     {
      ObjectCreate(0, bg, OBJ_RECTANGLE_LABEL, 0, 0, 0);
      ObjectSetInteger(0, bg, OBJPROP_CORNER, CORNER_LEFT_UPPER);
      ObjectSetInteger(0, bg, OBJPROP_BGCOLOR, C'20,20,28');
      ObjectSetInteger(0, bg, OBJPROP_BORDER_TYPE, BORDER_FLAT);
      ObjectSetInteger(0, bg, OBJPROP_COLOR, clrDimGray);
      ObjectSetInteger(0, bg, OBJPROP_SELECTABLE, false);
      ObjectSetInteger(0, bg, OBJPROP_HIDDEN, true);
      ObjectSetInteger(0, bg, OBJPROP_BACK, false);
     }
   ObjectSetInteger(0, bg, OBJPROP_XDISTANCE, InpDashX - 5);
   ObjectSetInteger(0, bg, OBJPROP_YDISTANCE, InpDashY - 5);
   ObjectSetInteger(0, bg, OBJPROP_XSIZE, 690);
   ObjectSetInteger(0, bg, OBJPROP_YSIZE, rowH * (total + 2) + 10);

//--- title + header
   CreateLabel(DASH_PREFIX + "TITLE", InpDashX, InpDashY,
               "ASYMMETRIC SL ENGINE - learned volatility signatures", clrGold);

   CreateLabel(DASH_PREFIX + "HDR", InpDashX, InpDashY + rowH,
               StringFormat("%-9s %10s %-8s %-5s %-10s %6s %9s %8s",
                            "SYMBOL", "ATR", "VOL", "NOISE", "TREND",
                            "MULT", "SL(pts)", "LOT"),
               clrSilver);

//--- one row per symbol
   for(int i = 0; i < total; i++)
     {
      string name = DASH_PREFIX + "ROW" + IntegerToString(i);
      int y = InpDashY + rowH * (i + 2);

      if(!g_ctx[i].initialized)
        {
         CreateLabel(name, InpDashX, y,
                     StringFormat("%-9s waiting for data...", g_ctx[i].symbol),
                     clrGray);
         continue;
        }

      double point  = SymbolInfoDouble(g_ctx[i].symbol, SYMBOL_POINT);
      int    digits = (int)SymbolInfoInteger(g_ctx[i].symbol, SYMBOL_DIGITS);
      long   slPts  = (point > 0.0) ? (long)MathRound(g_ctx[i].risk.slDistance / point) : 0;

      string row = StringFormat("%-9s %10s %-8s %-5s %-10s %6.2f %9d %8.2f",
                                g_ctx[i].symbol,
                                DoubleToString(g_ctx[i].signature.atr, digits),
                                VolClassToString(g_ctx[i].signature.volClass),
                                NoiseClassToString(g_ctx[i].signature.noiseClass),
                                TrendClassToString(g_ctx[i].signature.trendClass),
                                g_ctx[i].risk.slMultiplier,
                                slPts,
                                g_ctx[i].risk.lot);

      color clr = clrWhite;
      if(g_ctx[i].signature.volClass == VOL_EXTREME)
         clr = clrOrangeRed;
      else
         if(g_ctx[i].signature.volClass == VOL_HIGH)
            clr = clrOrange;
         else
            if(g_ctx[i].signature.volClass == VOL_LOW)
               clr = clrLightGreen;

      CreateLabel(name, InpDashX, y, row, clr);
     }
   ChartRedraw();
  }
//+------------------------------------------------------------------+
The visualization module provides a dashboard that allows us to monitor the state of every trading instrument directly from the chart. The CreateLabel() function serves as a reusable helper for creating and updating text labels without repeatedly writing the same object management code. When a label does not already exist, the function creates it and applies a consistent appearance by setting its position, font, size, color, and display properties. If the label already exists, only its position, text, and color are updated. This approach keeps the dashboard organized while reducing unnecessary object creation during the EA's execution.
The UpdateDashboard() function refreshes the information displayed on the chart whenever the EA processes its symbols. It first checks whether the dashboard is enabled before creating a background panel, a descriptive title, and column headings that summarize the information being presented. The function then loops through every symbol stored in the context array and displays its learned volatility signature, including the ATR value, volatility class, noise level, trend classification, stop-loss multiplier, calculated stop-loss distance, and recommended lot size. Symbols that have not yet completed their initialization are marked as waiting for data, while active symbols are color-coded according to their volatility classification to make important market conditions easier to identify. Finally, the chart is refreshed so that the dashboard always reflects the most recent analysis performed by the Expert Advisor.
Backtest
The backtest was conducted across roughly a two-month testing window from 17 May 2026 to 18 July 2026, with the following settings:
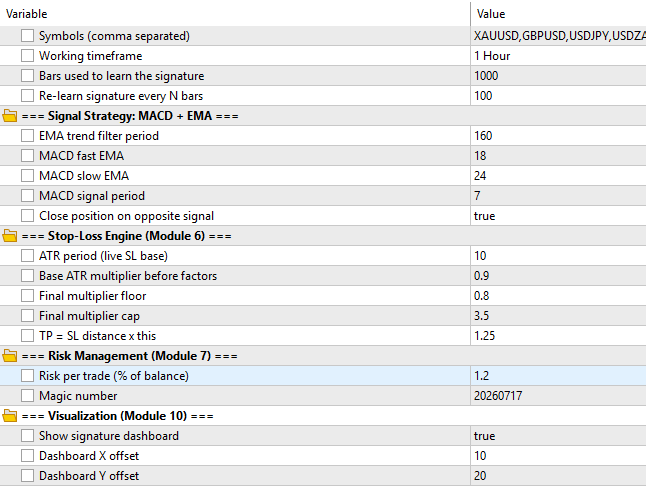
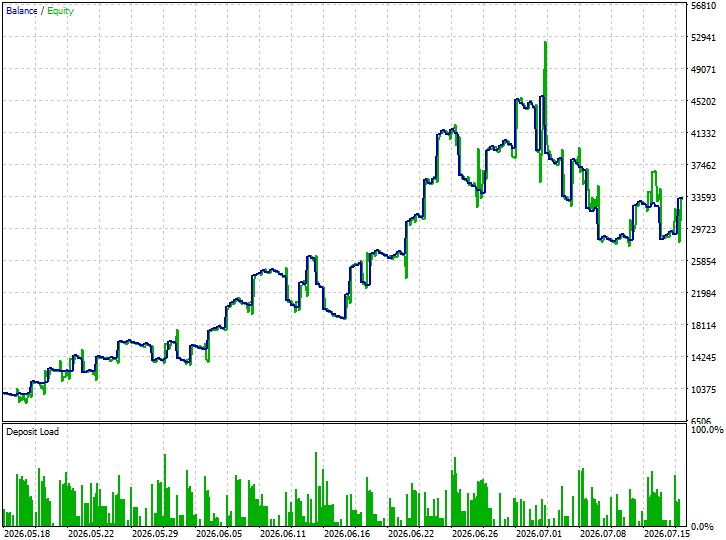
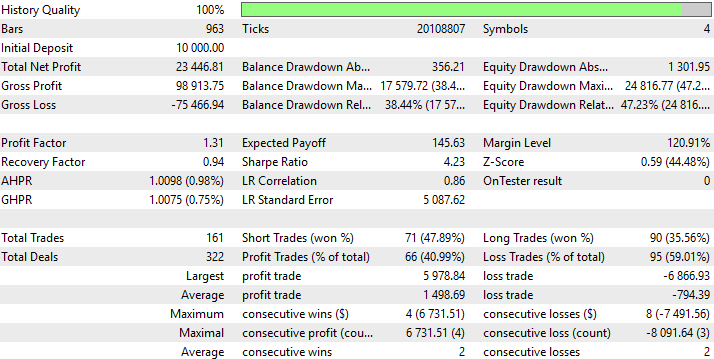
Below are the equity curve and the backtest results:
Conclusion
This article walked through the construction of a ten-module Expert Advisor that treats every symbol as a unique market rather than a generic price series. We collected deep historical data per pair, extracted candle-level statistics, and condensed them into a volatility signature. That signature passed through a classification engine and then into a stop-loss optimization formula built from five independent factors. The resulting multiplier was unique to each symbol and updated automatically on a rolling schedule. Lot sizing kept monetary risk constant regardless of how wide or narrow the stop landed. A MACD crossover filtered by an EMA trend gate drove the entries, operating as a clean layer that never interfered with the risk engine beneath it.
The key takeaway from this material is a framework that removes the guesswork from multi-pair stop placement. There is no longer a need to manually tune a multiplier for each symbol or accept a one-size-fits-all compromise. The system self-calibrates, adapts to regime shifts, and keeps risk consistent across instruments with very different characters. More importantly, the architecture itself is reusable. The signal layer can be swapped out entirely while the volatility engine underneath continues working without modification. Any trader who has struggled to manage a diverse portfolio of pairs now has a structured, mechanical approach to let the market define its own risk parameters.
Warning: All rights to these materials are reserved by MetaQuotes Ltd. Copying or reprinting of these materials in whole or in part is prohibited.
This article was written by a user of the site and reflects their personal views. MetaQuotes Ltd is not responsible for the accuracy of the information presented, nor for any consequences resulting from the use of the solutions, strategies or recommendations described.

 Trading Options Without Options (Part 3): Complex Option Strategies
 Price Action Analysis Toolkit Development (Part 76): One-Click Symbol Dashboard for Centralized Multi-Chart Management in MQL5
 Crow Search Algorithm (CSA)
 Automating Classic Market Methods in MQL5 (Part 5): The Original Turtle Trading Rules

- Free trading apps
- Over 8,000 signals for copying
- Economic news for exploring financial markets
You agree to website policy and terms of use