

Decoding Market Intent: Reading Structure, Liquidity, and Price Behavior
 2 105
2 105
 1
1

Table of Contents
- Introduction
- System Overview
- Getting Started
- Inputs
- The data structures
- Stage one: the market structure engine
- Protected highs and lows
- Stage two: the liquidity engine
- Liquidity sweeps properly defined
- Stage three: the price behavior engine
- Fair value gaps as graded objects
- Stage four: intent scoring
- Stage five: the decision engine and trade plan
- The visual layer
- Execution and risk
- Backtest and Demo
- Conclusion
Introduction
Anyone who has spent a season trading structure and liquidity knows the specific frustration this article addresses. We open a chart, we load an indicator that promises Smart Money analysis, and within seconds the chart is buried. There are break-of-structure labels on every minor swing. There are fair value gaps stacked four deep. There are liquidity lines running through every old high. Every one of those objects is technically correct, and together they say nothing. We are left doing the entire job by hand anyway, because the tool told us what happened without ever telling us what it meant. Worse, the labels tend to appear in hindsight. A swing high is printed only after the market has already moved past it, so the chart we study on Sunday is not the chart we could have traded on Tuesday.
The problem is not that these concepts are wrong. Structure, liquidity, and displacement are genuinely useful ways to read a market. The problem is that most implementations stop at annotation. They detect a pattern and draw it. They never take the next step, which is to weigh what was detected against everything else that is true at the same moment, and then commit to a position on what the market is likely doing. That step is the difference between a chart decoration and a decision system. In this article we build that step. We define market intently operationally as a directional hypothesis inferred from observable changes in structure, liquidity interaction, and price behavior. We compute it as a number we can act on or ignore.
Our solution is to decode market intent. We do that by running a five-stage pipeline over four timeframes, which produces a single Market Intent Score between zero and one hundred, and reduces that score to one of five decision states. When AutoTrade is switched off, it behaves as a decision-support indicator with a compact dashboard and a few meaningful chart objects. When AutoTrade is switched on, the same analysis drives entries, stops, targets, and position sizing. Nothing changes between the two modes except whether orders are sent. That single property matters more than anything else in the design, because it means the chart we study is the chart the machine trades.
System Overview
The engine is built as a pipeline, and each stage answers exactly one question. Stage one asks where the market is in structural terms. Stage two asks where orders are likely clustered. Stage three asks what price actually did when it got there. Stage four asks what all of that implies. Stage five asks what we should do about it. Data flows one way, and no stage is allowed to reach back and rewrite an earlier one. This is deliberate. A great many discretionary systems fail because the trader decides on a direction first and then interprets structure to support it. A pipeline cannot do that.
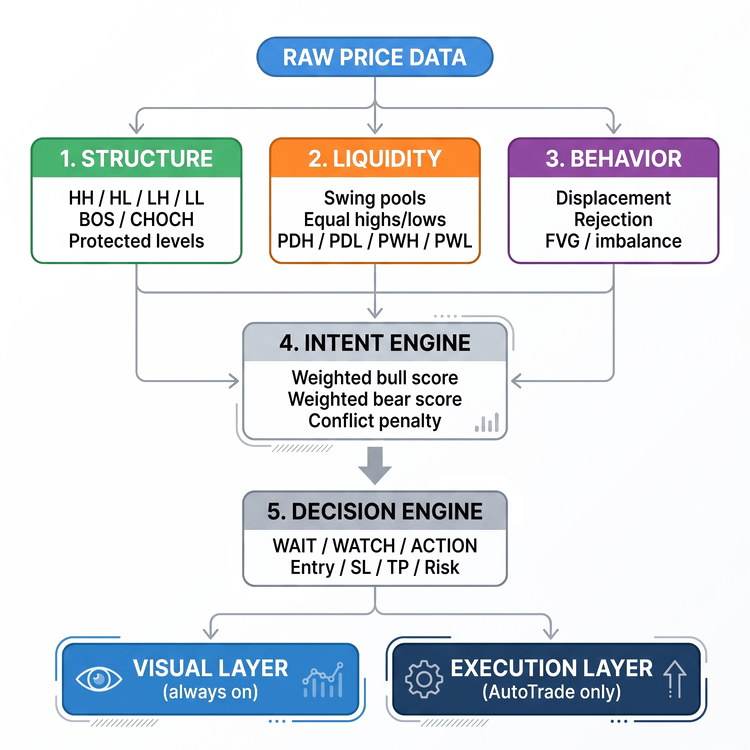
Context is handled by running stage one on four timeframes at once. A macro timeframe sets the broad bias, a primary timeframe carries the structure we trade with, a setup timeframe hosts the liquidity work, and an entry timeframe supplies confirmation. The defaults are H4, H1, M15, and M5, and all four are inputs. This is what stops the system from taking every pattern it finds. The same M15 sweep means one thing when H4 and H1 agree with it and something quite different when they do not, and the score reflects that difference automatically rather than through a handwritten exception.
The output is deliberately compressed. Rather than fifty objects, we show the handful that carry information, and we back them with a dashboard that states the case in words. The dashboard reports each timeframe's trend and whether liquidity has been swept (and on which side). It also shows the last displacement strength, FVG state, last structural break, component gauges, the total score, the decision state, and the current trade plan with its reward-to-risk ratio.
Getting Started
Inputs
//+------------------------------------------------------------------+
//|                                                Market Intent.mq5 |
//|                                  Copyright 2025, MetaQuotes Ltd. |
//|                     https://www.mql5.com/en/users/johnhlomohang/ |
//+------------------------------------------------------------------+
#property copyright "Copyright 2025, MetaQuotes Ltd."
#property link      "https://www.mql5.com/en/users/johnhlomohang/"
#property version   "1.00"
#property description "Market Intent Engine - fuses market structure, liquidity mapping and price behavior"
#property description "into a single 0-100 intent score with WAIT / WATCH / ACTION decision states."
#property description "Set AutoTrade = false to use it purely as a visual indicator."

#include <Trade\Trade.mqh>

//+------------------------------------------------------------------+
//| Inputs                                                           |
//+------------------------------------------------------------------+
input group "=== MASTER SWITCH ==="
input bool             InpAutoTrade          = false;        // AutoTrade (false = indicator only)

input group "=== TIMEFRAME CONTEXT ==="
input ENUM_TIMEFRAMES  InpMacroTF            = PERIOD_H4;    // Macro structure timeframe
input ENUM_TIMEFRAMES  InpPrimaryTF          = PERIOD_H1;    // Primary structure timeframe
input ENUM_TIMEFRAMES  InpSetupTF            = PERIOD_M15;   // Setup timeframe (liquidity / sweeps)
input ENUM_TIMEFRAMES  InpEntryTF            = PERIOD_M5;    // Entry timeframe (confirmation)
input int              InpBarsMacro          = 400;          // Bars to load - macro
input int              InpBarsPrimary        = 600;          // Bars to load - primary
input int              InpBarsSetup          = 900;          // Bars to load - setup
input int              InpBarsEntry          = 900;          // Bars to load - entry
The very first input in the file is the one that defines what the product actually is, and its placement at the top is not an accident. Everything downstream of it is written so that this single boolean is the only difference between a chart study tool and a trading robot. When it is false, the engine analyzes, draws, and reports. When it is true, precisely the same analysis reaches an execution layer. We never want to be in the position of wondering whether the chart we studied all week is the chart the machine is trading, and the only reliable way to guarantee that is to make the analysis a single shared code path with a switch at the end of it.
The four timeframes each carry a distinct job rather than being four looks at the same thing. The macro timeframe supplies a bias we are reluctant to trade against, the primary timeframe carries the structure we actually trade with, the setup timeframe is where liquidity is mapped and swept, and the entry timeframe supplies the final confirmation that price has committed. Because all four are inputs rather than constants, a swing trader can shift the whole stack up to D1, H4, H1, and M15 without touching a line of code, and the relationships between the stages will hold.
input group "=== 4. INTENT SCORING (weights sum to 100) ==="
input double           InpWHTF               = 20.0;         // Weight: HTF bias alignment
input double           InpWLiq               = 20.0;         // Weight: liquidity sweep
input double           InpWDisp              = 18.0;         // Weight: displacement
input double           InpWBOS               = 14.0;         // Weight: BOS / CHOCH
input double           InpWFVG               =  8.0;         // Weight: FVG present
input double           InpWRetest            =  8.0;         // Weight: FVG retest
input double           InpWReject            =  5.0;         // Weight: rejection
input double           InpWLoc               =  7.0;         // Weight: premium / discount location
input double           InpConflictWeight     = 0.30;         // Opposite-side penalty factor
input double           InpWatchScore         = 45.0;         // Score >= this -> WATCH
input double           InpActionScore        = 65.0;         // Score >= this -> ACTION
The scoring weights are exposed as inputs too, and they are chosen so that they sum to one hundred. This matters more than it might appear. A score is only interpretable when its maximum is known, and if you suspect that displacement deserves more influence than higher-timeframe bias, you can settle the question by editing two numbers rather than by unpicking the scoring function. The weights are the system's opinions made explicit.
input group "=== 5. DECISION GATES ==="
input bool             InpRequireSweep       = true;         // ACTION requires a fresh liquidity sweep
input bool             InpRequireDisplacement= true;         // ACTION requires aligned displacement
input bool             InpRequireBOS         = true;         // ACTION requires aligned BOS / CHOCH
input bool             InpRequireFVG         = false;        // ACTION requires an unfilled FVG
input double           InpMinRR              = 1.50;         // Minimum reward-to-risk
input double           InpDefaultRR          = 2.00;         // RR used when no pool target exists
input double           InpSLBufferATR        = 0.35;         // Stop buffer beyond invalidation (x ATR)
input double           InpMinTPDistATR       = 1.00;         // Ignore targets closer than this
Alongside the score, we expose a set of hard gates, and the separation between the two is a deliberate design decision. A weighted score is good at expressing degree, and poor at expressing necessity. If we fold a requirement into the score as a large weight, a setup can still reach the threshold without it by accumulating points elsewhere. This can lead to trades with no liquidity event behind them, simply because the trend and location looked acceptable. The gates fix that by sitting outside the arithmetic entirely. A high score alone cannot produce an ACTION state; the gates must also clear. That gives us one continuous control for quality and one binary control for admissibility, and the two cannot mask each other.
The data structures
//+------------------------------------------------------------------+
//| Data structures                                                  |
//+------------------------------------------------------------------+
struct SwingPoint
  {
   datetime          time;        // bar time of the swing
   double            price;       // swing price
   int               shift;       // series index in its source array
   int               confirmAt;   // series index where the swing becomes known
   bool              isHigh;      // true = swing high, false = swing low
   int               label;       // LBL_HH / LBL_HL / LBL_LH / LBL_LL
   bool              broken;      // a close has traded through it
   bool              swept;       // wick took it but close came back
  };
Before writing any analysis, we define what the system is permitted to know, because the shape of the state determines the questions later stages can ask. Six structures carry the entire engine, and each field in them exists because something downstream needs it. The swing point is the foundation, and two of its fields are worth dwelling on.
The confirmAt field is the one that keeps the whole system honest. The pairing of "broken" and "swept" encodes a distinction that a great many implementations collapse into a single flag, to their cost. A level that a candle closed through is finished; it has been absorbed into the structure and it no longer acts as a barrier. A level that a wick pierced before price closed back inside is not finished at all. It is arguably more interesting than it was before the pierce, because we now know that orders sat there and that somebody was willing to defend the level after taking them. Storing these as two separate booleans lets the structure engine and the liquidity engine draw opposite conclusions from the same candle, which is precisely what we want.
struct LiquidityPool
  {
   double            price;
   datetime          time;
   int               side;        // +1 buy-side (highs), -1 sell-side (lows)
   int               type;        // POOL_*
   int               touches;
   bool              swept;
   datetime          sweptTime;
   double            strength;    // 0..1
   string            tag;
  };
Liquidity is stored as pools rather than as lines, so that repeated interaction with the same area can accumulate instead of cluttering the map with near-duplicates. The touches and strength fields together let the map express the difference between a single forgotten swing high and a shelf of four equal highs that price has probed repeatedly. Both are buy-side liquidity, but only one of them is the kind of level a large participant would bother to run. A sweep is stored the same way, as a graded event rather than a boolean, because the useful question is never whether price touched a level.
struct SweepEvent
  {
   bool              valid;
   int               side;          // +1 buy-side taken, -1 sell-side taken
   double            level;
   double            extreme;       // wick extreme of the sweep bar
   double            excursionPts;
   bool              closedBack;
   bool              displacement;
   bool              structBreak;
   datetime          time;
   int               barShift;      // setup-TF shift of the sweep bar
   int               reactionDir;
   string            tag;
  };
Every one of those fields answers a question the scoring stage will ask. How far beyond the level did price travel? Did it close back inside, did anything happen afterwards? How long ago was it, and what was the level in the first place? By computing them once at detection time and storing them on the event, we avoid the common trap of recomputing the same conditions in three different places and letting them drift apart.
Stage one: the market structure engine
//+------------------------------------------------------------------+
//| STAGE 1 : structure engine                                       |
//+------------------------------------------------------------------+
void DetectSwings(const MqlRates &rates[], int n, int depth, SwingPoint &out[])
  {
   ArrayResize(out, 0);
   if(n < depth * 2 + 5)
      return;

   for(int i = n - depth - 1; i >= depth; i--)     // oldest -> newest
     {
      bool isHigh = true;
      bool isLow  = true;

      for(int k = 1; k <= depth; k++)
        {
         if(rates[i].high <= rates[i + k].high || rates[i].high <= rates[i - k].high)
            isHigh = false;
         if(rates[i].low  >= rates[i + k].low  || rates[i].low  >= rates[i - k].low)
            isLow = false;
         if(!isHigh && !isLow)
            break;
        }

      if(isHigh)
        {
         int sz = ArraySize(out);
         ArrayResize(out, sz + 1);
         out[sz].time      = rates[i].time;
         out[sz].price     = rates[i].high;
         out[sz].shift     = i;
         out[sz].confirmAt = i - depth;
         out[sz].isHigh    = true;
         out[sz].label     = LBL_NONE;
         out[sz].broken    = false;
         out[sz].swept     = false;
        }

      if(isLow)
        {
         int sz = ArraySize(out);
         ArrayResize(out, sz + 1);
         out[sz].time      = rates[i].time;
         out[sz].price     = rates[i].low;
         out[sz].shift     = i;
         out[sz].confirmAt = i - depth;
         out[sz].isHigh    = false;
         out[sz].label     = LBL_NONE;
         out[sz].broken    = false;
         out[sz].swept     = false;
        }
     }
  }
The swing detection itself is the ordinary fractal definition. For a swing depth of N, a bar is a swing high when its high exceeds the highs of the N bars on either side of it, and a swing low when the mirror condition holds. We test both in the same pass and break out early once neither can be true, which keeps the loop cheap on the longer histories the macro timeframe needs.
What is not ordinary is what we do with the result, and this is the point at which the engine departs from most published implementations. A swing at index i cannot be recognized until N further bars have printed to its right. That is not a quirk of the code; it is a property of the definition. The swing did not exist as information at the moment it formed, and any system that treats it as though it did is quietly reading the future. So we record the lag explicitly on the point itself rather than leaving it implicit.
//+------------------------------------------------------------------+
//| Build Structure                                                  |
//+------------------------------------------------------------------+
void BuildStructure(const MqlRates &rates[], int n, SwingPoint &sw[],
                    TFStruct &st, BreakEvent &ev[])
  {
    /*
    Walk the bars chronologically, activate swings when they become
    known, label them HH/HL/LH/LL, and register BOS / CHOCH events.*/

   ArrayResize(ev, 0);

   st.trend          = 0;
   st.lastHH = st.lastHL = st.lastLH = st.lastLL = 0.0;
   st.protHigh = st.protLow = 0.0;
   st.protHighTime = st.protLowTime = 0;
   st.lastBreakDir   = 0;
   st.lastBreakChoch = false;
   st.lastBreakTime  = 0;
   st.lastBreakLevel = 0.0;
   st.lastBreakShift = -1;

   int nsw = ArraySize(sw);
   if(nsw < 2 || n < 10)
      return;

   int    k        = 0;      // next swing waiting for activation
   double actHigh  = 0.0, actLow = 0.0;
   datetime actHighTime = 0, actLowTime = 0;
   int    actHighIdx = -1, actLowIdx = -1;
   double lastSwHigh = 0.0, lastSwLow = 0.0;

   for(int j = n - 1; j >= 0; j--)      // oldest -> newest
     {
      //--- activate every swing that becomes visible on this bar
      while(k < nsw && sw[k].confirmAt >= j)
        {
         if(sw[k].isHigh)
           {
            sw[k].label = (lastSwHigh > 0.0 && sw[k].price > lastSwHigh) ? LBL_HH : LBL_LH;
            lastSwHigh  = sw[k].price;
            actHigh     = sw[k].price;
            actHighTime = sw[k].time;
            actHighIdx  = k;
With the lag stored, the structure walk can respect it. We iterate the bars from oldest to newest, and a swing is only promoted to an active level once the walk actually reaches its confirmation bar. Everything the engine concludes at bar j is therefore derived from information that existed at bar j, and the consequences of that are larger than they sound. The chart the engine draws over history is the chart it would have drawn in real time, which means the labels we study on a Sunday are the labels we could have acted on. It also means that when the engine is later asked to place a stop below a protected low, that low is a level the market had already established rather than one that only became visible in hindsight.
            //--- retro check: did price already close through it while unconfirmed?
            double maxClose = -DBL_MAX;
            for(int b = sw[k].shift - 1; b >= j; b--)
               if(rates[b].close > maxClose)
                  maxClose = rates[b].close;

            if(maxClose > actHigh)
              {
               RegisterBreak(ev, st, actHighTime, actHigh, rates[j].time, j, 1);
               sw[k].broken = true;
               if(actLow > 0.0)
                 { st.protLow = actLow; st.protLowTime = actLowTime; }
               actHigh = 0.0;
               actHighIdx = -1;
              }
Honesty about the confirmation lag introduces a complication that has to be handled rather than ignored. During the N bars in which a swing high is still unconfirmed, price is perfectly free to close above it. By the time the swing becomes visible to the walk, it has already been broken, and if we simply activate it as fresh resistance, we leave a phantom level sitting on the chart that the market dealt with some time ago. We therefore look back over the unconfirmed window at the moment of activation, and if price has already closed through the level, we register the break immediately, we timestamp it at the confirmation bar rather than at the original close. Dating it to the confirmation bar is the conservative choice, because that is the earliest moment at which the engine could legitimately have known that a break had occurred.
//+------------------------------------------------------------------+
//| Register a structural break and flip the trend when needed       |
//+------------------------------------------------------------------+
void RegisterBreak(BreakEvent &ev[], TFStruct &st, datetime fromTime, double level,
                   datetime breakTime, int breakShift, int dir)
  {
   bool choch = (st.trend != 0 && st.trend != dir);

   int sz = ArraySize(ev);
   ArrayResize(ev, sz + 1);
   ev[sz].fromTime  = fromTime;
   ev[sz].level     = level;
   ev[sz].breakTime = breakTime;
   ev[sz].dir       = dir;
   ev[sz].choch     = choch;

   st.trend          = dir;
   st.lastBreakDir   = dir;
   st.lastBreakChoch = choch;
   st.lastBreakTime  = breakTime;
   st.lastBreakLevel = level;
   st.lastBreakShift = breakShift;
  }
Once the walk is running, the distinction between a break of structure and a change of character requires no separate detector at all. Both are the same event; the difference lies entirely in what the trend was beforehand. A break that continues the prevailing direction is a BOS, and a break that reverses it is a CHOCH. Writing it this way rather than as two independent pattern matchers removes an entire class of bug, because it becomes structurally impossible for the engine to report a bullish BOS and a bullish CHOCH from the same candle.
//+------------------------------------------------------------------+
//| Analyze TimeFrames                                               |
//+------------------------------------------------------------------+
int AnalyzeTF(ENUM_TIMEFRAMES tf, int bars, int depth, MqlRates &rates[],
              SwingPoint &sw[], TFStruct &st, BreakEvent &ev[])
  {
   ArraySetAsSeries(rates, true);
   int copied = CopyRates(_Symbol, tf, 0, bars, rates);
   if(copied < depth * 2 + 20)
      return 0;

   DetectSwings(rates, copied, depth, sw);
   BuildStructure(rates, copied, sw, st, ev);
   return copied;
  }
All of this runs on four timeframes through a single helper, which is what makes the multi-timeframe context affordable to maintain. There is no separate macro analyzer and no special-cased entry logic. There is one structure engine, called four times with different parameters, writing into four sets of arrays. When we later improve the swing classification, all four timeframes improve together.
Protected highs and lows
      //--- upside break of the active swing high
      if(actHigh > 0.0 && rates[j].close > actHigh)
        {
         RegisterBreak(ev, st, actHighTime, actHigh, rates[j].time, j, 1);
         if(actHighIdx >= 0)
            sw[actHighIdx].broken = true;
         if(actLow > 0.0)
           { st.protLow = actLow; st.protLowTime = actLowTime; }
         actHigh = 0.0;
         actHighIdx = -1;
        }
      //--- wick-only violation of the active swing high = a sweep
      else
         if(actHigh > 0.0 && rates[j].high > actHigh && rates[j].close < actHigh)
           {
            if(actHighIdx >= 0)
               sw[actHighIdx].swept = true;
           }
Not every swing carries the same weight, and treating them as equals is one of the quieter reasons that automated structure systems misbehave. In a bullish market, the swing low that existed at the instant the market broke a high is the level that holds the whole trend together. While it survives, the bullish reading remains valid no matter how untidy the intervening price action becomes. If the price decisively breaks it, the bullish reading is invalidated regardless of how many higher highs preceded it. The difficulty is that this level is only unambiguous at one moment, namely the moment of the break, so we capture it there rather than trying to reconstruct it afterward.
The second branch is where the structure engine quietly hands work to the liquidity engine, and the else is doing real work. A close through a level is a structural event and the level is consumed. A wick through the same level with a close back inside is not structural in the slightest, and treating it as a break would have the engine flipping its trend reading on every stop run. Instead, it is tagged as swept and left in place. The practical payoff of protected levels arrives much later, at the point where the system needs a stop loss. We are not placing stops a round number of points from entry, and we are not placing them at an ATR multiple chosen because it backtested well. We are placing them at the price which, if traded, means our reading of the market was simply wrong.
Stage two: the liquidity engine
//+------------------------------------------------------------------+
//| STAGE 2 : liquidity engine                                       |
//+------------------------------------------------------------------+
void AddPool(double price, datetime time, int side, int type, string tag, double strength)
  {
   if(price <= 0.0)
      return;

   double tol = g_atrSetup * InpEqualTolATR;
   if(tol <= 0.0)
      tol = 10 * Pt();

//--- merge with an existing pool at the same level
   for(int i = 0; i < ArraySize(g_pools); i++)
     {
      if(g_pools[i].side != side)
         continue;
      if(MathAbs(g_pools[i].price - price) <= tol)
        {
         g_pools[i].touches++;
         if(time > g_pools[i].time)
            g_pools[i].time = time;
         //--- an equal-level cluster is stronger than a single swing
         g_pools[i].strength = MathMin(1.0, g_pools[i].strength + 0.22);
         if(InpUseEqualPools && g_pools[i].type == POOL_SWING)
           {
            g_pools[i].type = POOL_EQUAL;
            g_pools[i].tag  = (side > 0 ? "EQH" : "EQL");
           }
         return;
        }
     }

   int sz = ArraySize(g_pools);
   ArrayResize(g_pools, sz + 1);
   g_pools[sz].price     = price;
   g_pools[sz].time      = time;
   g_pools[sz].side      = side;
   g_pools[sz].type      = type;
   g_pools[sz].touches   = 1;
   g_pools[sz].swept     = false;
   g_pools[sz].sweptTime = 0;
   g_pools[sz].strength  = strength;
   g_pools[sz].tag       = tag;
  }
The engine makes no claim to know where orders sit, because it cannot. What it can do is identify the price areas where liquidity is reasonably inferred from observable market structure, which is a far more defensible position and, in practice, sufficient. Four sources feed the map: unbroken swing highs and lows drawn from both the primary and setup timeframes, clusters of equal levels, previous day extremes, and previous week extremes. Each source is independently switchable, so a trader who does not believe in weekly levels can remove them without disturbing the rest.
Merging is what turns a scatter of lines into a usable map. When a candidate level lands within tolerance of an existing pool on the same side, we do not create a second entry. We raise the touch count, increase the strength, and promote the pool from an ordinary swing to an equal-highs or equal-lows cluster. The promotion is the important part, because a shelf of equal highs is a qualitatively different object from a single swing high, and by the time it has been touched three times the map should be saying so.
The tolerance is expressed as a fraction of ATR rather than as a number of points, and this is not a stylistic preference. Two highs that a gold trader would call equal are separated by a distance that would represent an enormous gap on a major currency pair. A fixed-point tolerance would merge half the chart on one symbol and nothing at all on the other, and the engine would need per-symbol tuning simply to remain coherent. Scaling by ATR means the same default behaves sensibly across instruments and, just as importantly, adapts as volatility changes on a single instrument.
Strength is seeded by source, with a previous week extreme starting at 0.85, a previous day extreme at 0.70, a primary-timeframe swing at 0.45, and a setup-timeframe swing at 0.30. These figures are not precise measurements of anything and should not be read as such. What matters is the ordering they express, which is that levels visible to more participants and standing for longer are the ones more worth running.
Liquidity sweeps properly defined
//+------------------------------------------------------------------+
//| Scan Sweeps                                                      |
//+------------------------------------------------------------------+
void ScanSweeps()
  {
   g_sweep.valid        = false;
   g_sweep.side         = 0;
   g_sweep.level        = 0.0;
   g_sweep.extreme      = 0.0;
   g_sweep.excursionPts = 0.0;
   g_sweep.closedBack   = false;
   g_sweep.displacement = false;
   g_sweep.structBreak  = false;
   g_sweep.time         = 0;
   g_sweep.barShift     = -1;
   g_sweep.reactionDir  = 0;
   g_sweep.tag          = "";

   if(g_nSetup < 20 || g_atrSetup <= 0.0)
      return;

   double minPen  = g_atrSetup * InpMinPenetrationATR;
   int    maxScan = MathMin(InpSweepScanBars, g_nSetup - 5);
   int    best    = -1;
   int    bestPool = -1;

   for(int j = 1; j <= maxScan; j++)
     {
      for(int p = 0; p < ArraySize(g_pools); p++)
        {
         if(g_pools[p].time >= g_rSetup[j].time)
            continue;

         if(g_pools[p].side > 0)
           {
            //--- buy-side liquidity above the market
            if(g_rSetup[j].high > g_pools[p].price + minPen &&
               g_rSetup[j].close < g_pools[p].price)
              {
               g_pools[p].swept     = true;
               g_pools[p].sweptTime = g_rSetup[j].time;
               if(best < 0 || j < best)
                 { best = j; bestPool = p; }
              }
           }
         else
           {
            //--- sell-side liquidity below the market
            if(g_rSetup[j].low < g_pools[p].price - minPen &&
               g_rSetup[j].close > g_pools[p].price)
              {
               g_pools[p].swept     = true;
               g_pools[p].sweptTime = g_rSetup[j].time;
               if(best < 0 || j < best)
                 { best = j; bestPool = p; }
              }
           }
        }
     }
This is the section where the system stops describing the chart and starts reading it, and it rests on a single insistence. A sweep is not price touching a level. A sweep is a sequence, and the sequence has to occur in order: price approaches the level, trades beyond it, fails to continue, closes back inside, and then reacts away from it. Any implementation that stops at the first two steps will mark a sweep on every level that price is in the process of breaking, which is the opposite of the information we want. We therefore test the trade-beyond and the close-back-inside as a joint condition on the same candle.
//--- reaction: opposite displacement inside the allowed window
   int wanted = (g_sweep.side > 0 ? -1 : 1);
   for(int b = j; b >= MathMax(1, j - InpSweepReactBars); b--)
     {
      int    dir   = 0;
      double score = 0.0;
      if(IsDisplacementBar(g_rSetup, b, g_atrSetup, dir, score) && dir == wanted)
        {
         g_sweep.displacement = true;
         g_sweep.reactionDir  = dir;
         break;
        }
     }

//--- reaction: a structural break in the same direction after the sweep
   if(g_stSetup.lastBreakDir == wanted && g_stSetup.lastBreakTime >= g_sweep.time)
      g_sweep.structBreak = true;
   else
      if(g_stEntry.lastBreakDir == wanted && g_stEntry.lastBreakTime >= g_sweep.time)
         g_sweep.structBreak = true;
  }
Note the direction inversion held in wanted. When buy-side liquidity above the market is taken, the reaction we are looking for is bearish, and when sell-side liquidity below the market is taken, the reaction is bullish. Getting this backwards is one of the easiest mistakes to make in this kind of code and one of the hardest to spot afterward, because the system will still trade and will still sometimes win. Isolating the inversion in a single named variable, used consistently in both reaction checks, makes it a one-line thing to verify.
Stage three: the price behavior engine
//+------------------------------------------------------------------+
//| STAGE 3 : price behavior engine                                  |
//+------------------------------------------------------------------+
bool IsDisplacementBar(const MqlRates &r[], int i, double atr, int &dir, double &score)
  {
   dir   = 0;
   score = 0.0;
   if(atr <= 0.0 || i < 0)
      return false;

   double range = r[i].high - r[i].low;
   if(range <= 0.0)
      return false;

   double body      = MathAbs(r[i].close - r[i].open);
   double bodyRatio = body / range;
   double rangeMult = range / atr;

   if(rangeMult < InpDispATRMult || bodyRatio < InpDispBodyRatio)
      return false;

   dir   = (r[i].close > r[i].open) ? 1 : -1;
   score = MathMin(1.0, 0.60 * MathMin(1.0, rangeMult / (InpDispATRMult * 2.0)) + 0.40 * bodyRatio);
   return true;
  }
Structure tells us where price is, and liquidity tells us what price interacted with. Behavior tells us what price actually did, and displacement is the primary measurement. We define it as a joint condition on range and body rather than on range alone, and the reason is straightforward. A candle can be three times the average range and still represent nothing but indecision if it spent the session swinging around and closed near its open. Intent shows up in the body. Requiring both a wide range relative to recent volatility and a body that occupies most of that range filters out the wide indecisive candles that would otherwise dominate any pure range test.
//+------------------------------------------------------------------+
//| Analyze Behavior                                                 |
//+------------------------------------------------------------------+
void AnalyzeBehavior()
  {
   g_beh.dispValid   = false;
   g_beh.dispDir     = 0;
   g_beh.dispScore   = 0.0;
   g_beh.dispHigh    = 0.0;
   g_beh.dispLow     = 0.0;
   g_beh.dispTime    = 0;
   g_beh.dispShift   = -1;
   g_beh.consecutive = 0;
   g_beh.bodyRatio   = 0.0;
   g_beh.wickUpRatio = 0.0;
   g_beh.wickDnRatio = 0.0;
   g_beh.rejectUp    = false;
   g_beh.rejectDown  = false;
   g_beh.momentum    = 0.0;

   if(g_nSetup < 10 || g_atrSetup <= 0.0)
      return;

//--- most recent displacement leg on the setup timeframe
   int scan = MathMin(InpDispScanBars, g_nSetup - 3);
   for(int i = 1; i <= scan; i++)
     {
      int    dir   = 0;
      double score = 0.0;
      if(IsDisplacementBar(g_rSetup, i, g_atrSetup, dir, score))
        {
         g_beh.dispValid = true;
         g_beh.dispDir   = dir;
         g_beh.dispScore = score;
         g_beh.dispTime  = g_rSetup[i].time;
         g_beh.dispShift = i;

         //--- widen the leg over adjacent same-direction candles
         double hi = g_rSetup[i].high;
         double lo = g_rSetup[i].low;
         for(int k = i + 1; k <= MathMin(i + 3, g_nSetup - 1); k++)
           {
            bool same = (dir > 0) ? (g_rSetup[k].close > g_rSetup[k].open)
                        : (g_rSetup[k].close < g_rSetup[k].open);
            if(!same)
               break;
            hi = MathMax(hi, g_rSetup[k].high);
            lo = MathMin(lo, g_rSetup[k].low);
           }
Having found a displacement candle, we widen it into a leg, walking outwards over adjacent candles that share its direction. This matters because of what we do with the result later. A three-candle thrust is one move, and if we measure the retracement of only its final candle we will place an entry zone somewhere in the middle of the move rather than at the level price is likely to return to. Taking the extremes of the whole leg gives us a retracement measurement that corresponds to what a trader reading the chart would draw by hand.
//--- rejection profile of the last closed setup candle
   double range = g_rSetup[1].high - g_rSetup[1].low;
   if(range > 0.0)
     {
      double body   = MathAbs(g_rSetup[1].close - g_rSetup[1].open);
      double upWick = g_rSetup[1].high - MathMax(g_rSetup[1].close, g_rSetup[1].open);
      double dnWick = MathMin(g_rSetup[1].close, g_rSetup[1].open) - g_rSetup[1].low;

      g_beh.bodyRatio   = body / range;
      g_beh.wickUpRatio = upWick / range;
      g_beh.wickDnRatio = dnWick / range;

      g_beh.rejectUp   = (g_beh.wickDnRatio >= InpRejWickRatio &&
                          g_rSetup[1].close > g_rSetup[1].open);
      g_beh.rejectDown = (g_beh.wickUpRatio >= InpRejWickRatio &&
                          g_rSetup[1].close < g_rSetup[1].open);
     }

   double mom = 0.0;
   mom += 0.5 * MathMin(1.0, MathAbs((double)g_beh.consecutive) / 4.0);
   mom += 0.5 * g_beh.bodyRatio;
   g_beh.momentum = MathMin(1.0, mom);
  }
Rejection is measured on the last closed setup candle as a wick-to-range ratio combined with the direction of the close, and the combination is what makes it meaningful. A long lower wick is often described as bullish on its own, but a long lower wick on a candle that closed down is a failed recovery rather than a rejection, and the engine refuses to read it as bullish. This small piece of code encodes an important idea: which is that no single feature of a candle means anything without the rest of the surrounding candle.
Fair value gaps as graded objects
//+------------------------------------------------------------------+
//| Fair value gaps / imbalances on the setup timeframe              |
//+------------------------------------------------------------------+
void DetectFVGs()
  {
   ArrayResize(g_fvgs, 0);
   if(g_nSetup < 10 || g_atrSetup <= 0.0)
      return;

   double minSize = g_atrSetup * InpMinFVGATR;
   int    scan    = MathMin(InpFVGScanBars, g_nSetup - 4);

   for(int i = 1; i <= scan; i++)
     {
      double up = 0.0, lo = 0.0;
      int    dir = 0;

      if(g_rSetup[i].low > g_rSetup[i + 2].high)
        {
         dir = 1;
         lo  = g_rSetup[i + 2].high;
         up  = g_rSetup[i].low;
        }
      else
         if(g_rSetup[i].high < g_rSetup[i + 2].low)
           {
            dir = -1;
            lo  = g_rSetup[i].high;
            up  = g_rSetup[i + 2].low;
           }

      if(dir == 0)
         continue;
      if((up - lo) < minSize)
         continue;

      //--- how deeply has price traded back into the gap since it formed?
      double deepest = (dir > 0 ? up : lo);
      bool   tapped  = false;
      for(int b = i - 1; b >= 0; b--)
        {
         if(dir > 0)
           {
            if(g_rSetup[b].low <= up)
              { tapped = true; deepest = MathMin(deepest, g_rSetup[b].low); }
           }
         else
           {
            if(g_rSetup[b].high >= lo)
              { tapped = true; deepest = MathMax(deepest, g_rSetup[b].high); }
           }
        }

      double ratio = 0.0;
      double width = up - lo;
      if(width > 0.0)
         ratio = (dir > 0) ? (up - deepest) / width : (deepest - lo) / width;
      ratio = MathMax(0.0, MathMin(1.0, ratio));

      if(ratio > InpMaxFVGFill)
         continue;                                  // effectively consumed

      int sz = ArraySize(g_fvgs);
      ArrayResize(g_fvgs, sz + 1);
      g_fvgs[sz].upper     = up;
      g_fvgs[sz].lower     = lo;
      g_fvgs[sz].dir       = dir;
      g_fvgs[sz].time      = g_rSetup[i].time;
      g_fvgs[sz].fillRatio = ratio;
      g_fvgs[sz].tapped    = tapped;
      g_fvgs[sz].shift     = i;
     }
  }
A fair value gap is trivially easy to detect and remarkably easy to misuse. The detection is the standard three-candle imbalance, where the wick of the first candle and the wick of the third fail to overlap, leaving a band of price through which the market moved without trading in both directions.
The useful work happens afterward, in how we track what becomes of the gap. Most implementations store a filled flag and remove the gap once the price touches it, which discards the entire middle of the story. The interesting region is precisely the space between untouched and consumed. A gap that has been tapped by ten percent is a live magnet with plenty of unfilled area left to attract price. A gap that has been filled by ninety percent has done its job, and continuing to score it as a reason to trade is how a system ends up buying into an area that has already been rebalanced. We therefore compute and store a fill ratio, and discard the gap only when the ratio exceeds a configurable maximum.
Stage four: intent scoring
//+------------------------------------------------------------------+
//| STAGE 4 : intent scoring                                         |
//+------------------------------------------------------------------+
void ScoreIntent()
  {
   double bull = 0.0, bear = 0.0;
   double sStruct = 0.0, sLiq = 0.0, sDisp = 0.0, sLoc = 0.0;

//--- (a) higher timeframe bias
   if(g_stMacro.trend > 0)
      bull += InpWHTF * 0.60;
   else
      if(g_stMacro.trend < 0)
         bear += InpWHTF * 0.60;

   if(g_stPrim.trend > 0)
      bull += InpWHTF * 0.40;
   else
      if(g_stPrim.trend < 0)
         bear += InpWHTF * 0.40;
Here the pipeline converges. We compute a bullish total and a bearish total independently, then resolve them against each other. Computing both rather than a single signed number is what lets the engine recognize a market that is arguing with itself, and that recognition turns out to be one of the more valuable things it does. A single signed score would report a market with strong bullish structure and strong bearish location as mildly bullish, which is not what a human reading the same chart would conclude. Two totals plus a resolution step reports it as conflicted, which is correct.
Higher-timeframe bias is split so that the macro timeframe carries more influence than the primary one, and so that partial alignment earns partial credit. A setup where H4 and H1 both point the same way should not score the same as one where they disagree, and neither should be a simple pass or fail.
//--- (b) liquidity
   if(g_sweep.valid)
     {
      double rec = RecencyFactor(g_sweep.barShift, InpSweepValidBars);
      double q   = rec;
      if(g_sweep.displacement)
         q *= 1.00;
      else
         q *= 0.65;
      if(g_sweep.structBreak)
         q *= 1.00;
      else
         q *= 0.80;

      if(g_sweep.side < 0)
         bull += InpWLiq * q;    // sell-side taken -> bullish
      else
         bear += InpWLiq * q;    // buy-side taken  -> bearish

      sLiq = q;
     }
The liquidity contribution is where the grading work from stage two is finally spent. Recency, displacement, and structure break each modulate the available weight multiplicatively, so a fresh sweep that produced both a displacement and a break keeps essentially all of its twenty points, while a stale sweep that produced neither retains roughly half. The direction is inverted, for the reason discussed earlier, and writing the inversion with an explanatory comment on each branch is cheap insurance against a future edit getting it backwards.
//--- (g) premium / discount location
   double rHigh = g_stPrim.rangeHigh;
   double rLow  = g_stPrim.rangeLow;
   if(rHigh > rLow)
     {
      double eq   = (rHigh + rLow) * 0.5;
      double half = (rHigh - rLow) * 0.5;
      double dev  = (px - eq) / half;                 // -1 = deep discount, +1 = deep premium
      dev = MathMax(-1.0, MathMin(1.0, dev));
      if(dev < 0.0)
         bull += InpWLoc * MathAbs(dev);
      else
         bear += InpWLoc * dev;
      sLoc = MathAbs(dev);
     }
Location contributes through a premium and discount reading taken from the primary timeframe range, and it is the component that most often keeps the engine out of a bad trade. Buying at a discount and selling at a premium is rewarded, and the reward scales continuously with distance from equilibrium rather than switching at the midpoint. The effect in practice is that a bullish setup appearing near the top of the range loses several points relative to the same setup appearing near the bottom, which is usually enough to move it out of ACTION and into WATCH.
Stage five: the decision engine and trade plan
   if(g_intent.score >= InpActionScore && gates)
      g_intent.state = (d > 0) ? STATE_ACTION_LONG : STATE_ACTION_SHORT;
   else
      if(g_intent.score >= InpWatchScore && d != 0)
         g_intent.state = (d > 0) ? STATE_WATCH_LONG : STATE_WATCH_SHORT;
      else
         g_intent.state = STATE_WAIT;
The engine never emits a bare buy or sell, and the middle tier of its output is what makes it usable by a human rather than only by a broker. "WAIT" means there is no sufficiently strong alignment and the chart can be left alone. "WATCH" means conditions are developing, and this is the moment to be at the screen. "ACTION" means the required conditions are satisfied. A trader running the system as an indicator spends most of their day ignoring it and reacts to the WATCH transition, which is a far more realistic workflow than staring at a chart hoping to catch an entry.
//+------------------------------------------------------------------+
//| STAGE 5 : trade plan                                             |
//+------------------------------------------------------------------+
void BuildPlan()
  {
   g_plan.valid = false;
   g_plan.dir   = 0;
   g_plan.note  = "";

   int d = g_intent.direction;
   if(d == 0 || g_intent.state == STATE_WAIT)
      return;

   double atr = (g_atrSetup > 0.0 ? g_atrSetup : g_atrEntry);
   if(atr <= 0.0)
      return;

   double zLow = 0.0, zHigh = 0.0;
   int f = FindFVG(d);

   if(f >= 0)
     {
      zLow  = g_fvgs[f].lower;
      zHigh = g_fvgs[f].upper;
      g_plan.note = "FVG zone";
     }
   else
      if(g_beh.dispValid && g_beh.dispDir == d && g_beh.dispHigh > g_beh.dispLow)
        {
         //--- optimal trade entry band of the displacement leg
         double legLow  = g_beh.dispLow;
         double legHigh = g_beh.dispHigh;
         double range   = legHigh - legLow;
         if(d > 0)
           {
            zHigh = legHigh - 0.62 * range;
            zLow  = legHigh - 0.79 * range;
           }
         else
           {
            zLow  = legLow + 0.62 * range;
            zHigh = legLow + 0.79 * range;
           }
         g_plan.note = "OTE band";
        }
      else
        {
         double px = (d > 0 ? Ask() : Bid());
         zLow  = px - atr * 0.25;
         zHigh = px + atr * 0.25;
         g_plan.note = "market band";
        }

   if(zHigh < zLow)
     {
      double t = zHigh;
      zHigh = zLow;
      zLow = t;
     }

//--- invalidation: beyond the sweep extreme / protected level
   double inval = 0.0;
   if(d > 0)
     {
      inval = zLow;
      if(g_sweep.valid && g_sweep.side < 0 && g_sweep.extreme > 0.0)
         inval = MathMin(inval, g_sweep.extreme);
      if(g_stSetup.protLow > 0.0)
         inval = MathMin(inval, g_stSetup.protLow);
      if(g_beh.dispValid && g_beh.dispDir > 0)
         inval = MathMin(inval, g_beh.dispLow);
      g_plan.sl = inval - atr * InpSLBufferATR;
     }
The invalidation level is chosen as the most conservative of three candidates rather than by a single rule, and the three candidates are exactly the three places where a long trade would be proven wrong. The far edge of the entry zone is one, because if price passes cleanly through the zone the imbalance thesis has failed. The extreme of the sweep that started the move is another, because trading below it means the low that supposedly held did not hold. The protected low from the structure engine is the third, because breaking it invalidates the bullish structure outright. Taking the minimum of all three and then pushing beyond it by an ATR-scaled buffer keeps the stop off the exact price that everybody else is watching.
//--- targets from the liquidity map
   double minDist = atr * InpMinTPDistATR;
   double tp1 = FindTarget(d, entry, minDist, 0.0);
   if(tp1 == 0.0)
      tp1 = (d > 0) ? entry + risk * InpDefaultRR : entry - risk * InpDefaultRR;

   double tp2 = FindTarget(d, entry, minDist, tp1);
   if(tp2 == 0.0)
      tp2 = (d > 0) ? entry + risk * (InpDefaultRR + 1.0)
            : entry - risk * (InpDefaultRR + 1.0);

   g_plan.valid    = true;
   g_plan.dir      = d;
   g_plan.zoneLow  = zLow;
   g_plan.zoneHigh = zHigh;
   g_plan.entry    = entry;
   g_plan.tp1      = tp1;
   g_plan.tp2      = tp2;
   g_plan.rr       = MathAbs(tp1 - entry) / risk;
  }
Targets come from the liquidity map rather than from a fixed multiple, and this is the natural conclusion of everything built up to this point. If we are long because sell-side liquidity was taken and price displaced upward, then the logical destination is the next unswept buy-side pool, since that is where the next concentration of orders sits waiting. Only when no such pool exists within a sensible distance do we fall back on a default reward-to-risk multiple, and the minimum distance filter prevents the engine from nominating a target so close that the trade could never clear its risk requirement.
The visual layer
//+------------------------------------------------------------------+
//| Dashboard                                                        |
//+------------------------------------------------------------------+
void DrawPanel()
  {
   if(!InpShowPanel)
     {
      ObjectsDeleteAll(0, PFX + "PN", -1, -1);
      return;
     }

   int x = InpPanelX;
   int y = InpPanelY;
   int rowH = 15;
   int rows = 22;
   int w = 330;
   int h = rows * rowH + 16;

   string bg = PFX + "PNbg";
   if(ObjectFind(0, bg) < 0)
      ObjectCreate(0, bg, OBJ_RECTANGLE_LABEL, 0, 0, 0);
   ObjectSetInteger(0, bg, OBJPROP_CORNER, CORNER_LEFT_UPPER);
   ObjectSetInteger(0, bg, OBJPROP_XDISTANCE, x - 6);
   ObjectSetInteger(0, bg, OBJPROP_YDISTANCE, y - 8);
   ObjectSetInteger(0, bg, OBJPROP_XSIZE, w);
   ObjectSetInteger(0, bg, OBJPROP_YSIZE, h);
   ObjectSetInteger(0, bg, OBJPROP_BGCOLOR, InpColPanelBg);
   ObjectSetInteger(0, bg, OBJPROP_BORDER_TYPE, BORDER_FLAT);
   ObjectSetInteger(0, bg, OBJPROP_COLOR, clrDimGray);
   ObjectSetInteger(0, bg, OBJPROP_BACK, false);
   ObjectSetInteger(0, bg, OBJPROP_SELECTABLE, false);
   ObjectSetInteger(0, bg, OBJPROP_HIDDEN, true);

   int r = 0;
   color dirCol = (g_intent.direction > 0 ? InpColBull :
                   (g_intent.direction < 0 ? InpColBear : clrSilver));

   MakeLabel(PFX + "PN" + IntegerToString(r), x, y + rowH * r,
             "      MARKET INTENT ENGINE", clrWhite, 9);
   r++;
   MakeLabel(PFX + "PN" + IntegerToString(r), x, y + rowH * r,
             "--------------------------------------", clrDimGray, 8);
   r++;

   MakeLabel(PFX + "PN" + IntegerToString(r), x, y + rowH * r,
             Pad("Symbol", 15) + _Symbol + "  " + TFName(InpSetupTF),
             InpColPanelText, 8);
   r++;

   MakeLabel(PFX + "PN" + IntegerToString(r), x, y + rowH * r,
             Pad("Macro " + TFName(InpMacroTF), 15) + TrendName(g_stMacro.trend),
             (g_stMacro.trend > 0 ? InpColBull : (g_stMacro.trend < 0 ? InpColBear : clrSilver)),
             8);
   r++;

   MakeLabel(PFX + "PN" + IntegerToString(r), x, y + rowH * r,
             Pad("Primary " + TFName(InpPrimaryTF), 15) + TrendName(g_stPrim.trend),
             (g_stPrim.trend > 0 ? InpColBull : (g_stPrim.trend < 0 ? InpColBear : clrSilver)),
             8);
   r++;

   string strTxt = "n/a";
   if(g_stPrim.trend > 0)
      strTxt = "HH -> HL";
   else
      if(g_stPrim.trend < 0)
         strTxt = "LL -> LH";
   MakeLabel(PFX + "PN" + IntegerToString(r), x, y + rowH * r,
             Pad("Structure", 15) + strTxt, InpColPanelText, 8);
   r++;

   string liqTxt = "none fresh";
   color  liqCol = clrSilver;
   if(g_sweep.valid)
     {
      liqTxt = (g_sweep.side > 0 ? "BUY-SIDE SWEPT" : "SELL-SIDE SWEPT");
      liqTxt += " (" + g_sweep.tag + ")";
      liqCol = (g_sweep.side > 0 ? InpColBear : InpColBull);
     }
   MakeLabel(PFX + "PN" + IntegerToString(r), x, y + rowH * r,
             Pad("Liquidity", 15) + liqTxt, liqCol, 8);
   r++;

   string dispTxt = "none";
   color  dispCol = clrSilver;
   if(g_beh.dispValid)
     {
      dispTxt = (g_beh.dispDir > 0 ? "BULLISH " : "BEARISH ");
      dispTxt += (g_beh.dispScore > 0.75 ? "STRONG" : (g_beh.dispScore > 0.5 ? "MODERATE" : "MILD"));
      dispCol = (g_beh.dispDir > 0 ? InpColBull : InpColBear);
     }
   MakeLabel(PFX + "PN" + IntegerToString(r), x, y + rowH * r,
             Pad("Displacement", 15) + dispTxt, dispCol, 8);
   r++;

   int fB = FindFVG(1), fS = FindFVG(-1);
   string fvgTxt = "none";
   if(fB >= 0 && fS >= 0)
      fvgTxt = "BULL + BEAR";
   else
      if(fB >= 0)
         fvgTxt = StringFormat("BULLISH (%.0f%% filled)", g_fvgs[fB].fillRatio * 100.0);
      else
         if(fS >= 0)
            fvgTxt = StringFormat("BEARISH (%.0f%% filled)", g_fvgs[fS].fillRatio * 100.0);
   MakeLabel(PFX + "PN" + IntegerToString(r), x, y + rowH * r,
             Pad("FVG", 15) + fvgTxt, InpColPanelText, 8);
   r++;

   string bosTxt = "none";
   color  bosCol = clrSilver;
   if(g_stSetup.lastBreakDir != 0)
     {
      bosTxt = (g_stSetup.lastBreakDir > 0 ? "BULLISH " : "BEARISH ");
      bosTxt += (g_stSetup.lastBreakChoch ? "CHOCH" : "BOS");
      bosCol = (g_stSetup.lastBreakDir > 0 ? InpColBull : InpColBear);
     }
   MakeLabel(PFX + "PN" + IntegerToString(r), x, y + rowH * r,
             Pad("LTF structure", 15) + bosTxt, bosCol, 8);
   r++;

   MakeLabel(PFX + "PN" + IntegerToString(r), x, y + rowH * r,
             "--------------------------------------", clrDimGray, 8);
   r++;

   MakeLabel(PFX + "PN" + IntegerToString(r), x, y + rowH * r,
             Pad("Structure", 14) + BarGauge(g_intent.cStructure, 10), dirCol, 8);
   r++;
   MakeLabel(PFX + "PN" + IntegerToString(r), x, y + rowH * r,
             Pad("Liquidity", 14) + BarGauge(g_intent.cLiquidity, 10), dirCol, 8);
   r++;
   MakeLabel(PFX + "PN" + IntegerToString(r), x, y + rowH * r,
             Pad("Displacement", 14) + BarGauge(g_intent.cDisplacement, 10), dirCol, 8);
   r++;
   MakeLabel(PFX + "PN" + IntegerToString(r), x, y + rowH * r,
             Pad("Momentum", 14) + BarGauge(g_intent.cMomentum, 10), dirCol, 8);
   r++;
   MakeLabel(PFX + "PN" + IntegerToString(r), x, y + rowH * r,
             Pad("Location", 14) + BarGauge(g_intent.cLocation, 10), dirCol, 8);
   r++;

   MakeLabel(PFX + "PN" + IntegerToString(r), x, y + rowH * r,
             "--------------------------------------", clrDimGray, 8);
   r++;

   MakeLabel(PFX + "PN" + IntegerToString(r), x, y + rowH * r,
             StringFormat("INTENT  %s  %.0f / 100  [%s]",
                          (g_intent.direction > 0 ? "BULLISH" :
                           (g_intent.direction < 0 ? "BEARISH" : "NEUTRAL")),
                          g_intent.score, g_intent.headline),
             dirCol, 9);
   r++;

   MakeLabel(PFX + "PN" + IntegerToString(r), x, y + rowH * r,
             "STATE   " + StateName(g_intent.state),
             (g_intent.state == STATE_ACTION_LONG ? InpColBull :
              (g_intent.state == STATE_ACTION_SHORT ? InpColBear : clrSilver)), 9);
   r++;

   if(g_plan.valid)
     {
      MakeLabel(PFX + "PN" + IntegerToString(r), x, y + rowH * r,
                StringFormat("Zone  %s - %s  (%s)",
                             PriceS(g_plan.zoneLow), PriceS(g_plan.zoneHigh), g_plan.note),
                InpColPanelText, 8);
      r++;
      MakeLabel(PFX + "PN" + IntegerToString(r), x, y + rowH * r,
                StringFormat("SL %s  TP1 %s  RR %.2f",
                             PriceS(g_plan.sl), PriceS(g_plan.tp1), g_plan.rr),
                InpColPanelText, 8);
      r++;
     }
   else
     {
      MakeLabel(PFX + "PN" + IntegerToString(r), x, y + rowH * r,
                "Zone  -", InpColPanelText, 8);
      r++;
      MakeLabel(PFX + "PN" + IntegerToString(r), x, y + rowH * r,
                "SL -  TP1 -  RR -", InpColPanelText, 8);
      r++;
     }

   MakeLabel(PFX + "PN" + IntegerToString(r), x, y + rowH * r,
             "AutoTrade  " + (InpAutoTrade ? "ON (executing)" : "OFF (visual only)"),
             (InpAutoTrade ? clrOrange : clrSilver), 8);
   r++;

   for(int i = r; i < rows; i++)
      MakeLabel(PFX + "PN" + IntegerToString(i), x, y + rowH * i, "", clrBlack, 8);
  }
The visual layer is deliberately thin, because the analysis has already done the work of deciding what deserves to be on screen. Swing labels are drawn only for the primary timeframe and only for the most recent handful, since a chart carrying every swing from the last six hundred bars is the problem we set out to solve rather than a feature. Structural breaks are drawn as a line running from the broken swing to the candle that broke it, solid for a BOS and dashed for a CHOCH, so that the eye can trace what was broken and when without reading any text at all.
Liquidity pools are drawn with their tag and touch count, and swept pools switch to a dotted grey line rather than disappearing. Keeping the swept levels visible is a small decision with a large effect on readability, because the sequence of which pools have already been taken is a large part of the story a trader is trying to read. A chart that silently deletes them leaves us wondering why price turned where it did.
Execution and risk
//+------------------------------------------------------------------+
//|  Calculate Lots                                                  |
//+------------------------------------------------------------------+
double CalcLots(double entry, double sl)
  {
   double minLot  = SymbolInfoDouble(_Symbol, SYMBOL_VOLUME_MIN);
   double maxLot  = SymbolInfoDouble(_Symbol, SYMBOL_VOLUME_MAX);
   double lotStep = SymbolInfoDouble(_Symbol, SYMBOL_VOLUME_STEP);

   if(InpUseFixedLot)
     {
      double f = MathMax(minLot, MathMin(maxLot, InpFixedLot));
      return NormalizeDouble(MathFloor(f / lotStep) * lotStep, 2);
     }

   double tickValue = SymbolInfoDouble(_Symbol, SYMBOL_TRADE_TICK_VALUE);
   double tickSize  = SymbolInfoDouble(_Symbol, SYMBOL_TRADE_TICK_SIZE);
   double slDist    = MathAbs(entry - sl);

   if(tickValue <= 0.0 || tickSize <= 0.0 || slDist <= 0.0)
      return minLot;

   double riskMoney  = AccountInfoDouble(ACCOUNT_BALANCE) * InpRiskPercent / 100.0;
   double lossPerLot = (slDist / tickSize) * tickValue;
   if(lossPerLot <= 0.0)
      return minLot;

   double lots = riskMoney / lossPerLot;
   lots = MathFloor(lots / lotStep) * lotStep;
   lots = MathMax(minLot, MathMin(maxLot, lots));
   return NormalizeDouble(lots, 2);
  }
The execution layer is short, and it is short because by the time it runs every decision has already been made elsewhere. Position size derives from the distance to the invalidation level and the configured risk percentage, computed through tick value and tick size rather than through points, so that the same code sizes correctly on gold, on indices, and on currency pairs without a lookup table. The floor operation on the lot step is a small detail worth keeping, since rounding up rather than down would quietly push every trade slightly over the intended risk.
//+------------------------------------------------------------------+
//|  Expire Armed Setups                                             |
//+------------------------------------------------------------------+
void ExpireArmedSetup()
  {
   if(!g_arm.armed)
      return;

   g_arm.barsLeft--;
   if(g_arm.barsLeft <= 0)
     {
      g_arm.armed = false;
      if(InpEntryMode == ENTRY_LIMIT_ZONE)
         DeletePendingOrders();
      if(InpDebugPrint)
         Print("[MIE] armed setup expired");
     }
  }
Three entry modes are available, and they represent a genuine trade-off rather than a menu of equivalent options. Market on signal takes the trade the moment ACTION appears, which guarantees participation and accepts a worse average price. Market on zone arms the setup and waits for price to trade back into the entry band, which improves the price and accepts that some setups will simply run away. A limit on a zone places a pending order in the band and removes it if the setup goes stale. Whichever mode is chosen, the armed setup carries an expiry measured in setup-timeframe bars, because a plan built around a sweep that happened two hours ago has stopped being a plan and become a hope.
Demo
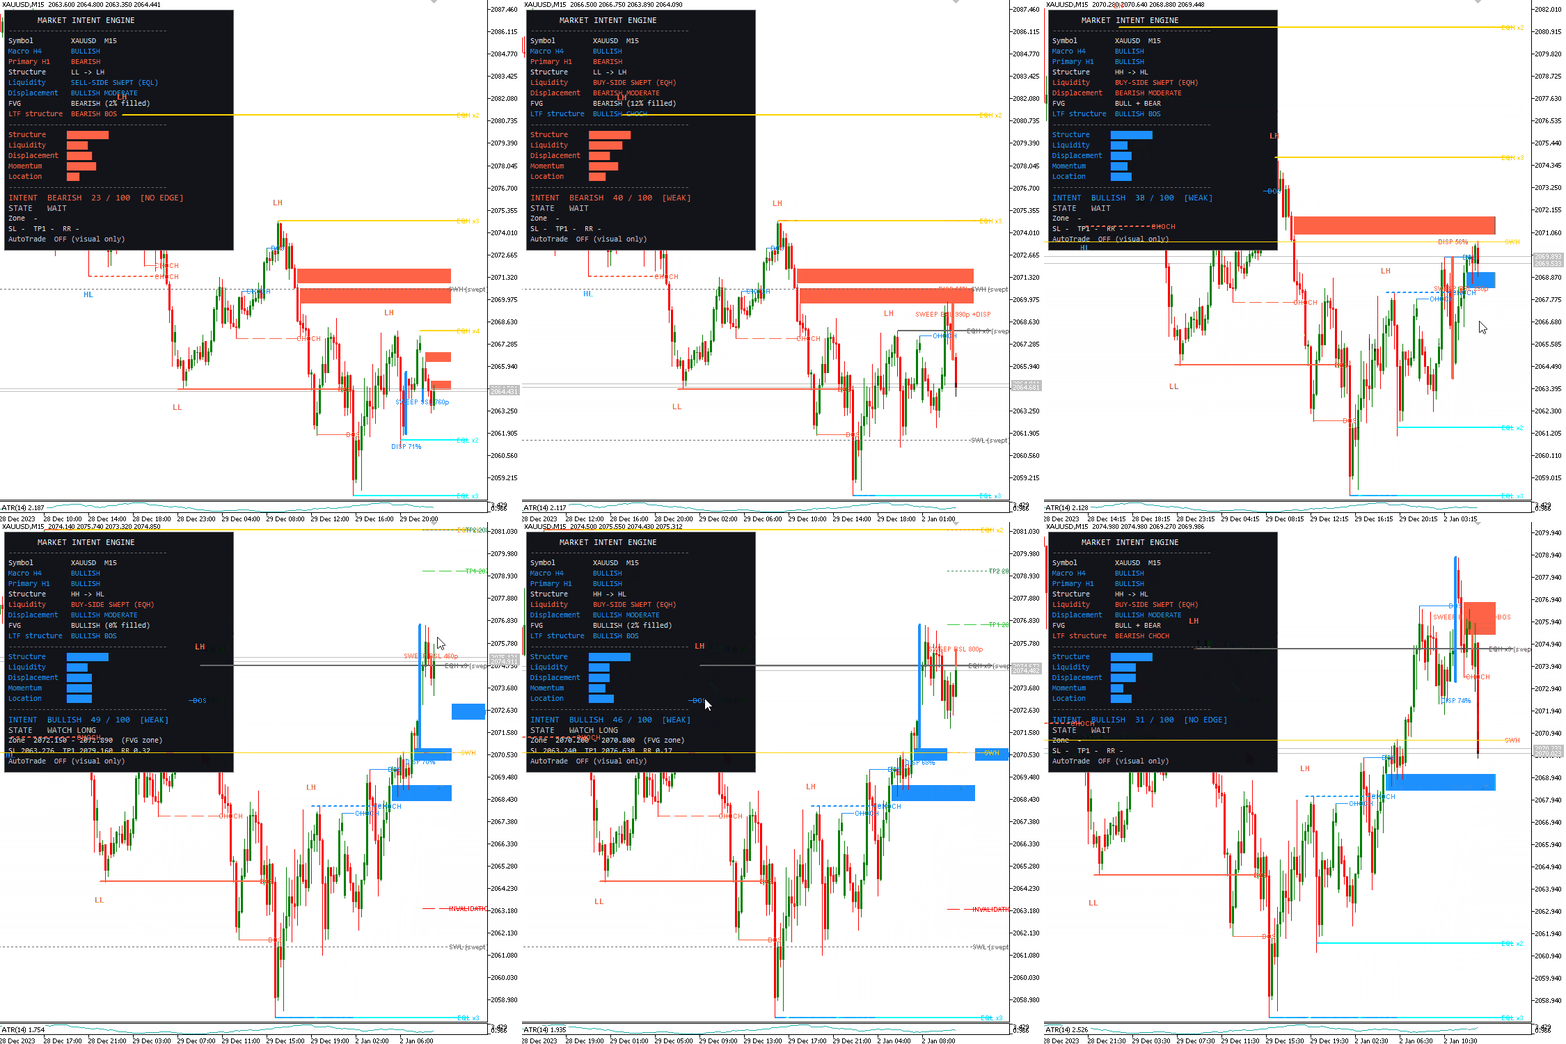
We are showing a demonstration rather than an equity curve, and the reason is that the two would be answering different questions. A tester run measures the compound of everything at once: the intent score, the entry mode, the stop buffer, the trailing rule, the partial close, the spread, and the modeling quality. A weak result would leave us unable to say whether the market reading was wrong or whether the trade management around a sound reading was, and a strong one would flatter the analysis for reasons that might have nothing to do with it.
The demonstration below runs with InpAutoTrade = false, so nothing is sent to the broker, and the whole of what you see is the analysis layer talking. Watch the panel first: the score moves continuously rather than flipping, because each component contributes a graded amount, and a setup that loses its displacement or drifts from discount into premium will visibly bleed points rather than switching off. Follow a full sequence if you can. A liquidity pool starts as a solid line; price reaches it; the line turns dotted gray when taken. The sweep marker prints its side, excursion (points), and +DISP/+BOS tags. Only then does the state move from WAIT to WATCH to ACTION, and the entry zone, invalidation, and targets appear.
Conclusion
Across this article, we built a system that refuses to stop at annotation. We detected swing structure with an explicit confirmation lag, so that the chart the engine draws over history is the chart it could actually have drawn at the time. We classified higher highs, higher lows, lower highs, and lower lows, and we separated breaks of structure from changes of character using nothing more than a memory of the prevailing trend, which made it structurally impossible for the two to be reported together. Not only that, but we captured protected levels at the one instant they were unambiguous and later used them as stop-loss anchors. We built a liquidity map from swings, equal-level clusters and previous session extremes, merged on an ATR-scaled tolerance so that the same defaults behave sensibly across instruments.
Further more, we defined a sweep as a five-part sequence rather than a touch, and graded every one by the reaction that followed it. Not only that, but we measured displacement jointly on range and body, tracked fair value gaps by fill ratio rather than by a binary flag, and fused all of it into two competing weighted totals that resolve through a conflict penalty. Finally, we reduce the score to five decision states. We attach a plan whose entry, invalidation, and targets are drawn from objects the analysis has already found. The system is switchable between a decision-support indicator and a fully automated Expert Advisor via a single boolean.
After reading this work, you will have a working template for turning a discretionary reading into a measurable process. The specific weights and thresholds in this build are a starting point and should be treated as one; they encode our opinions about what matters, and a trader who disagrees can change them from the inputs panel rather than from the source. The durable part is the architecture underneath. Because each stage answers one question and writes into its own structures, any component can be examined, replaced, or switched off without rewriting the surrounding system. The scoring function can be retuned without touching the structure engine. The liquidity map can gain session highs and lows without disturbing the plan builder. That separation is what makes the engine something to build on rather than something to run as-is.
Warning: All rights to these materials are reserved by MetaQuotes Ltd. Copying or reprinting of these materials in whole or in part is prohibited.
This article was written by a user of the site and reflects their personal views. MetaQuotes Ltd is not responsible for the accuracy of the information presented, nor for any consequences resulting from the use of the solutions, strategies or recommendations described.
 Combining 3D Bars, Quantum Computing, and Machine Learning into a Unified Trading System
 Building Your Personal Expert Advisor (Part 2): Risk Management and Dynamic Lot Sizing
 Neural Networks in Trading: Disentangling Structured Components (Conclusion)
 Market Simulation: Position View (XII)

- Free trading apps
- Over 8,000 signals for copying
- Economic news for exploring financial markets
You agree to website policy and terms of use
Hello, could you please tell me which timeframe this EA is loaded into? Is it H4, H1, M15, or M5? Or are all four timeframes loaded?
Additionally, after loading in one timeframe, the metric disappears when switching to another timeframe.