

How to Research a Trading Idea: A Range Breakout Strategy Case Study
 3 396
3 396
 1
1

Introduction
The range breakout strategy was the first trading algorithm I ever developed and used in live trading.
Almost 18 years have passed since then. During that time, the market has changed dramatically: volatility has shifted, new instruments have emerged, price behavior has evolved, and traders’ approaches to market analysis have changed. Many strategies that were once popular have gradually lost their edge, yet the range breakout concept remains widely used today.
Of course, the strategy itself has evolved along with the market. The optimal range definitions, parameters, and instruments have changed as well. However, the core principle remains the same: price spends some time trading within a range, then breaks out of that range and begins a new directional move.
That is why I want to examine the range breakout strategy in this article. Not because I consider it perfect or universally applicable, but because it serves as an excellent example of how to research and validate trading ideas.
I will not spend much time explaining the strategy itself. Plenty of material has already been written on that topic. What is more interesting is the process: turning a trading idea into testable hypotheses, analyzing them on historical data, and drawing conclusions from statistics rather than assumptions.
From Trading Idea to Algorithm
Every trading strategy starts with an idea. This is where concepts such as "buy the breakout," "trade with the trend," or "look for entries after price exits a consolidation range" originate. The problem is that an idea alone cannot be tested. It cannot be evaluated on historical data, compared with alternative approaches, or objectively assessed for its effectiveness.
For an idea to become the subject of research, it must first be formalized. In practice, this means replacing broad concepts with specific rules. It is not enough to say, "We trade range breakouts." We need to define how the range is constructed, over what period it is measured, what constitutes a valid breakout, where stop loss and take profit levels are placed, and how open positions are managed.
It is at this stage that many traders discover that what is commonly referred to as a "range breakout strategy" actually consists of dozens of different variations.
Consider two traders. Both claim to trade range breakouts. However, the first uses the Asian session range and places pending orders just beyond its boundaries. The second defines the range using the first four hours of the trading day and enters a position only after a candle closes outside the range. Formally, both are trading the same idea. In practice, they are using two different trading systems that may produce very different results.
This is why an experienced researcher does not ask, "Does the range breakout strategy work?" The question is too broad to be useful. What matters far more is understanding which factors drive performance. How does the range formation period affect the results? What happens when the size of the range changes? Are there differences between currency pairs and metals? How does the strategy perform under different market conditions?
These are questions that can be tested statistically. In practice, developing a trading system is a sequence of small experiments. We start with an idea, isolate a specific component, and measure its impact on performance. Some assumptions are confirmed by the data, while others turn out to be incorrect. Over time, a collection of hypotheses evolves into a trading system with clearly defined rules and measurable characteristics.
In this article, the range breakout strategy will serve as a framework for studying how different parameters influence performance. This approach provides far more valuable insights than simply searching for a single "optimal" set of settings.
Before moving on to testing, we need to define a baseline model—the simplest possible implementation of a range breakout strategy that will serve as the starting point for further research.
Building a Baseline Strategy
Before moving on to testing, we need to establish a starting point. One of the most common mistakes in trading system research is trying to build a complex strategy with multiple filters and conditions from the outset. When that happens, it becomes difficult to identify which component is actually responsible for the final results.
For this reason, we will use the simplest possible implementation of a range breakout strategy as our baseline model.
At this stage, we are interested only in the core mechanics of the strategy.
- A range is formed over a specified period of time.
- Its upper and lower boundaries are defined.
- Buy stop and sell stop orders are placed just outside the range.
- Once a position is triggered, simple trade management rules are applied: a trailing stop and a time-based exit.
To isolate the effect of the breakout itself, we deliberately exclude volatility filters, trend analysis, news filters, and other commonly used enhancements. Our goal is to determine whether the range breakout concept contains any statistical edge on its own.
If the baseline model shows no signs of robustness, adding more complexity usually leads only to the discovery of random patterns. If, on the other hand, the simple implementation produces stable results, it becomes worthwhile to explore ways of improving it.
Even in this simplified model, there are already several parameters that can significantly influence performance:
- range start time,
- range duration,
- stop loss size,
- take profit size,
- position management rules.
At first glance, these may seem like simple technical settings. In practice, these parameters largely define the strategy's risk profile and performance characteristics.
The researcher's task is therefore not to guess the optimal parameters in advance, but to measure their impact through testing and statistical analysis.
Research Framework
One of the primary goals when developing the research framework was to separate range construction logic from trading logic.
In practice, the same range model can be reused across dozens of different studies. Entry rules, filters, trade management, and risk management techniques may change, while the underlying range construction logic often remains the same.
For this reason, instead of implementing all calculations directly inside the Expert Advisor, a dedicated CBoxSession class was created to handle all range-related operations.
The class encapsulates everything related to range construction: calculating range boundaries, determining start and end times, managing signal expiration, tracking breakouts, and maintaining the current range state.
Main class methods:
- CBoxSession()—Class constructor. Performs initial setup and builds the first available range.
- Tick()—Main processing method. Called on every tick to update range state, monitor signal expiration, and detect breakouts.
- SetGMT()—Updates the GMT offset without recreating the class instance.
- IsReady()—Returns whether the range has been successfully built and is ready for use.
In addition to its methods, the class contains an SB_Box structure that stores all information related to the current range and its state.
enum ENUM_CANCEL_REASON
  {
   SCR_NONE,          // OK
   SCR_EXPIRE,        // Signal expired
   SCR_NOT_TRADE_DAY, // Non-trading day
   SCR_FRIDAY_CANCEL, // Friday cancel
  };
struct SB_Box
  {
   datetime          end_time;                      // rightmost candle open time
   datetime          start_time;                    // leftmost candle open time
   datetime          next_box_time;                 // next box start
   datetime          signal_expire;                 // end_time + expire_minutes
   double            high;                          // box high
   double            low;                           // box low
   bool              upper_cancel;                  // upper side cancelled
   ENUM_CANCEL_REASON upper_cancel_reason;          // upper cancel reason
   bool              lower_cancel;                  // lower side cancelled
   ENUM_CANCEL_REASON lower_cancel_reason;          // lower cancel reason
   bool              upper_entry;                   // upper breakout (set externally)
   bool              lower_entry;                   // lower breakout (set externally)
  };
The structure stores not only the range boundaries but also all state information required for signal management, including breakout status, cancellation flags, and cancellation reasons.
The trading logic accesses all range information through the following object:
This approach allows the same range-building engine to be reused across multiple strategies without modifying the internal implementation. Only the order execution and trade management logic needs to be changed, while the range module remains untouched.
GMT-Based Session Configuration
One of the practical challenges when researching breakout strategies is the dependency on the broker's server time.
For example, if a range is built for the London session starting at 08:00, switching brokers may shift the actual session start by several hours. As a result, parameters often need to be recalibrated for every server.
To solve this issue, all session parameters are defined in GMT.
The user specifies the session start time in GMT, and the class automatically converts it to the broker's server time internally.
void CBoxSession::SetGMT(int _gmt_offset)
  {
   box_hour   = gmt_hour + _gmt_offset;
   if(box_hour >= 24)
      box_hour -= 24;
   if(box_hour < 0)
      box_hour += 24;
   gmt_offset = _gmt_offset;
  }
After the conversion, all calculations are performed using the broker's server time.
This approach keeps the implementation simple while making session settings fully portable across different brokers and server time zones.
The session start time is calculated using the following function:
datetime CBoxSession::BoxStartForDay(datetime day_gmt)
  {
   datetime day_start = day_gmt - (day_gmt % 86400);
   return day_start + box_hour * 3600 + box_minute * 60;
  }
Range Construction
Once the session start time is known, the next step is to calculate the range boundaries.
The main calculation is performed inside the CalcBoxHL() method.
while(counted < box_candles)
  {
   if(i >= iBars(_Symbol, tf))
      return false;
   if(skip_weekend)
     {
      MqlDateTime dt;
      TimeToStruct(iTime(_Symbol, tf, i), dt);
      if(dt.day_of_week == 0 || dt.day_of_week == 6)
        {
         i++;
         continue;
        }
     }
   double bar_high = iHigh(_Symbol, tf, i);
   double bar_low  = iLow(_Symbol,  tf, i);
   if(bar_high >= out_high)
      out_high = bar_high;
   if(bar_low  <= out_low)
      out_low  = bar_low;
   if(counted == box_candles - 1)
      st = iTime(_Symbol, tf, i);
   counted++;
   i++;
  }
The algorithm iterates through the required number of candles and determines the highest high and lowest low within the selected range.
As a result, the range is defined solely by the selected number of bars and can be applied to any trading session.
Handling Weekends and Irregular Trading Sessions
Working with real-world market data often introduces additional challenges.
Different brokers may handle weekend candles differently, CFD instruments can have trading pauses, and some markets do not open exactly at the beginning of a trading day.
To prevent these issues from affecting range calculations, the class can automatically skip weekend bars.
if(skip_weekend)
  {
   MqlDateTime dt;
   TimeToStruct(iTime(_Symbol, tf, i), dt);
   if(dt.day_of_week == 0 || dt.day_of_week == 6)
     {
      i++;
      continue;
     }
  }
In this case, the range is built exclusively from trading bars, regardless of whether weekend candles exist in the historical data.
As a result, the same class can be used across Forex, Gold, Indices, CFDs, and other markets without modifying the range calculation logic.
Using the Class from External Code
Once the range construction logic is isolated into a dedicated class, the trading side of the Expert Advisor becomes significantly simpler.
On every tick, it is sufficient to update the object and verify that the range is ready:
session.Tick(Ask, Bid);
if(!session.IsReady())
return;
The class automatically handled.
- Checking whether a new range needs to be built.
- Updating the current range state.
- Managing signal expiration.
- Monitoring upper and lower breakout events.
Once the range has been built, all information becomes available through the session.box object:
double high = session.box.high;
double low = session.box.low;
The strategy can also update range status flags when required:
session.box.upper_entry = true;
session.box.lower_entry = true;
This architecture completely separates range construction from trading execution. The same CBoxSession class can be reused in different breakout systems, while entry rules, filters, risk management, and trade management logic can be implemented independently.
Choosing the Test Period
Once the research framework is in place, the next question is: what segment of historical data should be used for testing?
Many traders choose the testing period intuitively. Some use the most recent year, others use five years of history, and some simply load all available data. In practice, however, this approach is rarely optimal.
The key criterion when selecting a testing period is not the number of years but the number of trades the strategy generates during that period.
From a statistical perspective, observations are what matter. If a strategy has generated only 50 trades over several years, it is too early to draw meaningful conclusions. At the same time, excessively large samples have their own drawbacks.
Markets are constantly evolving. High-volatility periods alternate with quieter conditions. Liquidity changes, and market participants adapt their behavior. If too much historical data is combined into a single test, the optimization process will start searching for parameters suited to an "average market" that does not actually exist.In practice, when researching range breakout strategies, I use the following rule of thumb.
Practical guideline for sample size:
| Number of Trades | Assessment: |
|---|---|
| Fewer than 100: | Insufficient data; |
| 100–300: | Minimally acceptable; |
| 300–700: | Optimal range; |
| More than 1,000: | Excessive averaging across market regimes. |
For this reason, I typically select the optimization period so that the strategy generates approximately 300 to 700 trades. This provides a sufficiently large sample for statistical analysis while avoiding excessive averaging across different market regimes.
The requirements for forward testing are less stringent. In most cases, 50 to 100 trades are enough to provide an initial indication of whether the observed pattern persists on unseen data.
Position Sizing for Research
Before moving on to optimization, we need to define how position sizing will be calculated. At first glance, position sizing may appear to affect only the size of profits and losses. In practice, however, the chosen position sizing method can significantly influence the outcome of the research.
The most common approach is to risk a fixed percentage of the current account balance. For live trading, this is a perfectly reasonable method. For research purposes, however, it introduces a significant problem. As the account grows, position sizes increase, causing later trades to carry significantly more weight than earlier trades.
As a result, recent trades gradually have a greater influence on the optimization results, while the impact of earlier trades diminishes over time.
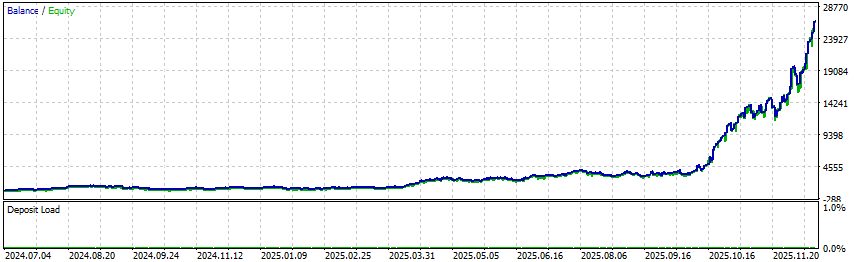
Figure 1. Dynamic position sizing based on a percentage of the current account balance.
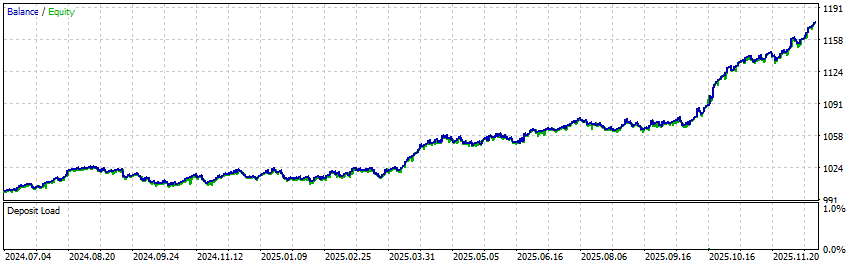
Figure 2. Fixed risk calculated from the initial account balance.
The figures below show the same test performed using dynamic position sizing and a fixed lot size. Notice how, when risking a percentage of the current balance, a substantial drawdown at the beginning of the test period becomes almost invisible.
For this reason, fixed lot sizing is often used when researching trading systems. Under this approach, every trade has the same impact on the final statistics regardless of when it occurred. This makes it possible to evaluate strategy behavior objectively across the entire testing period while eliminating the effects of compounding.
However, this introduces a different problem
In a range breakout strategy, the stop loss is calculated as a multiple of the range size. As a result, the risk measured in points can vary considerably from one trade to another.
If a fixed lot size is used, trades with larger stop-loss values will automatically carry greater monetary risk than trades with smaller stops. As a result, we would be comparing not only strategy parameters but also different levels of risk, introducing a bias into the analysis.
For this reason, the research framework uses a compromise approach. Position size is calculated based on a fixed risk per trade, but that risk is determined from the initial account balance rather than the current balance.
For example, if a test starts with an account balance of $10,000 and a risk level of 2% per trade, position size throughout the entire test will be calculated using a fixed risk amount of $200, regardless of how the account balance changes over time.
This approach keeps risk consistent across trades with different stop-loss distances and removes compounding effects from optimization results
As a result, all trades retain equal statistical weight, and strategy parameters can be compared on a consistent basis.
Preparing Parameters for Optimization
It is equally important to define the optimization ranges and the order in which parameters will be analyzed in advance. In practice, I try to test only those parameter values that are meaningful for the hypothesis being investigated.
For a range breakout strategy, the parameters can naturally be divided into several logical groups.
Range Formation:
- GMT—broker time offset relative to UTC,
- Box start hour (GMT)—hour at which the range formation begins,
- Box size (candles)—range size is measured in bars,
- Order expiration time—pending order expiration time in minutes.
These are usually the first parameters to be investigated, since they define the core trading concept and determine the entry conditions.
The GMT parameter deserves special attention. Strictly speaking, it is not a strategy parameter and should not be included in the optimization process. However, configuring it correctly is essential. The range start time is specified in UTC, so a properly configured GMT offset makes it possible to transfer settings between different brokers without modification and obtain identical results regardless of the broker's server time.
Once a suitable range configuration has been identified, we can move on to analyzing the remaining strategy parameters.
Position Management and Exit Rules:
- Stop Loss, Coefficient from box—stop loss configuration parameters,
- Take Profit, Coefficient from box—profit-taking parameters,
- Break-Even distance, Break-Even profit—break-even management parameters,
- Trailing distance, Trailing minimal profit—trailing stop management parameters,
- Check After (minutes), Minimum Profit to Exit (points)—parameters for time-based early position closure.
Over the years, I have developed a research framework for analyzing range breakout strategies. It describes the recommended order of parameter optimization, suggested testing ranges, and identifies which parameters should be analyzed together and which are best studied separately.
Throughout this article, we will follow that framework. If you plan to conduct your own research, I recommend reviewing the guide included with the Universal Breakout Study research framework.
Research Principles and Configuration Selection
Once the parameters to be studied have been defined and the optimization ranges have been prepared, we can move on to the testing phase.
At this stage, it is important to understand that my goal is not to find a single optimal set of parameters. What matters far more is determining whether the strategy exhibits any statistical edge on the selected instrument.
First Test: Searching for a Statistical Edge
The first large-scale optimization is usually performed on the range formation parameters.
For example, range start time and range size are measured in bars.
All other parameters are kept in their simplest possible configuration.
Once the optimization is complete, I do not focus on the best individual result. Instead, I examine the overall distribution of outcomes.
If only a handful of profitable configurations emerge from several hundred or several thousand optimization runs, that is a warning sign.
In such situations, there are usually two possible explanations: the strategy is poorly suited to the instrument being tested, or the model parameters require further refinement.
For this reason, I avoid drawing conclusions based on a single test.
Instead, I typically conduct several additional experiments:
- Increase the stop-loss,
- decrease the stop-loss,
- enable a trailing stop,
- reduce the pending order expiration time,
- modify selected position management parameters.
If, after several such experiments, the number of viable configurations remains minimal, I simply exclude that instrument from further research.
Not all instruments are equally suitable for breakout strategies
For example, in my tests, USDCHF has consistently produced weak results. Following a breakout, price often fails to develop sustained momentum and quickly reverses back into the range. As a result, even after multiple parameter adjustments, it is difficult to obtain a robust model.
In such cases, it is far more productive to move on to another instrument than to force a strategy onto a market that does not naturally support it.
Selecting Promising Range Configurations
At this stage, it is important to understand that we are not interested in individual parameter settings but in distinct trading concepts.
Examples of optimization result distributions are shown in Figures 3 and 4.
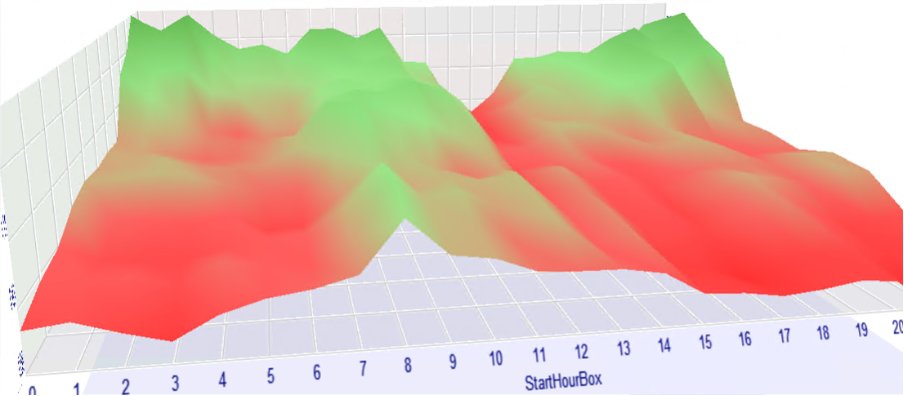
Figure 3. Distribution of optimization results during the initial study of range formation parameters.
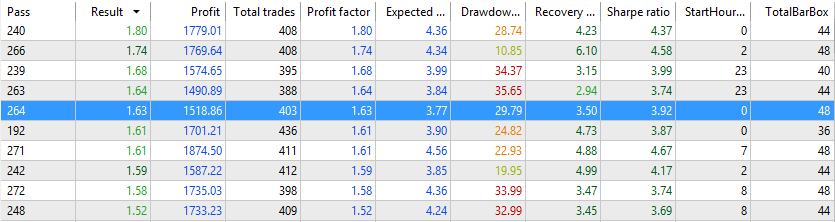
Figure 4. Optimization results were used to identify promising range configurations for further analysis.
Suppose the optimization identifies the following configurations as promising:
- Start time 00:00, range size 44 bars;
- start time 08:00, range size 48 bars;
- start time 08:00, range size 8 bars.
Each of these configurations represents a fundamentally different range structure and therefore deserves to be studied separately.
By contrast, there is little value in selecting both of the following.
- Start time 00:00, range size 44 bars,
- start time 00:00, range size 48 bars.
Most likely, these configurations describe nearly the same range and will exhibit very similar behavior.
For this reason, I prefer to select several distinct trading structures rather than dozens of nearly identical parameter combinations that differ only marginally.
Once the most interesting range configurations have been selected, optimization of the remaining strategy parameters can begin.
Practical Optimization Example
As an example, let us consider a range that begins at 00:00 UTC and spans 48 hourly bars. In practice, this represents a two-day trading range—a fairly logical structure for a breakout strategy.
Stop Loss Optimization
The first step is to test the stop loss coefficient as a multiple of the range size, using values from 0.14 to 1.2.
I prefer to use dynamic stop-loss and take-profit levels linked to the size of the range. This approach automatically adapts to current market volatility and eliminates the need to continuously adjust fixed values as market conditions change
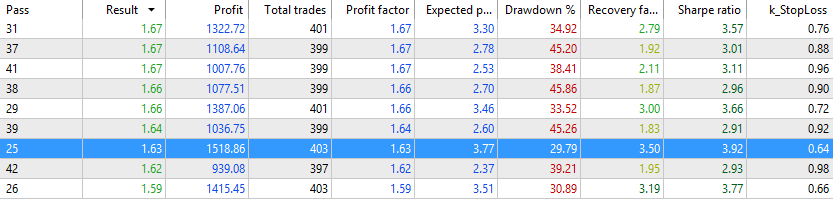
Figure 5. Stop loss optimization results for the selected range configuration.
When selecting a stop loss value, it is important to look beyond profitability alone. The smaller the stop, the larger the position size, and the higher the potential return. However, tighter stops also lead to more frequent stop-outs and potentially larger drawdowns.
For this reason, I evaluate a combination of metrics: profitability, drawdown, recovery factor, and only then absolute profit.
In this case, the optimal value was a coefficient of 0.64, which also aligns well with the idea of placing the stop slightly beyond the 0.618 Fibonacci level.
Take Profit Optimization
Next, we examine the take profit coefficient over a range from 0.2 to 1.6 times the range size.

Figure 6. Take profit optimization results for the selected range configuration.
A take profit coefficient of 1.0 proved to be the most balanced solution. While some alternatives generated higher profits, this configuration delivered the best overall combination of performance characteristics.
Break-Even Optimization
The next step is to test the break-even parameters.

Figure 7. Optimization of break-even parameters.
The best results were achieved by moving the stop loss to break-even after the price had moved 22 points in favor of the position while locking in a profit of 10 points.
Trailing Stop Optimization
We then move on to analyzing the trailing stop parameters.

Figure 8. Optimization of trailing stop parameters.
The most interesting configuration consisted of a trailing distance of 23 points and a minimum profit threshold of 10 points.
In practice, once the position reaches a profit of 10 points, the stop loss begins trailing the price at a distance of 23 points.
Time-Based Exit Filter
The next step is to analyze one of my favorite filters: forced position closure after a specified period of time, provided that a minimum profit has been achieved.
The idea is straightforward. If the market fails to develop momentum within the first few hours after a breakout, the probability of reaching the take profit level decreases significantly. In such situations, it is often more efficient to lock in a small profit and free up capital for future opportunities.

Figure 9. Optimization of the time-based exit filter.
Based on the test results, I selected a configuration that closes positions after 40 minutes if at least 2 points of profit are available. This was not the most profitable configuration in absolute terms, but it delivered higher overall robustness, lower drawdown, and a superior recovery factor.
Let us compare the two most interesting configurations.
Market_Minute = 40, Close_Level = 2.
- Profit: 1,906 USD
- Profit Factor: 1.97
- Drawdown: 11.59%
- Recovery Factor: 6.20
- Sharpe Ratio: 5.4
Market_Minute = 20, Close_Level = 10.
- Profit: 2,194 USD
- Profit Factor: 1.47
- Drawdown: 39.78%
- Recovery Factor: 4.61
- Sharpe Ratio: 2.83
Despite producing lower total profit, the first configuration appears significantly more robust. Moreover, because it operates with a lower drawdown, the risk per trade can be increased, potentially resulting in comparable or even higher returns at a similar overall risk level.
This example clearly demonstrates why profit alone should not be the primary criterion when selecting strategy parameters.
Weekday Filter
The final step is to test the impact of filtering trades by day of the week.
Excluding Tuesday has almost no effect on total profit but noticeably improves the system's robustness metrics.
For this reason, the filter was included in the final configuration.
The result is a reasonably stable model with a favorable risk-to-return profile, making it a suitable candidate for forward testing on out-of-sample data.
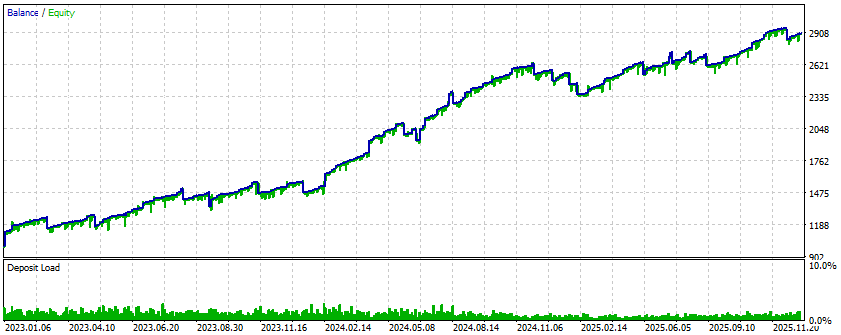
Figure 10. Final optimization results after parameter selection.
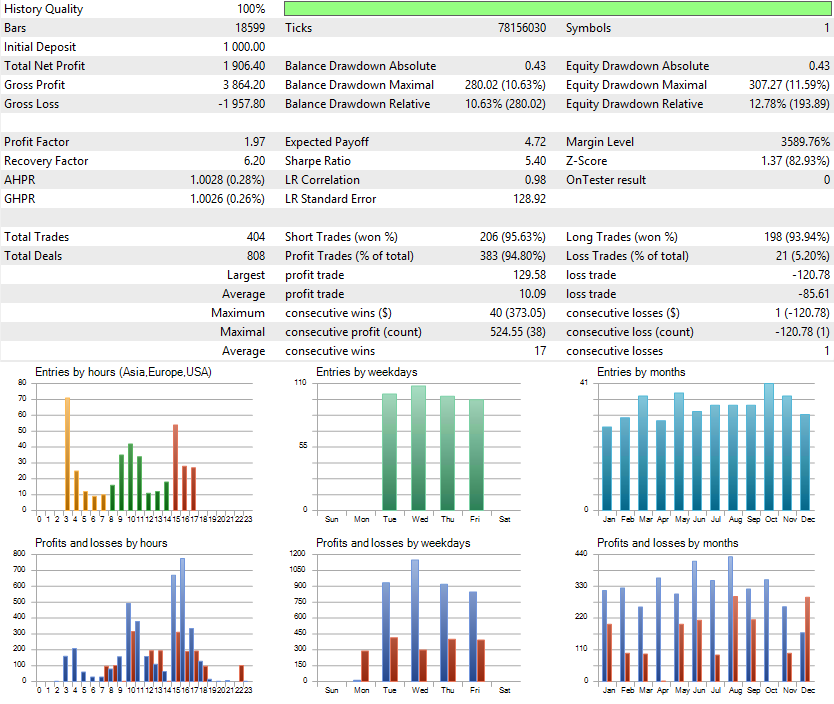
Figure 11. Backtest results of the optimized range breakout strategy.
Forward Testing
Once the optimization phase is complete, the most important stage of the research begins: validating the results on unseen data.
For this experiment, the parameters were optimized using historical data from 2023 to 2026. The forward test was then conducted on the remaining 2026 data that had not been included in the optimization process.
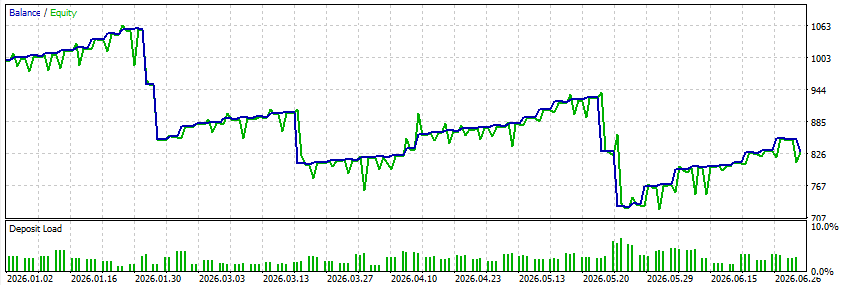
Figure 12. Forward test results on out-of-sample data that were not used during optimization.
To be honest, the outcome was somewhat mixed. The forward test did not replicate the level of performance observed during optimization, but neither did it indicate a complete breakdown of the model.
Situations like this are quite common. The current drawdown may simply represent a normal period of underperformance that will eventually be offset by future trades. However, another possibility cannot be ruled out: part of the observed edge may have disappeared as market conditions evolved.
This is precisely why forward testing is so important. Its purpose is not to confirm expectations but to assess how robust the pattern is on data the strategy has never seen before.
It is still too early to draw definitive conclusions. Five months of observations are not sufficient for a meaningful statistical assessment. Nevertheless, the result already provides valuable information: the selected configuration requires further monitoring and additional validation on new data.
This is what the research process looks like in practice. We do not try to prove that a strategy must work. We test a hypothesis, document the outcome, and use the evidence to decide whether further investigation is warranted.
Conclusion
Using a relatively simple range breakout strategy as an example, we have walked through the entire process of researching a trading idea, from formalizing the rules and building a baseline model to optimizing parameters and validating the results on unseen data.
The forward test itself produced mixed results. However, outcomes like these are often the most valuable. They serve as a reminder that the purpose of research is not to find an impressive backtest report or a perfect set of parameters, but to obtain objective answers to clearly defined questions.
Markets are constantly evolving, which means that any research represents only a snapshot of market behavior at a particular time. A year from now, the results may look very different. New data will become available, new ideas will emerge, and new questions will arise.
But if the research process is properly structured, this is not a problem. At any point, we can return to testing, evaluate a new hypothesis, and make decisions based on evidence rather than assumptions.
Of course, the possibilities for further research do not end here. In this article, we examined only a baseline version of the strategy. The same approach can be applied to more advanced components of a trading system.
- Studying the impact of volatility,
- modifying the range formation rules,
- analyzing additional trade selection criteria,
- exploring alternative position management techniques,
- investigating trailing stops based on market profile analysis.
The most important outcome of this article is therefore not the specific parameters or the final strategy configuration.
What matters far more is understanding the research process itself—a process that allows traders to independently generate, test, and evaluate trading ideas in an ever-changing market environment.
| File Name | Description |
|---|---|
| Universal_Breakout_Study.mq5 | The Expert Advisor main file |
| CBoxSession.mqh | Include file (MQL5/Include/) with the basic logic of working with the range |
| Universal Breakout Research Guide.pdf | Guide to testing and optimizing the Universal Breakout Expert Advisor |
Warning: All rights to these materials are reserved by MetaQuotes Ltd. Copying or reprinting of these materials in whole or in part is prohibited.
This article was written by a user of the site and reflects their personal views. MetaQuotes Ltd is not responsible for the accuracy of the information presented, nor for any consequences resulting from the use of the solutions, strategies or recommendations described.

 Developing a Multi-Currency Expert Advisor (Part 29): Improving the Conveyor
 Exporting MetaTrader 5 Open Positions to a Live-Refreshing HTML Dashboard
 Automating Classic Market Methods in MQL5 (Part 4): Mark Minervini's Trend Template
 Where should your stop-loss really sit? An MAE/MFE excursion analyzer in MQL5

- Free trading apps
- Over 8,000 signals for copying
- Economic news for exploring financial markets
You agree to website policy and terms of use
I agree, you described the process of formation from ideas to implementation into reality perfectly!
Automatic translation was applied by a moderator. Please post in the language of the forum section you selected.