

Creating a Profit Concentration Analyzer in MQL5
 1 296
1 296
 0
0

Introduction
Early in my testing I had a strategy that looked excellent on paper: a healthy net profit, a profit factor close to 2, and a win rate above half. Then I sorted its trades by result and noticed something uncomfortable. Three trades, out of more than two hundred, had produced most of the year's profit. Remove those three, and the system was close to flat. The equity curve had not lied to me, but it had told me far less than I assumed.
This article asks a single question: when a strategy makes money, where does that money come from? Net profit treats every dollar the same. It does not show whether profits came from many small wins or from one exceptional trade that may never repeat. Two strategies can post an identical net profit and an identical win rate, while one has a broad, repeatable edge and the other has simply caught a few large moves.
In this article, we will build a script that reads a list of closed trades and measures how concentrated the profit is. By the end, you will have a working analyzer that:
- Reconstructs the profit distribution and reports the share contributed by the largest trades.
- Computes the Gini coefficient of the winning trades, a single number for how unequal the gains are.
- Runs an outlier-dependent stress test that removes the best few winning trades and recomputes the result to see whether the edge is broad or rests on a handful of outliers.
- Aggregates trades by day and checks the largest day against a prop-firm consistency limit.
- Combines these into a single concentration-and-consistency score, graded from A+ to F, with written recommendations.
Everything runs natively inside MetaTrader 5. There are no external libraries, no Python, and no machine learning. The whole tool is a single MQL5 script plus a small helper that exports the trades from a backtest.
Why Net Profit and Win Rate Are Not Enough
Net profit and win rate are the first numbers most traders look at, and both can be high while the system is fragile. Consider two strategies that finish a test with the same net profit over the same 200 trades:
- Strategy A wins a little more often than it loses, and its winners are similar in size. No single trade is responsible for more than a small slice of the total.
- Strategy B shows the same headline figures, but four trades account for 70% of the profit. The other 196 trades, taken together, barely break even.
On the report, they are twins. In practice, Strategy A has an edge that appears again and again, while Strategy B has caught a few large moves that may not return. Had those four trades been filled a little worse or missed altogether, Strategy B would be a losing system. The net profit is real, but it is not evidence of a repeatable process.
The same logic applies across time rather than across trades. An account that earns most of its profit on one explosive day can still fail a funded-account consistency rule, which caps how much of the total may come from a single day. A strategy can clear its profit target and be rejected anyway because the profit was not spread out. Measuring concentration tells you, before you risk real capital, whether the result is broad enough to trust.

Fig. 1. A few large trades can account for most of the net profit.
What a Concentration Analysis Measures
Before writing code, we need to define the measurements the analyzer reports.
Top-N share. The simplest measure of concentration is the share of the net profit produced by the N largest trades:
Top-N share = (sum of the N largest trade results) / (net profit) * 100%
If five trades out of two hundred account for 60% of the net profit, the result leans heavily on those five. Because the denominator is net profit, this value can exceed 100% when net profit is small relative to the winners; in that case it is read as a dependency ratio rather than a literal share. To keep it bounded and easy to compare, the analyzer also reports the same top-N figure as a share of gross profit, which always falls between 0% and 100%.
Gini coefficient. Borrowed from economics, where Corrado Gini introduced it in 1912 to measure income inequality, the Gini coefficient summarizes how unevenly the gains are distributed across the winning trades in a single number from 0 to 1. A value near 0 means every winner contributed about the same; a value near 1 means one trade holds almost all the gains. For winning results w sorted in ascending order, with n winners:
Gini = (2 * Sum(i * w_i)) / (n * Sum(w_i)) - (n + 1) / n
Here, i is the rank of each winner, from 1 to n. The Gini coefficient is useful because it does not depend on the account size or the number of trades, so it compares cleanly across strategies. It is computed on the winning trades by design: the question here is not whether results differ between wins and losses, but whether the gains themselves are concentrated in a small subset of winners.
The outlier-dependent stress test. The most direct question is also the most revealing: if the best few trades had not happened, would the strategy still be profitable? The test removes the largest K winning trades, where K is a small percentage of the winners, and recomputes the net profit and the profit factor. A strategy whose profit barely changes is broad-based; one whose profit collapses leans on a handful of outliers. This is a deliberately one-sided sensitivity check: only the best winners are removed while every loser stays, so the profit factor is expected to drop. It measures dependence on a handful of exceptional trades, not a neutral resampling of the whole record. As a quick illustration, two strategies with the same net profit can look very different: one might keep 82% of its profit after the best five trades are removed, while the other keeps only 21%—the first is broad-based, the second hangs on a few trades.
Day consistency. Finally, the analyzer groups trades by calendar day and finds the most profitable day. Its share of the total is compared against a configurable limit, mirroring the consistency rule that funded-account programs apply.
The denominators differ by metric on purpose. The top-N share and the largest-day share are measured against net profit because they answer how much of the final result depends on a few events. The Gini coefficient and the concentration profile use the winning trades and gross profit because they describe the internal distribution of the gains rather than the bottom line after losses. Reading each metric against the right base is what keeps the picture consistent.

Fig. 2. The concentration curve: how much of the profit the largest winners produce.
Architecture of the Profit Concentration Analyzer
The solution is a single MQL5 script organized into four modules, supported by one helper script:
- Trade Loader: reads the per-trade results from a CSV file.
- Concentration Engine: computes the top-N share, the Gini coefficient, the concentration profile, and the outlier-dependent stress test.
- Day Consistency: aggregates trades by day and checks the largest day against the limit.
- Scoring: combines the measurements into a weighted score and a grade, then prints recommendations.
We will build each module in turn and then assemble them. The analyzer expects a CSV file with one row per closing deal and two columns: the date and the result of that deal. A trade closed in a single deal is one row; a trade closed in several partial exits appears as several rows.
Module 1: The Trade Loader
We begin with the script properties, the inputs, and the structures the tool uses. One structure holds the aggregated report; a small structure holds a single day during the consistency step.
//--- Input parameters
input string InpFileName         = "Trades.csv"; // CSV file: Date,Profit (one row per closing deal)
input double InpConsistencyLimit = 20.0;         // Prop-firm largest-day limit (% of total profit)
input int    InpTopN             = 5;            // Top-N trades used for the concentration figures
input double InpRemovePct        = 5.0;          // Stress test: remove this % of best winners (0 = none)
input double InpWeightConc       = 0.40;         // Weight: concentration dimension
input double InpWeightConsist    = 0.35;         // Weight: day-consistency dimension
input double InpWeightSurv       = 0.25;         // Weight: outlier-dependence dimension
input double InpConcFactor       = 1.4;          // Concentration score: points lost per 1% of top-N net share above 25
input double InpConsistFactor    = 2.5;          // Consistency score: points lost per 1% of best day above the limit
//--- Aggregated report: every figure the analyzer prints lives here
struct SReport
  {
   int    nTrades;                               // total trades loaded from the file
   int    nWinners;                              // trades with a positive result
   int    nLosers;                               // trades with a negative result
   int    nFlat;                                 // trades with exactly zero result
   double netProfit;                             // gross profit minus gross loss
   double grossProfit;                           // sum of the winning trades
   double grossLoss;                             // sum of the losing trades, stored as a positive number
   double profitFactor;                          // gross profit / gross loss; -1.0 means undefined (no losing trades)
   double winRate;                               // winners as a percentage of all trades
   double gini;                                  // Gini coefficient of the winning trades (0 = even, 1 = concentrated)
   double topNShare;                             // top-N trades as % of net profit
   double topNShareGross;                        // top-N trades as % of gross profit
   double bestDayShare;                          // largest profitable day as % of net profit
   string bestDay;                               // date of that largest profitable day
   double survivalRatio;                         // net after removing the best K winners / net before (0..1)
   double netAfterRemove;                        // net profit left after the stress test
   double pfAfterRemove;                         // profit factor after the stress test; -1.0 means no losing trades left
   int    removedCount;                          // number of winning trades removed by the stress test
   double concScore;                             // concentration dimension of the score, 0..100
   double consistScore;                          // day-consistency dimension of the score, 0..100
   double survScore;                             // outlier-dependence dimension of the score, 0..100
   double composite;                             // weighted composite score, 0..100
   string grade;                                 // letter grade from A+ to F
  };
//--- Per-day aggregation: one calendar day and its summed result
struct SDay
  {
   string d;                                     // the date, as text
   double pnl;                                   // the day's total profit or loss
  };
//--- Globals
double g_profit[];                               // result of each loaded trade
string g_date[];                                 // date of each loaded trade
int    g_n = 0;                                  // number of trades currently loaded
The loader opens the file, skips the header, and reads each row into a profit array and a parallel date array, following the standard MQL5 file pattern: open the file as text, read each line, and split it on the comma into a date and a result.
//+------------------------------------------------------------------+
//| Read a Date,Profit file (one row per closing deal)               |
//| Read as text and split each row on the comma, which tolerates    |
//| blank lines and stray spaces better than field-by-field reading. |
//+------------------------------------------------------------------+
bool LoadTrades(string filename, double &profit[], string &dates[])
  {
   int handle = FileOpen(filename, FILE_READ|FILE_TXT|FILE_ANSI);
   if(handle == INVALID_HANDLE)
     {
      PrintFormat("Could not open %s. Error: %d", filename, GetLastError());
      return false;
     }
   int  count = 0;
   bool firstLine = true;
   while(!FileIsEnding(handle))
     {
      //--- Read one whole line and trim the surrounding whitespace
      string row = FileReadString(handle);
      StringTrimLeft(row);
      StringTrimRight(row);
      if(firstLine)                   // the first line is the header
        {
         firstLine = false;
         continue;
        }
      if(row == "")                   // skip blank lines
         continue;
      //--- Split "Date,Profit" into its two fields
      string parts[];
      if(StringSplit(row, ',', parts) < 2)
         continue;                    // not enough columns: skip the row
      StringTrimLeft(parts[0]);
      StringTrimRight(parts[0]);
      if(StringToTime(parts[0]) <= 0) // skip rows whose date does not parse
         continue;
      double value = StringToDouble(parts[1]);
      //--- Store the parsed trade
      count++;
      ArrayResize(profit, count, 512);
      ArrayResize(dates, count, 512);
      profit[count - 1] = value;
      dates[count - 1]  = parts[0];
     }
   FileClose(handle);
   return (count > 0);
  }
Reading only the date and the result keeps the input small. The same file works whether the trades came from the Strategy Tester or from a live account.
Module 2: The Concentration Engine
This module answers the core question. We start with the Gini coefficient of the winning trades. The function gathers the positive results, sorts them, and applies the formula from the previous section.
//+------------------------------------------------------------------+
//| Gini coefficient of the winning trades (gain concentration)      |
//+------------------------------------------------------------------+
double GiniWinners(const double &profit[], int n)
  {
   //--- Collect the winning trades into w[]
   double w[];
   int m = 0;
   for(int i = 0; i < n; i++)
      if(profit[i] > 0.0)
        {
         m++;
         ArrayResize(w, m);
         w[m - 1] = profit[i];
        }
   if(m < 2)
      return 0.0;                         // need at least two winners to measure inequality
   ArraySort(w);                          // ascending order, required by the formula
   //--- Sum of the winners and the rank-weighted sum
   double sumw = 0.0;
   for(int i = 0; i < m; i++)
      sumw += w[i];
   if(sumw <= 0.0)
      return 0.0;
   double weighted = 0.0;
   for(int i = 0; i < m; i++)
      weighted += (double)(i + 1) * w[i]; // rank (1..m) times value
   //--- Standard Gini formula for sorted positive values
   return (2.0 * weighted) / (m * sumw) - (double)(m + 1) / m;
  }
Next comes the share held by the N largest trades, computed two ways. Against net profit, it shows how much of the final result rides on a few trades; against gross profit, it stays bounded between 0% and 100% and is easier to read across strategies. Both copy the results, sort them, and add up the top N.
//+------------------------------------------------------------------+
//| Share of net profit produced by the N largest trades (percent)   |
//+------------------------------------------------------------------+
double TopNShareOfNet(const double &profit[], int n, int N, double net)
  {
   if(net <= 0.0 || n <= 0)
      return 0.0; // the share needs a positive net profit
   //--- Work on a sorted copy so the original order is preserved
   double a[];
   ArrayResize(a, n);
   ArrayCopy(a, profit);
   ArraySort(a);  // ascending: the largest trades sit at the end
   //--- Add up the N largest results, reading from the end
   double s = 0.0;
   int    cnt = 0;
   for(int i = n - 1; i >= 0 && cnt < N; i--)
     {
      s += a[i];
      cnt++;
     }
   return s / net * 100.0;
  }
//+------------------------------------------------------------------+
//| Share of gross profit produced by the N largest winners (pct)    |
//| Bounded 0..100%, unlike the net version which can exceed 100%.   |
//+------------------------------------------------------------------+
double TopNShareOfGross(const double &profit[], int n, int N, double grossProfit)
  {
   if(grossProfit <= 0.0 || n <= 0)
      return 0.0;
   double a[];
   ArrayResize(a, n);
   ArrayCopy(a, profit);
   ArraySort(a); // ascending, largest at the end
   //--- Sum only the positive trades among the N largest
   double s = 0.0;
   int    cnt = 0;
   for(int i = n - 1; i >= 0 && cnt < N; i--)
     {
      if(a[i] > 0.0)
         s += a[i];
      cnt++;
     }
   return s / grossProfit * 100.0;
  }
The outlier-dependent stress test uses the same sorted list. It removes only the K largest winners, keeps all losing trades, and recomputes gross profit, gross loss, and profit factor. Because the removal is one-sided, the profit factor is expected to fall; what matters is by how much.
//+------------------------------------------------------------------+
//| Net profit and profit factor after removing the K best winners   |
//| Only the K largest strictly-positive trades are removed; all     |
//| losers stay, so this is a one-sided outlier-dependence test.     |
//+------------------------------------------------------------------+
double NetAfterRemoveTopWinners(const double &profit[], int n, int K, double &pfAfter)
  {
   double a[];
   ArrayResize(a, n);
   ArrayCopy(a, profit);
   ArraySort(a);                          // ascending; largest values are at the end
   //--- Walk from the largest down, dropping the first K winners
   int    removed = 0;
   double gp = 0.0, gl = 0.0;
   for(int i = n - 1; i >= 0; i--)
     {
      if(a[i] > 0.0 && removed < K)       // drop this winner and move on
        {
         removed++;
         continue;
        }
      if(a[i] > 0.0)                      // keep the remaining winners
         gp += a[i];
      else if(a[i] < 0.0)                 // and all of the losers
         gl += -a[i];
     }
   pfAfter = (gl > 0.0) ? gp / gl : -1.0; // -1 means no losing trades remain
   return gp - gl;
  }
To make the shape of the distribution visible at a glance, the engine also prints a concentration profile: how much of the gross profit comes from the top 1%, 5%, 10%, and so on of the winning trades. This is the text equivalent of the curve in Fig. 2.
//+------------------------------------------------------------------+
//| Print the concentration profile (cumulative share of winners)    |
//+------------------------------------------------------------------+
void PrintConcentrationProfile(const double &profit[], int n, double grossProfit)
  {
   //--- Collect and sort the winning trades
   double w[];
   int m = 0;
   for(int i = 0; i < n; i++)
      if(profit[i] > 0.0)
        {
         m++;
         ArrayResize(w, m);
         w[m - 1] = profit[i];
        }
   if(m < 1 || grossProfit <= 0.0)
     {
      Print("No winning trades to profile.");
      return;
     }
   ArraySort(w); // ascending; reverse-read for the largest first
   //--- For each tier, sum the largest "take" winners and show their share
   double tiers[] = {1.0, 5.0, 10.0, 25.0, 50.0, 100.0};
   Print("Concentration profile (share of gross profit from the largest winners):");
   for(int t = 0; t < ArraySize(tiers); t++)
     {
      int take = (int)MathCeil(m * tiers[t] / 100.0);
      if(take < 1)
         take = 1;
      if(take > m)
         take = m;
      double s = 0.0;
      for(int i = m - 1; i >= m - take; i--)
         s += w[i];
      PrintFormat("  Top %5.0f%% of winners  ->  %5.1f%% of gross profit", tiers[t], s / grossProfit * 100.0);
     }
  }
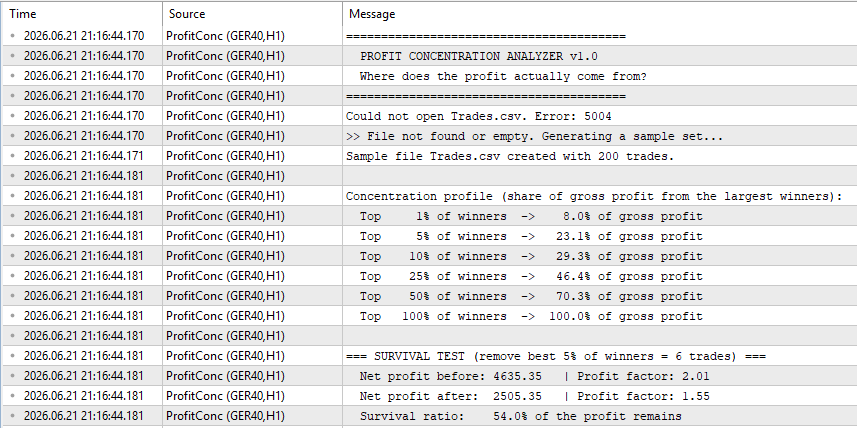
Fig. 3. Concentration profile and outlier-dependent stress test in the Experts tab.
Module 3: Day Consistency
The consistency check aggregates the trades by calendar day. The function below scans the trades and accumulates the result of each distinct date into a small array of days.
//+------------------------------------------------------------------+
//| Aggregate trades by calendar day                                 |
//| Simple O(n*d) aggregation; fine for the typical few-hundred to   |
//| few-thousand trades. For very large sets, sort by date first.    |
//+------------------------------------------------------------------+
int BuildDays(const double &profit[], const string &dates[], int n, SDay &days[])
  {
   int nd = 0;
   ArrayResize(days, 0);
   for(int i = 0; i < n; i++)
     {
      //--- Find the day this trade belongs to, if it already exists
      int idx = -1;
      for(int k = 0; k < nd; k++)
         if(days[k].d == dates[i])
           {
            idx = k;
            break;
           }
      if(idx < 0)                 // first trade of a new day: add it
        {
         nd++;
         ArrayResize(days, nd);
         days[nd - 1].d   = dates[i];
         days[nd - 1].pnl = 0.0;
         idx = nd - 1;
        }
      days[idx].pnl += profit[i]; // accumulate the day's result
     }
   return nd;
  }
With the days collected, the largest profitable day is found, and its share of the net profit is compared against the limit. A share above the limit is the pattern that fails a funded-account consistency rule, even when the total profit is well above target.
Module 4: The Score
The final module condenses everything into one number across three dimensions:
- Concentration (40%), driven by the top-N share. A lower share scores higher.
- Consistency (35%), driven by the largest day versus the limit. A day within the limit scores full marks.
- Survival (25%), driven by how much of the profit remains after the best trades are removed.
Each dimension is mapped to a 0–100 scale, combined with its weight, and translated into a letter grade. The weights are inputs, so a prop-firm trader who cares most about the consistency rule can raise that weight.
This composite is intentionally heuristic. It is meant for ranking and quick comparison, not as a statistically validated measure. The weights, the per-dimension scaling factors, and the A+ to F boundaries are configurable defaults, so the grade is most meaningful when comparing strategies tested the same way rather than as an absolute verdict.
//+------------------------------------------------------------------+
//| Build the full report from the loaded trades                     |
//+------------------------------------------------------------------+
void BuildReport(const double &profit[], const string &dates[], int n, SReport &r)
  {
   //--- Tally winners, losers, flats and the gross figures
   r.nTrades     = n;
   r.nWinners    = 0;
   r.nLosers     = 0;
   r.nFlat       = 0;
   r.grossProfit = 0.0;
   r.grossLoss   = 0.0;
   for(int i = 0; i < n; i++)
     {
      if(profit[i] > 0.0)
        {
         r.nWinners++;
         r.grossProfit += profit[i];
        }
      else if(profit[i] < 0.0)
        {
         r.nLosers++;
         r.grossLoss += -profit[i];
        }
      else
         r.nFlat++;
     }
   //--- Core ratios
   r.netProfit    = r.grossProfit - r.grossLoss;
   r.profitFactor = (r.grossLoss > 0.0) ? r.grossProfit / r.grossLoss : -1.0; // -1 = undefined
   r.winRate      = (n > 0) ? 100.0 * r.nWinners / n : 0.0;
   //--- Concentration measures
   r.gini           = GiniWinners(profit, n);
   r.topNShare      = TopNShareOfNet(profit, n, InpTopN, r.netProfit);
   r.topNShareGross = TopNShareOfGross(profit, n, InpTopN, r.grossProfit);
   //--- Day aggregation and the largest profitable day
   SDay days[];
   int nd = BuildDays(profit, dates, n, days);
   double bestDay = 0.0;
   r.bestDay = "-";
   for(int k = 0; k < nd; k++)
      if(days[k].pnl > bestDay)
        {
         bestDay   = days[k].pnl;
         r.bestDay = days[k].d;
        }
   r.bestDayShare = (r.netProfit > 0.0) ? bestDay / r.netProfit * 100.0 : 0.0;
   //--- Outlier-dependence stress test: remove the best InpRemovePct% of winners
   r.removedCount = (InpRemovePct <= 0.0) ? 0 : (int)MathMax(1.0, MathCeil(r.nWinners * InpRemovePct / 100.0));
   if(r.removedCount > 0)
     {
      r.netAfterRemove = NetAfterRemoveTopWinners(profit, n, r.removedCount, r.pfAfterRemove);
      r.survivalRatio  = (r.netProfit > 0.0) ? r.netAfterRemove / r.netProfit : 0.0;
     }
   else                                                                       // removing nothing leaves the figures unchanged
     {
      r.netAfterRemove = r.netProfit;
      r.pfAfterRemove  = r.profitFactor;
      r.survivalRatio  = 1.0;
     }
   //--- Dimension scores (higher means broader, more repeatable profit). Factors are inputs.
   r.concScore    = MathMax(0.0, 100.0 - MathMax(0.0, r.topNShare - 25.0) * InpConcFactor);
   r.consistScore = MathMax(0.0, 100.0 - MathMax(0.0, r.bestDayShare - InpConsistencyLimit) * InpConsistFactor);
   r.survScore    = MathMax(0.0, MathMin(100.0, r.survivalRatio * 100.0));
   //--- Normalize the weights so the result does not depend on their sum
   double wc = MathMax(0.0, InpWeightConc);
   double wk = MathMax(0.0, InpWeightConsist);
   double ws = MathMax(0.0, InpWeightSurv);
   double wsum = wc + wk + ws;
   if(wsum <= 0.0)
     {
      wc = 0.40; wk = 0.35; ws = 0.25; wsum = 1.0;
      Print("Warning: weights were non-positive; reverting to the 0.40 / 0.35 / 0.25 default.");
     }
   wc /= wsum; wk /= wsum; ws /= wsum;
   //--- Composite score and its letter grade
   r.composite = r.concScore * wc + r.consistScore * wk + r.survScore * ws;
   if(r.composite >= 90)      r.grade = "A+";
   else if(r.composite >= 80) r.grade = "A";
   else if(r.composite >= 70) r.grade = "B";
   else if(r.composite >= 60) r.grade = "C";
   else if(r.composite >= 50) r.grade = "D";
   else                       r.grade = "F";
  }
The grade is intentionally coarse. Its job is to say, at a glance, whether the profit is broad and repeatable (A or B), acceptable with caveats (C or D), or dependent on a few lucky trades (F).
The Main Script: Putting It All Together
The OnStart function loads the file, or generates a sample set if none is found, then builds the report and prints the concentration profile, the stress test, the metrics, the score, and the recommendations. The recommendations are driven by thresholds, so the advice points at the specific weakness rather than at the grade alone.
//+------------------------------------------------------------------+
//| Script entry point                                               |
//+------------------------------------------------------------------+
void OnStart()
  {
   Print("========================================");
   Print("  PROFIT CONCENTRATION ANALYZER v1.1");
   Print("  Where does the profit actually come from?");
   Print("========================================");
   //--- Load the trades, or build and load a sample set if none is found
   if(!LoadTrades(InpFileName, g_profit, g_date))
     {
      Print(">> File not found or empty. Generating a sample set...");
      if(!EnsureSampleFile(InpFileName))
        {
         Alert("Could not create the sample file.");
         return;
        }
      if(!LoadTrades(InpFileName, g_profit, g_date))
        {
         Alert("Could not load the sample file.");
         return;
        }
     }
   g_n = ArraySize(g_profit);
   if(g_n < 20)           // too few trades for the shares to be meaningful
     {
      Alert("At least 20 trades are required (results are more reliable with 100+).");
      return;
     }
   SReport r;
   BuildReport(g_profit, g_date, g_n, r);
   Print("\nNote: this works at the closing-deal level. A position closed in several");
   Print("deals (partial exits) contributes several rows; it is not full-position PnL.");
   if(r.netProfit <= 0.0) // the shares need a profitable set to make sense
     {
      Print("\nNet profit is not positive; the concentration shares need a profitable set.");
      PrintFormat("Net: %.2f | Trades: %d", r.netProfit, r.nTrades);
      return;
     }
   //--- Concentration profile
   Print("");
   PrintConcentrationProfile(g_profit, g_n, r.grossProfit);
   //--- Outlier-dependence stress test
   PrintFormat("\n=== OUTLIER-DEPENDENCE STRESS TEST (remove best %.0f%% of winners = %d trades) ===",
               InpRemovePct, r.removedCount);
   PrintFormat("  Net profit before: %.2f", r.netProfit);
   PrintProfitFactor("  Profit factor before: ", r.profitFactor);
   PrintFormat("  Net profit after:  %.2f", r.netAfterRemove);
   PrintProfitFactor("  Profit factor after:  ", r.pfAfterRemove);
   PrintFormat("  Remaining profit:  %.1f%% of the original net", r.survivalRatio * 100.0);
   Print("  (One-sided: only the best winners are removed, so the profit factor is meant to fall.)");
   //--- Metrics
   Print("\n=== METRICS ===");
   PrintFormat("  Trades:            %d  (%d winners, %d losers, %d flat)", r.nTrades, r.nWinners, r.nLosers, r.nFlat);
   PrintFormat("  Win rate:          %.1f%%", r.winRate);
   PrintFormat("  Net profit:        %.2f", r.netProfit);
   PrintProfitFactor("  Profit factor:     ", r.profitFactor);
   PrintFormat("  Gini (winners):    %.3f", r.gini);
   PrintFormat("  Top-%d trades:      %.1f%% of net profit  /  %.1f%% of gross profit",
               InpTopN, r.topNShare, r.topNShareGross);
   PrintFormat("  Best day (%s): %.1f%% of net profit", r.bestDay, r.bestDayShare);
   PrintFormat("  Consistency limit: %.1f%%  ->  %s", InpConsistencyLimit,
               (r.bestDayShare <= InpConsistencyLimit ? "PASS" : "FAIL"));
   //--- Score
   Print("\n========================================");
   Print("  CONCENTRATION & CONSISTENCY SCORE (heuristic)");
   Print("========================================");
   PrintFormat("  Concentration score: %.1f / 100", r.concScore);
   PrintFormat("  Consistency score:   %.1f / 100", r.consistScore);
   PrintFormat("  Survival score:      %.1f / 100", r.survScore);
   Print("----------------------------------------");
   PrintFormat("  COMPOSITE:           %.1f / 100", r.composite);
   PrintFormat("  GRADE:               %s", r.grade);
   Print(" (Heuristic for ranking and quick comparison, not a statistically validated measure.)");
   Print("========================================");
   //--- Recommendations: each one is driven by a specific weakness
   Print("\n--- RECOMMENDATIONS ---");
   if(r.topNShare >= 40.0)
      PrintFormat(">> The top %d trades produce %.0f%% of the net profit. Confirm the edge does not rest on a few exceptional trades.",
                  InpTopN, r.topNShare);
   if(r.bestDayShare > InpConsistencyLimit)
      PrintFormat(">> One day is %.0f%% of total profit, above the %.0f%% limit. This would fail a consistency rule.",
                  r.bestDayShare, InpConsistencyLimit);
   if(r.survivalRatio < 0.45)
      Print("!! Removing the best few winners erases more than half the profit. Treat the result as outlier-dependent.");
   if(r.gini >= 0.6)
      Print(">> Gains are highly unequal across trades. A handful of winners carries the system.");
   if(r.composite >= 80.0)
      Print("++ Profit is well distributed across trades and days. The edge looks broad-based.");
   Print("\nAnalysis complete.");
  }
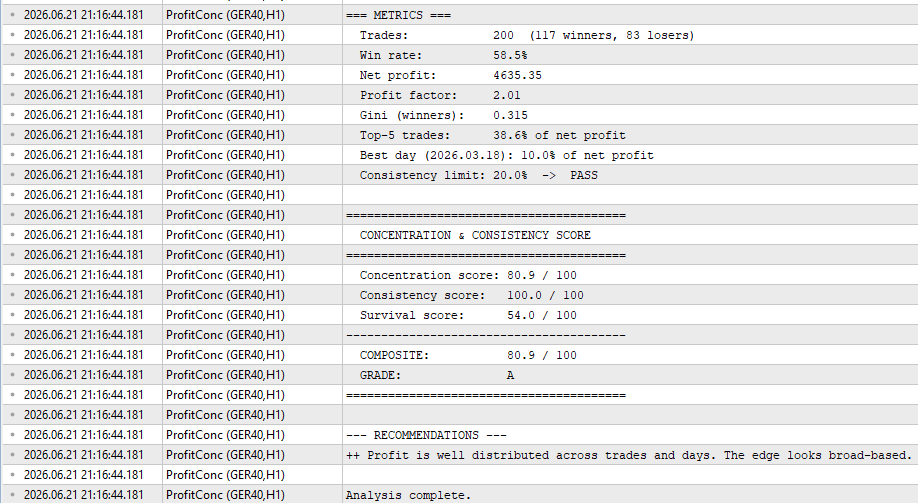
Fig. 4. Metrics, score, grade, and recommendations in the Experts tab.
Preparing Your Data: A Practical Workflow
To analyze a real strategy, you need a CSV file with its closed trades. The steps are short:
- Run the backtest in the Strategy Tester with the settings you want to evaluate.
- Export the closed trades to a CSV file with the columns Date and Profit, one row per trade.
- Place the file in the terminal MQL5\Files folder and point the analyzer at it through the input parameter.
To automate the export, add the following function to your Expert Advisor and call it from the OnTester event, or run it as a standalone script on an account that already has history. It keeps only real buy and sell deals and writes one row per closing deal. This is deal-level data: a position closed in several deals, such as a partial or staged exit, contributes several rows, so it is not the same as one row per full position. For simple one-in, one-out trades, the two coincide; for partial exits, treat the input as closing-deal results.
//+------------------------------------------------------------------+
//| Write one row per closing deal: the realized result of a trade   |
//+------------------------------------------------------------------+
void ExportTrades(string filename)
  {
   //--- Open the output file and write the header
   int handle = FileOpen(filename, FILE_WRITE|FILE_CSV|FILE_ANSI, ',');
   if(handle == INVALID_HANDLE)
     {
      PrintFormat("Cannot create %s. Error: %d", filename, GetLastError());
      return;
     }
   FileWriteString(handle, "Date,Profit\n");
   //--- Pull the whole trade history into the cache
   if(!HistorySelect(0, TimeCurrent()))
     {
      Print("HistorySelect failed.");
      FileClose(handle);
      return;
     }
   int total = HistoryDealsTotal();
   int rows  = 0;
   for(int i = 0; i < total; i++)
     {
      ulong ticket = HistoryDealGetTicket(i);
      if(ticket == 0)
         continue;
      //--- Keep only real trade deals (buy/sell). This excludes balance,
      //--- credit, charge, correction, bonus, interest and similar entries.
      ENUM_DEAL_TYPE dtype = (ENUM_DEAL_TYPE)HistoryDealGetInteger(ticket, DEAL_TYPE);
      if(dtype != DEAL_TYPE_BUY && dtype != DEAL_TYPE_SELL)
         continue;
      //--- Only closing deals carry a trade's realized result. A partial
      //--- or multi-deal exit yields several closing deals, so one
      //--- position can contribute more than one row.
      if((ENUM_DEAL_ENTRY)HistoryDealGetInteger(ticket, DEAL_ENTRY) != DEAL_ENTRY_OUT)
         continue;
      //--- Realized result = profit + swap + commission
      double profit = HistoryDealGetDouble(ticket, DEAL_PROFIT)
                    + HistoryDealGetDouble(ticket, DEAL_SWAP)
                    + HistoryDealGetDouble(ticket, DEAL_COMMISSION);
      //--- Write the row as Date,Profit
      datetime dealTime = (datetime)HistoryDealGetInteger(ticket, DEAL_TIME);
      MqlDateTime dt;
      TimeToStruct(dealTime, dt);
      FileWriteString(handle, StringFormat("%04d.%02d.%02d,%.2f\n", dt.year, dt.mon, dt.day, profit));
      rows++;
     }
   FileClose(handle);
   PrintFormat("Exported %d trades to %s", rows, filename);
  }
Call ExportTrades("Trades.csv") once, and the file will appear in the MQL5\Files folder, ready for the analyzer.
Interpreting Results and Making Decisions
The grade is a starting point. The individual measurements point to a specific action.
A high top-N share. When a few trades hold most of the net profit, the priority is to find out why. If those trades share a feature, such as a news event or a particular session, that feature may be the real edge, and the rest of the rules are noise. If they look random, treat the backtest as optimistic and size accordingly.
A low survival ratio. If removing the best few winners erases most of the profit, the strategy has not yet shown a repeatable edge over the sample tested. More data, not more leverage, is the sensible next step.
A day above the consistency limit. This is a direct warning for anyone pursuing a funded account. Even with the profit target met, one dominant day can fail the evaluation. Reducing size on the strongest days, or spreading entries, can bring the distribution back within the rule.
A strong grade across the board. A low top-N share, a high survival ratio, and the largest day within the limit together describe a broad edge. Re-run the analyzer after adding trades to confirm the profile holds as the sample grows.
A practical implication runs through all four cases: net profit answers how much, but concentration answers how trustworthy. A smaller, broad profit often deserves more confidence than a larger one built on a few exceptional trades.
The tool has practical limits. The shares only make sense on profitable samples and become unstable when net profit is near zero. The figures are usable from about twenty trades but are far more reliable past a hundred. And concentration analysis complements, rather than replaces, walk-forward testing, Monte Carlo resampling, and drawdown analysis; it answers one specific question well.
Extending the Framework
The analyzer is a foundation. A few extensions make it more powerful:
- Rolling concentration: compute the top-N share over a moving window of trades to see whether the strategy is becoming more or less dependent on outliers over time.
- Per-symbol or per-setup breakdown: group the results by symbol or by a magic number to find out which part of the system carries the profit.
- Bootstrapped stress test: repeat the outlier-dependent stress test on many random subsamples of the trades to produce a confidence range rather than a single figure.
- Combined robustness view: run this alongside a correlation analyzer and a drawdown analyzer so a new strategy is judged on how it concentrates profit, how it draws down, and how it correlates with the rest of the account.
- Position-level aggregation: group the closing deals by position identifier to study full-position results instead of individual deals, which matters when a strategy scales out of a position in parts.
- A survival curve: remove the top 1, 5, and 10 trades in turn, turning the single stress figure into a curve that shows how quickly the edge erodes.
- An optimization criterion: return a concentration-adjusted value from OnTester so the Strategy Tester can optimize for broad, repeatable edges rather than the single highest net profit.
Conclusion
Net profit and win rate describe the size of a result, not its quality. A strategy can clear every headline target and still rest on a few trades that may never repeat or on a single dominant day that breaks a consistency rule. In this article we built a tool that reads a list of closed trades and measures concentration directly: the share held by the largest trades, the Gini coefficient of the winners, an outlier-dependent stress test that removes the best few winners, and the largest day against a consistency limit, all combined into one graded score with recommendations.
The main points for practitioners are:
- Ask where the profit comes from, not only how much there is.
- A strategy that survives the removal of its best few trades has shown a broader edge than one that does not.
- The largest single day decides whether a profitable account can pass a funded-account consistency rule.
- Use the grade to compare, but act on the individual measurements because they each point at a different fix.
The source code is available in the MQL5 CodeBase: Profit Concentration Analyzer in the MQL5 CodeBase. Download it, run it on your own trades, and find out how much of your profit you can actually count on.
The following table describes the source files that accompany the article.
| File Name | Description |
|---|---|
| ProfitConc | The main script. It loads the trades, computes the concentration metrics and the score, and prints the full report in the Experts tab. |
| TradeLoader | Module 1 reads the per-trade date and profit CSV file and prints a quick summary for verification. |
| ConcEngine | Module 2 computes the Gini coefficient, the top-N share, the concentration profile, and the outlier-dependent stress test. |
| DayConsistency | Module 3 aggregates trades by day and checks the largest day against the consistency limit. |
| ExportTrades | A helper that exports a date and profit file from the trade history. Copy its function into your Expert Advisor and call it from OnTester, or run it as a script. |
| MQL5.zip | An archive whose root is the MQL5 folder, so it unpacks directly into the terminal data folder with every file in its correct place. The five scripts sit in MQL5\Scripts\ProfitConcentration\, ready to compile without moving anything. |
- MetaQuotes, "MQL5 Reference: File Functions," MQL5 Documentation: Files;
- MetaQuotes, "MQL5 Reference: Array Functions," MQL5 Documentation: Array;
- MetaQuotes, "History Deals Properties," MQL5 Documentation: Deal Properties;
- Corrado Gini, "Variabilita e mutabilita," 1912 (origin of the Gini coefficient).
- Profit Concentration Analyzer source code, MQL5 CodeBase: Profit Concentration Analyzer in the MQL5 CodeBase
Warning: All rights to these materials are reserved by MetaQuotes Ltd. Copying or reprinting of these materials in whole or in part is prohibited.
This article was written by a user of the site and reflects their personal views. MetaQuotes Ltd is not responsible for the accuracy of the information presented, nor for any consequences resulting from the use of the solutions, strategies or recommendations described.

 How To Profile MQL5 Code in MetaEditor
 Building a Hierarchical Market Structure Framework (Prototype) in MQL5 Using Modular Architecture and Event-Driven Design
 Online Linear Regression with Recursive Least Squares in MQL5: A Parameter-Free Adaptive Trend Estimator
 Trust Your Backtest Data First: Building a Reproducible Historical Data Audit in Python for MetaTrader 5

- Free trading apps
- Over 8,000 signals for copying
- Economic news for exploring financial markets
You agree to website policy and terms of use