

Building a Hidden Risk of Ruin Auditor in MQL5
 1 325
1 325
 0
0

Introduction
An MQL5 signal shows an 89% win rate, an eighteen-month track record, and a smoothly rising equity curve. The description promises "disciplined risk management" and "consistent low-drawdown growth." Before subscribing, you check the published statistics: a profit factor above 2 and a maximum drawdown under 15%. Everything you are shown looks disciplined. What you are not shown is the sequence in which the trades happened. Maybe the position size quietly grew after each loss. Perhaps the account was holding four overlapping positions on the same symbol, averaging into a loss, right before the string of wins that produced that drawdown figure.
A closed-trade equity curve and a headline win rate are aggregate statistics. They summarize outcomes, not the mechanism that produced them. Two money-management patterns are especially good at hiding behind good aggregate numbers for a long time: martingale-style volume escalation (increasing the size after a loss to recover it faster) and grid or averaging down (stacking more same-direction positions into a losing move at a worse price). Both can post a long, attractive run, right up until a single adverse move exceeds the account's margin. MQL5 signal statistics are built from closed-trade history, so they share the same blind spot. It applies when screening a signal before subscribing, evaluating a Market EA's published results, or reviewing your own account after several green months.
This article builds a native MQL5 tool that reads a closed-position history and screens it for four specific, well-defined fingerprints, then combines them into a single Hidden Risk-of-Ruin grade from A to F. By the end, you will have a working tool to:
- Reconstruct closed positions from either a plain CSV or your own account's raw deal history.
- Flag volume escalation after a loss, the martingale fingerprint.
- Identify overlapping same-direction positions that average into a worse price, the grid fingerprint.
- Measure payoff asymmetry: frequent small wins next to disproportionately large losses.
- Estimate a classical risk-of-ruin figure at the risk-per-trade you intend to use.
- Combine all four into one configurable A-to-F Hidden Risk-of-Ruin grade with written recommendations.
Everything runs natively inside MetaTrader 5. No external libraries, no Python, no AI.
Why a Smooth Equity Curve Is Not Enough
An equity curve answers "what happened to the balance." It cannot answer, "What would have happened if the losing streak had been one trade longer?" A martingale sequence that doubles in size after every loss looks identical to a disciplined strategy for as long as it continues to double until it wins, not just once. A grid that averages into a losing move looks identical to normal trading for as long as the price eventually reverses. The statistics computed from the closed trades—win rate, profit factor, and maximum drawdown—describe the sample that survived. They say nothing about how close that sample came to not surviving because the mechanism that generated the trades is invisible once you only look at the outcomes.
The four dimensions presented in this article look at the mechanism instead of the outcome: how size changes after a loss, whether positions stack at worsening prices, whether wins and losses are lopsided, and what classical ruin mathematics says about the observed win rate and payoff ratio. A track record can look clean on every aggregate number and still fail two of these four checks. The built-in demonstration in this article is built to show exactly that case.
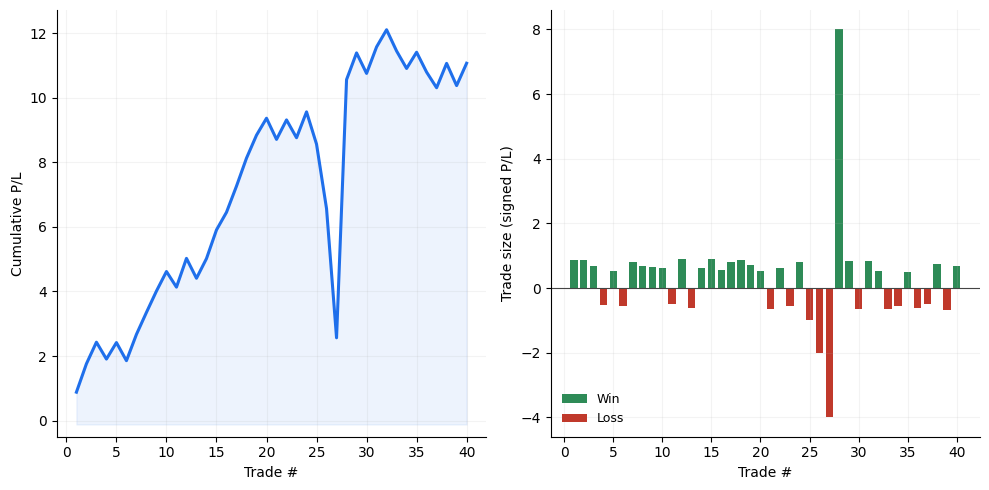
Fig. 1. The same trading history looks reassuring as an aggregate equity curve and looks structurally different once the size of each trade is shown against the previous trade's outcome.
Concepts and Definitions
MetaTrader 5 stores history at the deal level. Each partial fill is a separate deal, so a position opened or closed in several fills appears as multiple deals. The four dimensions in this article are computed on reconstructed positions, one row per fully closed position because the escalation and overlap fingerprints only make sense once every partial fill has been folded into the position it belongs to. RuinExport.mq5, described later, performs that reconstruction from a live account; a CSV built by hand from a signal's published history table is naturally already one row per closed position.
The tool reports four dimensions in the following order:
- Volume escalation after a loss. For every losing position, compare the volume of the next position to it. A ratio at or above a configurable threshold (1.30 by default, meaning at least 30% larger) counts as one escalation event; the longest unbroken run of such events is tracked separately because a real martingale continues to double until it wins, not just once.
- Overlapping same-direction exposure. Group positions by symbol and direction, then find the largest number of them open at the same instant and whether time-overlapping clusters of two or more enter at a monotonically worsening price. A high overlap count without worsening entries can be ordinary scaling into strength, so the score depends on both terms together, not the count alone.
- Payoff asymmetry. Win rate, the payoff ratio (average win divided by average loss), and the ratio of the single largest loss to the average win. The classic martingale signature is a high win rate paired with a low payoff ratio and a large tail ratio: many small wins next to one loss that erases several of them at once.
- Classical risk of ruin. A heuristic approximation of the probability of eventual ruin, given the observed win rate and payoff ratio and a stated fraction of capital risked per trade.
The fourth dimension uses the classical gambler's-ruin approximation extended to unequal win/loss sizes:
A = (W × Rp − L) / (W × Rp + L)
R = ((1 − A) / (1 + A))^U,
Where W is the win rate, L = 1 − W, Rp is the payoff ratio, and U = 1 / (fraction of capital risked per trade) is the number of "risk units" the account can absorb. This assumes iid outcomes at historical averages and a fixed fraction of capital risked per trade. Real sequences rarely satisfy iid assumptions, so this is only one of four dimensions (see Applicability and Limitations). When edge A is zero or negative, the formula's own assumption is that ruin is certain over an unbounded series of trades, so the tool reports R = 1 directly rather than extrapolating a small negative number.
Every dimension reports a score from 0 to 100, where a higher score means more suspicious. The four scores combine into a composite risk score using configurable weights (equal by default and normalized so only their relative size matters, not their sum), and the safety score reported to the reader is 100 minus that composite:
Safety score = 100 − (w₁ × Escalation + w₂ × Grid + w₃ × Asymmetry + w₄ × Ruin)
The safety score maps to a letter grade using configurable thresholds, 85 and above for A down to below 30 for F by default.
Architecture of the Hidden Risk-of-Ruin Auditor
The tool ships as two standalone, compilable scripts:
- RuinExport.mq5—an optional first step. Reconstructs closed positions from the current account's own deal history and writes them to a CSV file in the format the auditor expects.
- RuinAuditor.mq5—the analyzer. Loads that CSV (or, if none is found, generates a built-in demo book with a fixed random seed), runs the four scoring dimensions, combines them, and prints a full report in the Experts tab.
Inside RuinAuditor.mq5, the code is organized into small, single-purpose functions rather than one long script:
- Data model: The RuinPosition structure (one closed position) and DimensionResult structure (one dimension's score, label, and explanation), shared by every function below.
- Loading:LoadPositionsFromCsv, ParseIsBuy, and SortPositionsByOpenTime read and validate an existing history file.
- Demonstration data:GenerateSampleBook, AppendCleanTrades, and RandDouble01 build the reproducible built-in demo book when no CSV is supplied, and AppendPosition is the shared row builder used by both the loader and the generator.
- The four engines are ComputeEscalationScore, ComputeGridScore, ComputePayoffAsymmetryScore, and ComputeClassicalR
- Grading and reporting involve GradeFromScore and PrintRecommendations, orchestrated by OnStart.
RuinExport.mq5 mirrors the same style: the ExportPosition structure, the row-folding helpers FindOrCreateRow, ApplyEntryDeal, and ApplyExitDeal, and an OnStart that walks the account's deal history once and writes the CSV.
The Data Model
A closed position is the unit every dimension operates on. The structure below deliberately stores prices and volume as running, already-aggregated figures, so every downstream function can treat one row as one trade without knowing how many partial fills produced it:
struct RuinPosition
  {
   datetime          open_time;                                 // time the position was opened (first entry fill)
   datetime          close_time;                                // time the position was fully closed (last exit fill)
   string            symbol;                                    // traded symbol
   bool              is_buy;                                    // true = long, false = short
   double            volume;                                    // net opened volume, in lots
   double            open_price;                                // volume-weighted average entry price
   double            close_price;                               // volume-weighted average exit price
   double            profit;                                    // net result in account currency (profit + swap + commission)
  };
Every scoring function returns the same small structure, so the reporting code at the end of the script can loop over four results identically instead of special-casing each dimension:
struct DimensionResult
  {
   double            score;                                     // 0-100, higher = more suspicious / higher risk contribution
   string            label;                                     // short name shown in the report
   string            detail;                                    // one-line, human-readable explanation of the numbers behind the score
  };
The reference constants and grade boundaries used throughout are exposed as inputs rather than hardcoded, so a reader can retune the sensitivity of each dimension or the letter-grade cutoffs without touching the logic:
//--- input parameters ------------------------------------------------
input string InpCsvFileName          = "RuinAuditorSample.csv"; // CSV file (in MQL5\Files) to audit; a demo book is generated if it is missing
input double InpEscalationRatio      = 1.30;                    // Next-trade volume / previous-trade volume ratio that counts as "escalation" after a loss
input double InpEscalationRateRef    = 0.40;                    // Escalation rate (0-1) that maps the rate term to a full 100 points
input double InpEscalationStreakRef  = 5.0;                     // Longest escalation streak that maps the streak term to a full 100 points
input double InpGridConcurrentRef    = 6.0;                     // Concurrent same-direction position count that maps the overlap term to a full 100 points
input double InpWinRateLowBand       = 0.55;                    // Win rate at/below which the asymmetry win-rate term scores 0
input double InpWinRateHighBand      = 0.95;                    // Win rate at/above which the asymmetry win-rate term scores 100
input double InpPayoffLowBand        = 0.15;                    // Payoff ratio (avg win / avg loss) at/below which the payoff term scores 100
input double InpTailRatioRef         = 10.0;                    // largest-loss / average-win ratio that maps the tail term to a full 100 points
input double InpRiskFractionPerTrade = 0.02;                    // Fraction of capital you intend to risk per trade if you copy this book (classical risk-of-ruin input)
input double InpWeightEscalation     = 0.25;                    // Composite weight: volume-escalation dimension (weights are normalized, so only their ratio matters)
input double InpWeightGrid           = 0.25;                    // Composite weight: overlapping-exposure (grid/averaging) dimension
input double InpWeightAsymmetry      = 0.25;                    // Composite weight: payoff-asymmetry dimension
input double InpWeightRuin           = 0.25;                    // Composite weight: classical risk-of-ruin dimension
input double InpGradeA               = 85.0;                    // Minimum safety score for grade A
input double InpGradeB               = 70.0;                    // Minimum safety score for grade B
input double InpGradeC               = 50.0;                    // Minimum safety score for grade C
input double InpGradeD               = 30.0;                    // Minimum safety score for grade D (below this, grade F)
input int    InpMinPositions         = 30;                      // Minimum closed positions recommended for a statistically meaningful report
Loading a Trade History, or Generating One
The CSV format is deliberately minimal: a header row followed by one line per closed position, with the columns OpenTime, CopyTime, Symbol, Type, Volume, OpenPrice, ClosePrice, and Profit. LoadPositionsFromCsv reads the file as plain text rather than in binary CSV mode, trims and skips blank lines, and validates every parsed field before accepting a row, so one malformed line is skipped with a message instead of aborting the whole load:
//+------------------------------------------------------------------+
//| Robust CSV loader. Expects the header row                        |
//| OpenTime,CopyTime,Symbol,Type,Volume,OpenPrice,ClosePrice,      |
//| Profit followed by one row per CLOSED POSITION (see the          |
//| RuinPosition comment above on why this must be position-, not    |
//| deal-, level). Reads as plain text, trims and skips blank lines, |
//| validates every parsed field, and skips (rather than aborts on)  |
//| a malformed row.                                                 |
//+------------------------------------------------------------------+
bool LoadPositionsFromCsv(const string filename, RuinPosition &out[])
  {
   ResetLastError();
   int handle = FileOpen(filename, FILE_READ|FILE_TXT|FILE_ANSI);
   if(handle==INVALID_HANDLE)
      return(false);
   ArrayResize(out, 0);
   bool header_seen = false;
   int  line_no      = 0;
   int  skipped      = 0;
   while(!FileIsEnding(handle))
     {
      string line = FileReadString(handle);
      line_no++;
      StringTrimLeft(line);
      StringTrimRight(line);
      if(line=="")
         continue;           // skip blank lines
      if(!header_seen)
        {
         header_seen = true; // the first non-blank line is the header row
         continue;
        }
      string fields[];
      int n = StringSplit(line, ',', fields);
      if(n<8)
        {
         PrintFormat("RuinAuditor: skipping malformed line %d (expected 8 comma-separated fields, got %d)", line_no, n);
         skipped++;
         continue;
        }
      datetime o_time = StringToTime(fields[0]);
      datetime c_time = StringToTime(fields[1]);
      double   vol    = StringToDouble(fields[4]);
      double   o_price= StringToDouble(fields[5]);
      double   c_price= StringToDouble(fields[6]);
      if(o_time<=0 || c_time<=0 || vol<=0.0)
        {
         PrintFormat("RuinAuditor: skipping line %d, could not parse OpenTime/CopyTime/Volume", line_no);
         skipped++;
         continue;
        }
      AppendPosition(out, o_time, c_time, fields[2], ParseIsBuy(fields[3]), vol, o_price, c_price,
                     StringToDouble(fields[7]));
     }
   FileClose(handle);
   if(skipped>0)
      PrintFormat("RuinAuditor: loaded %d positions from %s, skipped %d unreadable line(s).",
                  ArraySize(out), filename, skipped);
   else
      PrintFormat("RuinAuditor: loaded %d positions from %s.", ArraySize(out), filename);
   SortPositionsByOpenTime(out);
   return(ArraySize(out)>0);
  }
ParseIsBuy reads the direction column case-insensitively, and SortPositionsByOpenTime keeps the book in chronological order, which every dimension below relies on:
//+------------------------------------------------------------------+
//| Parse a direction column ("buy"/"sell"/"long"/"short")           |
//| case-insensitively; unrecognized text defaults to false          |
//| (sell/short).                                                    |
//+------------------------------------------------------------------+
bool ParseIsBuy(const string text)
  {
   string t = text;
   StringToLower(t);
   StringTrimLeft(t);
   StringTrimRight(t);
   return(t=="buy" || t=="long");
  }
//+------------------------------------------------------------------+
//| Insertion sort of a position array by open_time. n is typically  |
//| a few hundred rows at most for an offline audit, so the simple   |
//| O(n^2) worst case is fast enough and keeps the logic easy to     |
//| verify.                                                          |
//+------------------------------------------------------------------+
void SortPositionsByOpenTime(RuinPosition &pos[])
  {
   int n = ArraySize(pos);
   for(int i=1; i<n; i++)
     {
      RuinPosition key = pos[i];
      int j = i-1;
      while(j>=0 && pos[j].open_time>key.open_time)
        {
         pos[j+1] = pos[j];
         j--;
        }
      pos[j+1] = key;
     }
  }
Both the loader and the demo generator build rows through the same helper, so a position is always constructed the same way regardless of where it came from:
//+------------------------------------------------------------------+
//| Append one fully-formed position row to a dynamic array.         |
//+------------------------------------------------------------------+
void AppendPosition(RuinPosition &out[], const datetime o_t, const datetime c_t, const string sym,
                     const bool is_buy, const double vol, const double o_price,
                     const double c_price, const double profit)
  {
   int idx = ArraySize(out);
   ArrayResize(out, idx+1);
   out[idx].open_time  = o_t;
   out[idx].close_time = c_t;
   out[idx].symbol     = sym;
   out[idx].is_buy      = is_buy;
   out[idx].volume      = vol;
   out[idx].open_price  = o_price;
   out[idx].close_price = c_price;
   out[idx].profit      = profit;
  }
If InpCsvFileName is not found, the script does not stop; it builds a demonstration book instead, so the report is visible on the very first run. The seed is fixed, so the same demo book and the same report are produced every time the script runs without a CSV present. Two fingerprints are injected at fixed points: a four-position grid cluster on GBPUSD that averages into a losing move and a three-step martingale escalation on USDJPY that doubles in size after each loss. Both are literal, fixed values, not random draws, because the entire point of a fixed seed is a known, reproducible pattern for the reader to compare against the report:
//+------------------------------------------------------------------+
//| Build the built-in demo book: a fixed RNG seed plus two          |
//| hand-placed fingerprints (a grid/averaging cluster and a         |
//| martingale escalation streak), so the out-of-the-box report is   |
//| reproducible and lands on an instructive, non-trivial grade. The |
//| two fixed clusters are literal, not randomly drawn, exactly      |
//| because their whole point is to be a known, deliberately         |
//| injected pattern.                                                |
//+------------------------------------------------------------------+
void GenerateSampleBook(RuinPosition &out[])
  {
   ArrayResize(out, 0);
   MathSrand(1337);                                // fixed seed: same demo book on every run
   datetime t     = D'2026.01.05 00:00';
   double   price = 1.1000;
   AppendCleanTrades(out, 70, "EURUSD", t, price); // leg 1: baseline book
//--- injected grid/averaging-down cluster: four overlapping BUY
//--- entries on GBPUSD, each opened at a worse (lower) price than
//--- the previous one, all closed together on the same losing exit.
//--- This is the classic grid/averaging-down fingerprint.
   datetime base_t = t+50*60;
   AppendPosition(out, base_t,        base_t+400*60, "GBPUSD", true, 0.10, 1.2700, 1.2550, -150.0);
   AppendPosition(out, base_t+40*60,  base_t+400*60, "GBPUSD", true, 0.20, 1.2650, 1.2550, -200.0);
   AppendPosition(out, base_t+90*60,  base_t+400*60, "GBPUSD", true, 0.40, 1.2600, 1.2550, -200.0);
   AppendPosition(out, base_t+150*60, base_t+400*60, "GBPUSD", true, 0.80, 1.2560, 1.2550, -80.0);
   t = base_t+450*60;
   AppendCleanTrades(out, 20, "EURUSD", t, price); // leg 2: baseline book continues
//--- injected martingale volume-escalation streak: three consecutive
//--- losses, each followed by a doubled lot size, ending in a win
//--- that "resets" the sequence back to a small size.
   datetime mt = t+60*60;
   AppendPosition(out, mt,       mt+20*60, "USDJPY", false, 0.10, 155.00, 155.30, -30.0);
   AppendPosition(out, mt+25*60, mt+45*60, "USDJPY", false, 0.20, 155.30, 155.55, -50.0);
   AppendPosition(out, mt+50*60, mt+70*60, "USDJPY", false, 0.40, 155.55, 155.80, -100.0);
   AppendPosition(out, mt+75*60, mt+95*60, "USDJPY", false, 0.80, 155.80, 155.20, 480.0);
   t = mt+100*60;
   AppendCleanTrades(out, 25, "EURUSD", t, price); // leg 3: baseline book concludes
   SortPositionsByOpenTime(out);
   PrintFormat("RuinAuditor: %s not found -- generated a %d-position demo book instead (fixed seed, reproducible).",
               InpCsvFileName, ArraySize(out));
  }
The "healthy" filler trades that surround the two injected fingerprints come from AppendCleanTrades, an ordinary 62%-win-rate baseline with no escalation and no overlap, built on top of RandDouble01:
//+------------------------------------------------------------------+
//| Append `count` ordinary, unremarkable trades: fixed 0.10-lot     |
//| size, a 62% baseline win probability and no escalation or        |
//| overlap. This is the "healthy" filler that surrounds the two     |
//| injected fingerprints below, so the aggregate book still looks   |
//| reasonable on the surface.                                       |
//+------------------------------------------------------------------+
void AppendCleanTrades(RuinPosition &out[], const int count, const string symbol,
                        datetime &t, double &price)
  {
   for(int i=0; i<count; i++)
     {
      bool   win     = (RandDouble01()<0.62);
      double vol     = 0.10;
      double open_p  = price;
      double move    = 0.0006 + RandDouble01()*(0.0022-0.0006);
      bool   dir_buy = (RandDouble01()<0.5);
      double close_p, profit;
      if(win)
        {
         close_p = open_p+move;
         profit  = move*100000.0*vol;
        }
      else
        {
         close_p = open_p-move*0.9;
         profit  = -move*0.9*100000.0*vol;
        }
      datetime o_t = t;
      datetime c_t = t+(2+MathRand()%39)*60; // holding time: 2-40 minutes
      AppendPosition(out, o_t, c_t, symbol, dir_buy, vol, open_p, close_p, profit);
      t     = c_t+(1+MathRand()%15)*60;      // gap before the next trade: 1-15 minutes
      price = close_p;
     }
  }
//+------------------------------------------------------------------+
//| Uniform pseudo-random double in [0,1) built on MathRand(); used  |
//| only to shape the built-in demo book, never for scoring itself.  |
//+------------------------------------------------------------------+
double RandDouble01()
  {
   return(MathRand()/32767.0);
  }
Dimension 1: Volume Escalation After a Loss
A martingale-style system increases size after a loss to recover it faster. ComputeEscalationScore walks the book once and, for every losing position, checks whether the very next position (in time, not necessarily the same symbol) used at least InpEscalationRatio times the volume. Two figures come out of that walk: the overall rate of such escalations among all post-loss transitions and the longest unbroken streak of consecutive escalations, weighted 60/40 in favor of the rate:
//+------------------------------------------------------------------+
//| Dimension 1 - volume escalation after a loss. A martingale-style |
//| system increases size after a losing trade to recover it faster. |
//| For every losing position, this checks whether the NEXT position |
//| (chronologically) used at least InpEscalationRatio times the     |
//| volume, and tracks the longest unbroken streak of such           |
//| escalations, since a real martingale keeps doubling until a win, |
//| not just once.                                                   |
//+------------------------------------------------------------------+
DimensionResult ComputeEscalationScore(const RuinPosition &pos[])
  {
   int n = ArraySize(pos);
   int events=0, considered=0, cur_streak=0, max_streak=0;
   for(int i=0; i<n-1; i++)
     {
      if(pos[i].profit<0.0)
        {
         considered++;
         double ratio = (pos[i].volume>0.0) ? pos[i+1].volume/pos[i].volume : 0.0;
         if(ratio>=InpEscalationRatio)
           {
            events++;
            cur_streak++;
            if(cur_streak>max_streak) max_streak = cur_streak;
           }
         else
            cur_streak = 0;
        }
      else
         cur_streak = 0;
     }
   double rate         = (considered>0) ? (double)events/(double)considered : 0.0;
   double rate_score    = 100.0*MathMin(rate/InpEscalationRateRef, 1.0);
   double streak_score  = 100.0*MathMin((double)max_streak/InpEscalationStreakRef, 1.0);
   DimensionResult r;
   r.score  = 0.6*rate_score+0.4*streak_score;
   r.label  = "Volume escalation after a loss";
   r.detail = StringFormat("%d of %d post-loss transitions escalated volume by >= %.0f%% (longest streak: %d)",
                           events, considered, (InpEscalationRatio-1.0)*100.0, max_streak);
   return(r);
  }
A short worked example makes the ratio concrete: a losing 0.10-lot position followed by a 0.30-lot position gives a ratio of 0.30 / 0.10 = 3.0, well above the default 1.30 threshold, so that single transition counts as one escalation event. Three such transitions in a row, each following a loss, is a streak of three, which by itself reaches most of the streak term's maximum score under the default InpEscalationStreakRef of 5.
Dimension 2: Overlapping Same-Direction Exposure
Grid and averaging-down systems stack more same-direction positions into a losing move instead of accepting the loss. ComputeGridScore groups positions by symbol and direction, measures the largest number of them open at the same instant by direct pairwise comparison, then groups the same positions into maximal time-overlapping clusters and checks whether a cluster's entry prices move monotonically against the position's own direction, the averaging-down signature. A large overlap count without that worsening pattern is treated as ordinary scaling into strength and scores low; only the combination of overlap and worsening entries scores high:
//+------------------------------------------------------------------+
//| Dimension 2 - overlapping same-direction exposure                |
//| (grid/averaging). Groups positions by (symbol, direction), finds |
//| the largest number of them open at the same instant, and checks  |
//| whether time-overlapping clusters of two or more entries worsen  |
//| monotonically in the adverse direction -- the averaging-down     |
//| fingerprint. A high concurrent count WITHOUT worsening entries   |
//| can be legitimate scaling into strength, so both terms matter,   |
//| not just the count.                                              |
//+------------------------------------------------------------------+
DimensionResult ComputeGridScore(const RuinPosition &pos[])
  {
   int n = ArraySize(pos);
   string keys_symbol[];
   bool   keys_isbuy[];
   int    key_count = 0;
   for(int i=0; i<n; i++)
     {
      bool found = false;
      for(int k=0; k<key_count; k++)
         if(keys_symbol[k]==pos[i].symbol && keys_isbuy[k]==pos[i].is_buy)
           {
            found = true;
            break;
           }
      if(!found)
        {
         ArrayResize(keys_symbol, key_count+1);
         ArrayResize(keys_isbuy,  key_count+1);
         keys_symbol[key_count] = pos[i].symbol;
         keys_isbuy[key_count]  = pos[i].is_buy;
         key_count++;
        }
     }
   int max_concurrent     = 0;
   int total_clusters     = 0;
   int worsening_clusters = 0;
   for(int k=0; k<key_count; k++)
     {
      int idxs[];
      int cnt = 0;
      for(int i=0; i<n; i++)
         if(pos[i].symbol==keys_symbol[k] && pos[i].is_buy==keys_isbuy[k])
           {
            ArrayResize(idxs, cnt+1);
            idxs[cnt] = i;
            cnt++;
           }
      //--- largest number of this symbol/direction open at the same instant
      for(int a=0; a<cnt; a++)
        {
         int concurrent_here = 0;
         for(int b=0; b<cnt; b++)
            if(pos[idxs[b]].open_time<=pos[idxs[a]].open_time && pos[idxs[b]].close_time>=pos[idxs[a]].open_time)
               concurrent_here++;
         if(concurrent_here>max_concurrent) max_concurrent = concurrent_here;
        }
      //--- group into maximal time-overlapping clusters (idxs[] is already in
      //--- open_time order because pos[] itself is sorted by open_time)
      int      cluster_of[];
      datetime running_end[];
      ArrayResize(cluster_of,  cnt);
      ArrayResize(running_end, cnt);
      int n_clusters = 0;
      for(int a=0; a<cnt; a++)
        {
         int idx = idxs[a];
         bool placed = false;
         for(int c=0; c<n_clusters; c++)
            if(pos[idx].open_time<=running_end[c])
              {
               cluster_of[a] = c;
               if(pos[idx].close_time>running_end[c]) running_end[c] = pos[idx].close_time;
               placed = true;
               break;
              }
         if(!placed)
           {
            cluster_of[a]        = n_clusters;
            running_end[n_clusters] = pos[idx].close_time;
            n_clusters++;
         }
        }
      for(int c=0; c<n_clusters; c++)
        {
         int members[];
         int mc = 0;
         for(int a=0; a<cnt; a++)
            if(cluster_of[a]==c)
              {
               ArrayResize(members, mc+1);
               members[mc] = idxs[a];
               mc++;
              }
         if(mc<2) continue; // a lone position is not a cluster
         total_clusters++;
         bool worsening = true;
         for(int m=0; m<mc-1; m++)
           {
            double p1 = pos[members[m]].open_price;
            double p2 = pos[members[m+1]].open_price;
            if(keys_isbuy[k]) { if(p1<p2) { worsening=false; break; } }
            else              { if(p1>p2) { worsening=false; break; } }
           }
         if(worsening) worsening_clusters++;
        }
     }
   double worsening_fraction = (total_clusters>0) ? (double)worsening_clusters/(double)total_clusters : 0.0;
   double concurrent_score   = 100.0*MathMin((double)max_concurrent/InpGridConcurrentRef, 1.0);
   double worsening_score    = 100.0*worsening_fraction;
   DimensionResult r;
   r.score  = 0.5*concurrent_score+0.5*worsening_score;
   r.label  = "Overlapping same-direction exposure (grid/averaging)";
   r.detail = StringFormat("largest same-symbol same-direction overlap: %d concurrent position(s); %d of %d overlapping cluster(s) averaged into a worse price",
                           max_concurrent, worsening_clusters, total_clusters);
   return(r);
  }
Dimension 3: Payoff Asymmetry
The classic martingale and grid signature is not a low win rate; it is the opposite: many small wins next to a rare, disproportionately large loss. ComputePayoffAsymmetryScore computes the win rate, the payoff ratio, and the ratio of the single largest loss to the average win, then combines all three. A book with zero losing trades is a special case: it cannot, by definition, rule out an inflating martingale that simply has not unwound yet, so it is flagged as high-attention rather than treated as clean:
//+------------------------------------------------------------------+
//| Dimension 3 - payoff asymmetry. The classic martingale/grid      |
//| signature is many small wins next to a rare, disproportionately  |
//| large loss. Also returns win_rate and payoff_ratio by reference  |
//| so the classical risk-of-ruin dimension can reuse them without a |
//| second pass over the book. A book with zero losing trades cannot |
//| rule out an inflating martingale that simply has not unwound     |
//| yet, so that case is treated as high-attention, not as "safe".   |
//+------------------------------------------------------------------+
DimensionResult ComputePayoffAsymmetryScore(const RuinPosition &pos[], double &out_win_rate, double &out_payoff_ratio)
  {
   int    n = ArraySize(pos);
   int    wins=0, losses=0;
   double sum_win=0.0, sum_loss=0.0, largest_loss=0.0;
   for(int i=0; i<n; i++)
     {
      if(pos[i].profit>0.0)
        {
         wins++;
         sum_win += pos[i].profit;
        }
      else if(pos[i].profit<0.0)
        {
         losses++;
         double loss = -pos[i].profit;
         sum_loss += loss;
         if(loss>largest_loss) largest_loss = loss;
        }
     }
   double win_rate = (n>0) ? (double)wins/(double)n : 0.0;
   double avg_win  = (wins>0) ? sum_win/wins : 0.0;
   DimensionResult r;
   r.label = "Payoff asymmetry (small wins vs. tail-risk losses)";
   if(losses==0)
     {
      out_win_rate     = win_rate;
      out_payoff_ratio = -1.0; // sentinel: undefined, no losses recorded yet
      r.score  = 70.0;
      r.detail = "no losing trades in the sample yet -- inconclusive by definition, treated as high-attention rather than safe";
      return(r);
     }
   double avg_loss     = sum_loss/losses;
   double payoff_ratio = (avg_loss>0.0) ? avg_win/avg_loss : 0.0;
   double tail_ratio   = (avg_win>0.0)  ? largest_loss/avg_win : 0.0;
   double winrate_score = 100.0*MathMax(0.0, MathMin((win_rate-InpWinRateLowBand)/(InpWinRateHighBand-InpWinRateLowBand), 1.0));
   double payoff_score  = (payoff_ratio<=1.0) ? 100.0*MathMax(0.0, MathMin((1.0-payoff_ratio)/(1.0-InpPayoffLowBand), 1.0)) : 0.0;
   double tail_score    = 100.0*MathMin(tail_ratio/InpTailRatioRef, 1.0);
   out_win_rate     = win_rate;
   out_payoff_ratio = payoff_ratio;
   r.score  = 0.35*winrate_score+0.35*payoff_score+0.30*tail_score;
   r.detail = StringFormat("win rate %.1f%%, payoff ratio %.2f (avg win / avg loss), largest loss = %.1fx the average win",
                           win_rate*100.0, payoff_ratio, tail_ratio);
   return(r);
  }
Dimension 4: Classical Risk of Ruin
ComputeClassicalRuinScore implements the formula from the Concepts section directly, reusing the win rate and payoff ratio already computed by the asymmetry step instead of walking the book a second time:
//+------------------------------------------------------------------+
//| Dimension 4 - classical risk of ruin (heuristic approximation).  |
//| A = (W*Rp - L) / (W*Rp + L), assuming independent, identically   |
//| distributed win/loss outcomes fixed at their historical          |
//| averages, and a fixed fraction of capital risked per trade       |
//| (InpRiskFractionPerTrade). R = ((1-A)/(1+A))^U, with U = 1/risk  |
//| fraction "capital units". This is the classical gambler's-ruin   |
//| approximation for unequal payoffs (Vince, 1990/1992); real trade |
//| sequences are not strictly i.i.d., so treat this as a heuristic  |
//| screen, not a proof.                                             |
//+------------------------------------------------------------------+
DimensionResult ComputeClassicalRuinScore(const double win_rate, const double payoff_ratio)
  {
   DimensionResult r;
   r.label = "Classical risk of ruin (heuristic approximation)";
   if(payoff_ratio<0.0) // sentinel from the asymmetry step: no losses recorded
     {
      r.score  = 50.0;
      r.detail = "cannot be estimated without at least one losing trade; treated as neutral/undefined";
      return(r);
     }
   double W     = win_rate;
   double L     = 1.0-win_rate;
   double denom = W*payoff_ratio+L;
   double edge  = (denom>0.0) ? (W*payoff_ratio-L)/denom : -1.0;
   double units = 1.0/MathMax(InpRiskFractionPerTrade, 0.0001);
   double ruin_probability;
   string note;
   if(edge<=0.0)
     {
      ruin_probability = 1.0;
      note = "non-positive edge: the classical formula assumes certain eventual ruin over an unbounded series of trades";
     }
   else
     {
      ruin_probability = MathPow((1.0-edge)/(1.0+edge), units);
      ruin_probability = MathMax(0.0, MathMin(ruin_probability, 1.0));
      note = StringFormat("edge=%.3f, capital cushion=%.0f risk units at %.1f%% risked per trade",
                          edge, units, InpRiskFractionPerTrade*100.0);
     }
   r.score  = ruin_probability*100.0;
   r.detail = StringFormat("%s (win rate %.1f%%, payoff ratio %.2f)", note, win_rate*100.0, payoff_ratio);
   return(r);
  }
Two short worked examples show why the win rate alone is not enough to judge this dimension. Both start from the same 55% win rate and the same 2% risk per trade, so
U = 1 / 0.02 = 50 risk units in both cases.
With a payoff ratio of 1.5 (the average win is one and a half times the average loss):
A = (0.55×1.5 − 0.45) / (0.55×1.5 + 0.45) = 0.375 / 1.275 ≈ 0.294, a comfortable positive edge.
R = ((1−0.294)/(1+0.294))⁵⁰ ≈ 6.9×10⁻¹⁴, a negligible classical risk of ruin.
With a payoff ratio of only 0.3 (many small wins, occasional large losses) at the same 55% win rate:
A = (0.55×0.3 − 0.45) / (0.55×0.3 + 0.45) = −0.285 / 0.615 ≈ −0.463, a negative edge despite the identical win rate.
The formula's own assumption is that ruin is then certain over an unbounded series of trades, so the tool reports R = 1 and explains why in the printed note rather than showing a number that would understate the risk.
Combining the Dimensions and Reporting
GradeFromScore maps the safety score to a letter grade using configurable thresholds. PrintRecommendations prints a note for each dimension above 50 points, or a neutral disclaimer if none cross the threshold.
//+------------------------------------------------------------------+
//| Map a 0-100 safety score (100 = safest) to a letter grade using  |
//| the configurable thresholds above.                               |
//+------------------------------------------------------------------+
string GradeFromScore(const double safety)
  {
   if(safety>=InpGradeA) return("A");
   if(safety>=InpGradeB) return("B");
   if(safety>=InpGradeC) return("C");
   if(safety>=InpGradeD) return("D");
   return("F");
  }
//+------------------------------------------------------------------+
//| Print one plain-language recommendation per dimension that       |
//| crossed the 50-point attention threshold, or a neutral note if   |
//| none did -- a clean screen is not proof of safety, only the      |
//| absence of these four specific fingerprints.                     |
//+------------------------------------------------------------------+
void PrintRecommendations(const DimensionResult &esc, const DimensionResult &grd,
                          const DimensionResult &asym, const DimensionResult &ruin)
  {
   Print("--- Recommendations ---");
   bool any = false;
   if(esc.score>=50.0)  { Print("- Investigate the sizing rule: volume increases materially after losing trades."); any=true; }
   if(grd.score>=50.0)  { Print("- Investigate position stacking: this book repeatedly averages into a losing side."); any=true; }
   if(asym.score>=50.0) { Print("- Treat the win rate with caution: frequent small wins are paired with disproportionate losses."); any=true; }
   if(ruin.score>=50.0) { Print("- The classical risk-of-ruin approximation is elevated at the stated risk per trade; reduce size or gather a larger sample."); any=true; }
   if(!any)
      Print("- No dimension crossed the attention threshold; this screen found no fingerprint, which is not the same as a guarantee of safety (see Applicability and limitations).");
  }
The Main Script: Putting It All Together
OnStart ties every piece together: load or generate the book, guard against a sample that is too small to be meaningful, run the four engines, normalize the weights, compute the safety score and grade, and print the full report.
//+------------------------------------------------------------------+
//| Script program start function                                    |
//+------------------------------------------------------------------+
void OnStart()
  {
   RuinPosition positions[];
   if(!LoadPositionsFromCsv(InpCsvFileName, positions))
      GenerateSampleBook(positions);
   int total = ArraySize(positions);
   if(total<InpMinPositions)
      PrintFormat("RuinAuditor: only %d closed position(s) available (minimum recommended is %d) -- the scores below are shown for reference only and are not statistically meaningful yet.",
                  total, InpMinPositions);
   double win_rate=0.0, payoff_ratio=0.0;
   DimensionResult esc  = ComputeEscalationScore(positions);
   DimensionResult grd  = ComputeGridScore(positions);
   DimensionResult asym = ComputePayoffAsymmetryScore(positions, win_rate, payoff_ratio);
   DimensionResult ruin = ComputeClassicalRuinScore(win_rate, payoff_ratio);
   double wsum = MathMax(InpWeightEscalation+InpWeightGrid+InpWeightAsymmetry+InpWeightRuin, 0.0001);
   double we = InpWeightEscalation/wsum;
   double wg = InpWeightGrid/wsum;
   double wa = InpWeightAsymmetry/wsum;
   double wr = InpWeightRuin/wsum;
   double risk_composite = we*esc.score+wg*grd.score+wa*asym.score+wr*ruin.score;
   double safety_score   = 100.0-risk_composite;
   string letter         = GradeFromScore(safety_score);
   PrintFormat("=== Hidden Risk-of-Ruin Auditor: %d closed position(s) analyzed ===", total);
   PrintFormat("[1] %s -- score %.1f (%s)", esc.label,  esc.score,  esc.detail);
   PrintFormat("[2] %s -- score %.1f (%s)", grd.label,  grd.score,  grd.detail);
   PrintFormat("[3] %s -- score %.1f (%s)", asym.label, asym.score, asym.detail);
   PrintFormat("[4] %s -- score %.1f (%s)", ruin.label, ruin.score, ruin.detail);
   PrintFormat("Composite risk score: %.1f/100  ->  Safety score: %.1f/100  ->  Grade: %s",
               risk_composite, safety_score, letter);
   PrintRecommendations(esc, grd, asym, ruin);
  }
Running RuinAuditor.mq5 on the built-in demonstration book prints the following report in the Experts tab:
=== Hidden Risk-of-Ruin Auditor: 123 closed position(s) analyzed ===
[1] Volume escalation after a loss -- score 45.4 (6 of 42 post-loss transitions escalated volume by >= 30% (longest streak: 3))
[2] Overlapping same-direction exposure (grid/averaging) -- score 83.3 (largest same-symbol same-direction overlap: 4 concurrent position(s); 1 of 1 overlapping cluster(s) averaged into a worse price)
[3] Payoff asymmetry (small wins vs. tail-risk losses) -- score 53.4 (win rate 65.9%, payoff ratio 0.66 (avg win / avg loss), largest loss = 10.1x the average win)
[4] Classical risk of ruin (heuristic approximation) -- score 0.0 (edge=0.122, capital cushion=50 risk units at 2.0% risked per trade (win rate 65.9%, payoff ratio 0.66))
Composite risk score: 45.5/100  ->  Safety score: 54.5/100  ->  Grade: C
--- Recommendations ---
- Investigate position stacking: this book repeatedly averages into a losing side.
- Treat the win rate with caution: frequent small wins are paired with disproportionate losses.
Fig. 2. RuinAuditor.mq5 runs on the built-in demonstration book: two of the four dimensions cross the attention threshold even though the book's overall win rate and classical risk of ruin look unremarkable on their own.
RuinExport.mq5: Auditing Your Own Account
Auditing a signal or a market EA's published history means building the CSV by hand from what the provider makes public. Auditing your own account is one click: RuinExport.mq5 walks HistorySelect's deal list once, folds every entry and exit deal into the position it belongs to by DEAL_POSITION_ID, and writes only fully closed positions, since a partially closed position is still open and would misrepresent the audit:
struct ExportPosition
  {
   long              position_id;                           // MetaTrader's POSITION_IDENTIFIER, shared by every deal of one position
   datetime          open_time;                             // time of the first entry deal
   datetime          close_time;                            // time of the last exit deal (0 while the position is still open)
   string            symbol;                                // traded symbol
   bool              is_buy;                                // true = long, false = short (direction of the opening deal)
   double            volume;                                // volume-weighted running total of entry fills
   double            close_volume;                          // running total of exit fills, used only to confirm full closure
   double            open_price;                            // volume-weighted average entry price
   double            close_price;                           // volume-weighted average exit price
   double            profit;                                // sum of profit + swap + commission across every deal of the position
  };
//--- input parameters -------------------------------------------------
input string   InpOutputFileName = "RuinAuditorSample.csv"; // CSV file written to MQL5\Files, ready for RuinAuditor.mq5
input datetime InpFromDate       = D'2000.01.01';           // export closed positions opened on/after this date
input datetime InpToDate         = D'2038.01.01';           // export closed positions opened on/before this date
FindOrCreateRow looks up or creates the row for a position ID, and the two folding helpers keep a running volume-weighted average price as more fills of the same side arrive:
//+------------------------------------------------------------------+
//| Find the row for this position id, creating a zero-initialized   |
//| one on first sight.                                              |
//+------------------------------------------------------------------+
int FindOrCreateRow(ExportPosition &rows[], const long pos_id, const string symbol)
  {
   int n = ArraySize(rows);
   for(int i=0; i<n; i++)
      if(rows[i].position_id==pos_id)
         return(i);
   ArrayResize(rows, n+1);
   rows[n].position_id  = pos_id;
   rows[n].symbol       = symbol;
   rows[n].open_time    = 0;
   rows[n].close_time   = 0;
   rows[n].is_buy        = true;
   rows[n].volume        = 0.0;
   rows[n].close_volume  = 0.0;
   rows[n].open_price    = 0.0;
   rows[n].close_price   = 0.0;
   rows[n].profit        = 0.0;
   return(n);
  }
//+------------------------------------------------------------------+
//| Fold one entry (DEAL_ENTRY_IN) deal into position rows[idx]:     |
//| running volume-weighted average entry price, direction, and      |
//| earliest open time across every entry fill. Takes the array plus |
//| a row index, rather than a reference to one element, so the      |
//| update is written straight back into the caller's array.         |
//+------------------------------------------------------------------+
void ApplyEntryDeal(ExportPosition &rows[], const int idx, const double price, const double vol,
                     const bool is_buy, const datetime dtime)
  {
   double prev_vol = rows[idx].volume;
   double new_vol  = prev_vol+vol;
   rows[idx].open_price = (new_vol>0.0) ? (prev_vol*rows[idx].open_price+vol*price)/new_vol : price;
   rows[idx].volume     = new_vol;
   rows[idx].is_buy     = is_buy;
   if(rows[idx].open_time==0 || dtime<rows[idx].open_time)
      rows[idx].open_time = dtime;
  }
//+------------------------------------------------------------------+
//| Fold one exit (DEAL_ENTRY_OUT / DEAL_ENTRY_OUT_BY) deal into     |
//| position rows[idx]: running volume-weighted average exit price,  |
//| and the latest close time across every exit fill.                |
//+------------------------------------------------------------------+
void ApplyExitDeal(ExportPosition &rows[], const int idx, const double price, const double vol, const datetime dtime)
  {
   double prev_cvol = rows[idx].close_volume;
   double new_cvol  = prev_cvol+vol;
   rows[idx].close_price  = (new_cvol>0.0) ? (prev_cvol*rows[idx].close_price+vol*price)/new_cvol : price;
   rows[idx].close_volume = new_cvol;
   if(dtime>rows[idx].close_time)
      rows[idx].close_time = dtime;
  }
OnStart then writes the header row, followed by one line per fully closed position, skipping balance, credit, and correction entries, and skipping any position whose closed volume does not yet match its opened volume:
//+------------------------------------------------------------------+
//| Script program start function                                    |
//+------------------------------------------------------------------+
void OnStart()
  {
   if(!HistorySelect(InpFromDate, InpToDate))
     {
      PrintFormat("RuinExport: HistorySelect failed, error %d", GetLastError());
      return;
     }
   int total_deals = HistoryDealsTotal();
   ExportPosition rows[];
//--- fold every real trade fill into its position row; balance, credit
//--- and correction entries are not trade fills and are skipped, and
//--- only DEAL_ENTRY_IN / DEAL_ENTRY_OUT / DEAL_ENTRY_OUT_BY are
//--- meaningful for reconstructing a position's entry and exit sides
   for(int i=0; i<total_deals; i++)
     {
      ulong ticket = HistoryDealGetTicket(i);
      if(ticket==0) continue;
      long dtype = HistoryDealGetInteger(ticket, DEAL_TYPE);
      if(dtype!=DEAL_TYPE_BUY && dtype!=DEAL_TYPE_SELL)
         continue; // skip balance/credit/correction/interest entries
      long     entry  = HistoryDealGetInteger(ticket, DEAL_ENTRY);
      long     pos_id = HistoryDealGetInteger(ticket, DEAL_POSITION_ID);
      string   symbol = HistoryDealGetString(ticket, DEAL_SYMBOL);
      double   price  = HistoryDealGetDouble(ticket, DEAL_PRICE);
      double   vol    = HistoryDealGetDouble(ticket, DEAL_VOLUME);
      double   profit = HistoryDealGetDouble(ticket, DEAL_PROFIT)
                       +HistoryDealGetDouble(ticket, DEAL_SWAP)
                       +HistoryDealGetDouble(ticket, DEAL_COMMISSION);
      datetime dtime  = (datetime)HistoryDealGetInteger(ticket, DEAL_TIME);
      int row = FindOrCreateRow(rows, pos_id, symbol);
      rows[row].profit += profit;
      if(entry==DEAL_ENTRY_IN)
         ApplyEntryDeal(rows, row, price, vol, (dtype==DEAL_TYPE_BUY), dtime);
      else if(entry==DEAL_ENTRY_OUT || entry==DEAL_ENTRY_OUT_BY)
         ApplyExitDeal(rows, row, price, vol, dtime);
      // other entry types (rare partial-netting adjustments) are left out of
      // the entry/exit reconstruction on purpose to keep this exporter simple
     }
   int handle = FileOpen(InpOutputFileName, FILE_WRITE|FILE_TXT|FILE_ANSI);
   if(handle==INVALID_HANDLE)
     {
      PrintFormat("RuinExport: could not create %s, error %d", InpOutputFileName, GetLastError());
      return;
     }
   FileWrite(handle, "OpenTime,CopyTime,Symbol,Type,Volume,OpenPrice,ClosePrice,Profit");
   int n = ArraySize(rows);
   int written = 0;
   int skipped_open = 0;
   for(int i=0; i<n; i++)
     {
      //--- export only FULLY closed positions: close_time must be set, and
      //--- the closed volume must match the opened volume (a partially
      //--- closed position is still open and would contaminate the audit)
      bool fully_closed = (rows[i].close_time>0) && (MathAbs(rows[i].volume-rows[i].close_volume)<0.0000001);
      if(!fully_closed)
        {
         skipped_open++;
         continue;
        }
      int digits = (int)SymbolInfoInteger(rows[i].symbol, SYMBOL_DIGITS);
      if(digits<=0) digits = 5;
      FileWrite(handle,
                TimeToString(rows[i].open_time,  TIME_DATE|TIME_SECONDS),
                TimeToString(rows[i].close_time, TIME_DATE|TIME_SECONDS),
                rows[i].symbol,
                rows[i].is_buy ? "buy" : "sell",
                DoubleToString(rows[i].volume, 2),
                DoubleToString(rows[i].open_price, digits),
                DoubleToString(rows[i].close_price, digits),
                DoubleToString(rows[i].profit, 2));
      written++;
     }
   FileClose(handle);
   PrintFormat("RuinExport: wrote %d closed position(s) to %s (MQL5\\Files); %d still-open/partial position(s) were excluded.",
               written, InpOutputFileName, skipped_open);
   PrintFormat("RuinExport: run RuinAuditor.mq5 with InpCsvFileName=\"%s\" to analyze this file.", InpOutputFileName);
  }
Running RuinExport.mq5 on an account with closed trade history prints the following in the Experts tab:
RuinExport: wrote 87 closed position(s) to RuinAuditorSample.csv (MQL5\Files); 3 still-open/partial position(s) were excluded.
RuinExport: run RuinAuditor.mq5 with InpCsvFileName="RuinAuditorSample.csv" to analyze this file.
Fig. 3. RuinExport.mq5 writes an account's closed positions to a CSV file that RuinAuditor.mq5 can read directly.
Interpreting the Report and a Practical Workflow
Three ways to put a history in front of the tool:
- Your own account. Run RuinExport.mq5, then run RuinAuditor.mq5 with InpCsvFileName set to the file it wrote.
- A signal you are considering. Most signal providers publish a trading history table. Copy the open time, close time, symbol, direction, volume, open price, close price, and profit of each row into a CSV with the header this tool expects.
- No file at all. Run RuinAuditor.mq5 as-is to see the built-in demonstration book and confirm the report reads the way this article describes before pointing it at real data.
A grade is a starting point for judgment, not a verdict. An A or B with no dimension near the attention threshold means the screen found none of the four fingerprints, worth knowing, but not a guarantee that none exist outside what these four checks look for. A C is worth a closer manual read of the trade log. A D or F, especially when the grid or escalation dimension is the main driver rather than the classical ruin dimension, is a concrete, specific reason to ask the provider directly how position size is chosen and whether positions are ever averaged, before risking money on the answer.
Applicability and Limitations
The default InpMinPositions of 30 is a floor, not a target: every dimension here is a sample statistic, and all four are noisier and less trustworthy the smaller the book. A dozen closed positions can trip the escalation or grid dimension coincidentally; treat a report on a small sample as a reason to gather more history before acting on it, not as a final answer. The tool prints an explicit warning when the sample is below the threshold and continues anyway, since even a small sample can be informative once the reader knows to discount it.
Every score here is a heuristic screen, not a proof. A legitimate strategy that scales into strength, or that occasionally sizes up on a high-conviction setup, can trigger the escalation or grid dimension without being a martingale at all. A young track record with no losing trades yet is flagged as high-attention for the same reason: the tool cannot distinguish "safe" from "has not lost yet." None of the four dimensions models the correlation between symbols, margin calls, broker-specific execution, or the possibility that a provider changes strategy after the sample ends. This tool complements walk-forward testing, Monte Carlo resampling of the same trade sequence, and ordinary due diligence. It does not replace any of them, and a clean grade is not investment advice.
Future Work
Three extensions follow naturally from the same architecture. First, magic-number-aware aggregation would let the tool separate several Expert Advisors sharing one account into independent books before scoring each one, rather than scoring the account as a single blended sequence. Second, an OnTester wrapper would expose the safety score as a custom optimization criterion so a parameter search can be steered away from configurations that pass a profit target only by way of a fragile, high-risk-of-ruin trade sequence. Third, the grid dimension currently looks at one symbol at a time; extending the overlap check to correlated symbol groups (for example, the EUR and GBP majors together) would catch a cross-symbol averaging pattern that the current single-symbol grouping cannot see.
Conclusion
A win rate and an equity curve describe what a trading history produced, not how close it came to producing something very different. The Hidden Risk-of-Ruin Auditor reads the same closed-position history everyone already has access to, whether from their own account or a signal's public statistics, and turns four specific, well-defined structural questions about size, overlap, payoff shape, and classical ruin mathematics into one configurable grade. None of the four dimensions requires anything beyond native MQL5, and every threshold used to compute them is an input, not a hidden constant.
The source code is available in the MQL5 CodeBase: Hidden Risk-of-Ruin Auditor in the MQL5 CodeBase.
The following table describes the source files that accompany the article.
| File Name | Description |
|---|---|
| RuinAuditor.mq5 | The main script. It loads a closed-position CSV (or generates a reproducible demo book), runs the four scoring dimensions, and prints the Hidden Risk-of-Ruin report. |
| RuinExport.mq5 | The helper script. It reconstructs closed positions from the current account's deal history and writes them to a CSV file in the format RuinAuditor.mq5 expects. |
| MQL5.zip | An archive whose root is the MQL5 folder, so it unpacks directly into the terminal data folder with every file in its correct place. The two scripts sit in MQL5\Scripts\RuinAuditor\, ready to compile without moving anything. |
- MQL5 Documentation: Files;
- MQL5 Documentation: Trade Functions;
- Vince, R., "Portfolio Management Formulas: Mathematical Trading Methods for the Futures, Options, and Stock Markets," 1990 (origin of the risk-of-ruin approximation used in Dimension 4).
- Hidden Risk-of-Ruin Auditor source code, MQL5 CodeBase: Hidden Risk-of-Ruin Auditor in the MQL5 CodeBase.
Warning: All rights to these materials are reserved by MetaQuotes Ltd. Copying or reprinting of these materials in whole or in part is prohibited.
This article was written by a user of the site and reflects their personal views. MetaQuotes Ltd is not responsible for the accuracy of the information presented, nor for any consequences resulting from the use of the solutions, strategies or recommendations described.

 Developing Smart Chart Objects in MQL5 (Part 1): Building a Stateful Trendline Management Framework
 Institutional-Grade Multi-Currency Portfolio Engine in MQL5 (Part 1): Architecture of a Multi-Currency EA Framework
 How To Debug MQL5 Code in MetaEditor
 Beyond the Mean and Standard Deviation: A Robust Statistics Library for MQL5 Indicators

- Free trading apps
- Over 8,000 signals for copying
- Economic news for exploring financial markets
You agree to website policy and terms of use