

How To Profile MQL5 Code in MetaEditor
 1 726
1 726
 0
0

Introduction
Most performance problems in MQL5 code stay invisible until they cause a measurable slowdown. An indicator that draws fine on a chart of a few thousand bars can crawl when it is loaded across dozens of symbols, or drag an Expert Advisor to a standstill during an optimization pass that calls its logic millions of times. By then the cost is real, but the cause is buried somewhere in code that looked perfectly reasonable when you wrote it. The hard part is rarely fixing the slow code. The hard part is finding it, because a function that feels fast and a function that is fast are not the same thing, and the eye cannot tell them apart.
Guessing the culprit wastes developer time. You rewrite the loop you suspect, and it changes nothing, because the real cost was in a helper you never thought about. The only reliable way to know where a program spends its time is to measure it, and MetaEditor already includes the tool for exactly that: a built-in profiler that watches your code run and reports line by line where the work actually happens. It needs no external libraries and no timing code of your own.
This article is a practical walk-through of the profiler. To keep the focus on the tool, I use a small, familiar indicator as the patient: a rolling z-score with bands. I write it the obvious way first, then put it under the profiler three times, fixing whatever each report points at. By the end the same indicator produces the same output for a fraction of the work.
The goal is not this indicator but the profiling workflow: launching the profiler, interpreting its two key metrics per function, using the heat map to find the exact line, and knowing when to stop. Once you can read a profile, you can point the tool at your own indicators, libraries, and EAs.
What the profiler measures, and the two columns that matter
The MetaEditor profiler is a sampling profiler. While your program runs, it interrupts execution many times a second and records which line of which function was executing at that instant. It does not time each function with a stopwatch; it counts how often each line is caught in the act. The numbers you see are sample counts, not microseconds, which matters later when the counts get small.
Be clear about what sampling does and does not show, because it is easy to misread. The profiler measures relative cost, not absolute time: a line credited with 60% of the samples is where roughly 60% of the work happens, but the report will not tell you whether that work took two milliseconds or two hundred. Sampling is also statistical. Catching a line a few thousand times paints a sharp picture; catching it a handful of times does not. So trust the big shares, treat the small ones as approximate, and never read a difference of a few samples as meaningful. That rule decides how I read the very last profile in this article, where the totals have shrunk into the dozens.
You launch it from the Debug menu, which offers two profiling commands.
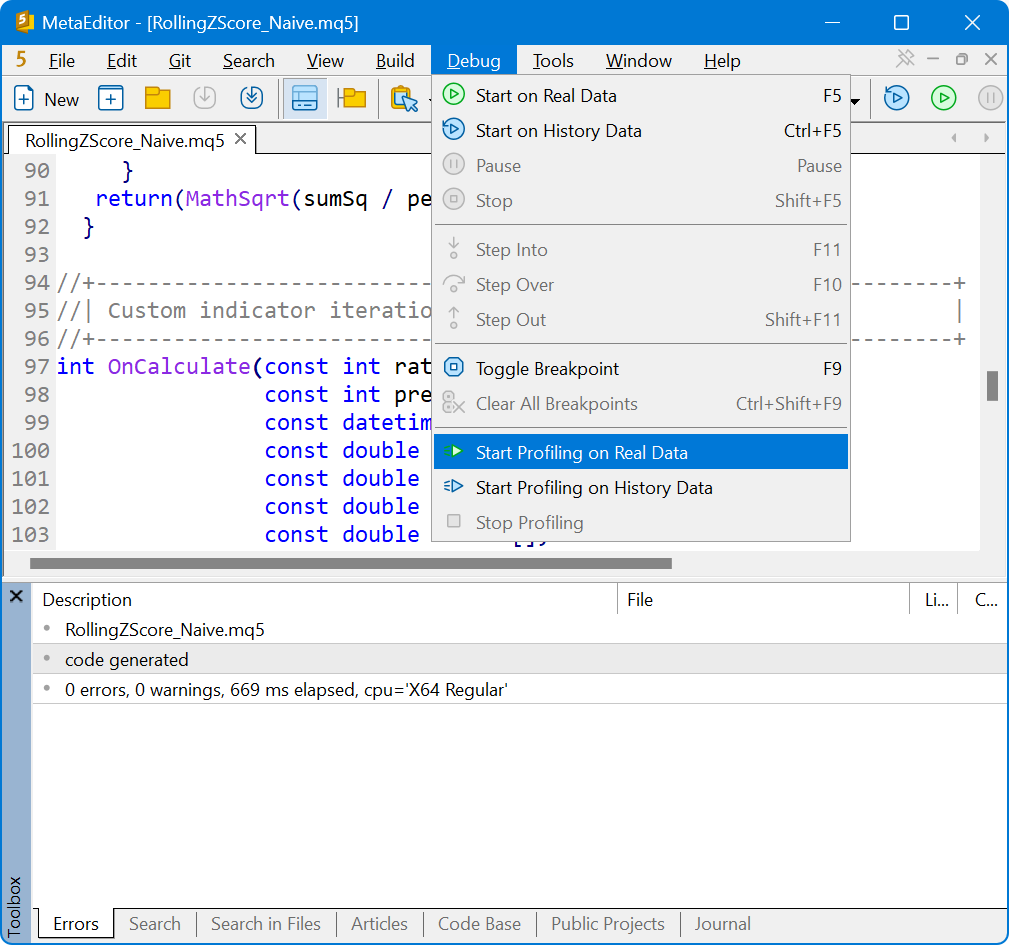
Fig. 1. Launching the profiler from the Debug menu
The two commands are Start profiling on real data, which runs the program on a live-updating chart so you can watch it under real conditions, and Start profiling on history data, which runs it in the Strategy Tester in visual mode without waiting on a trade server. For this indicator I used real data. It calculates all existing bars on load and then updates as ticks arrive, as in normal use. When the indicator launches under the profiler, MetaTrader 5 marks it as such in the chart's indicator list.
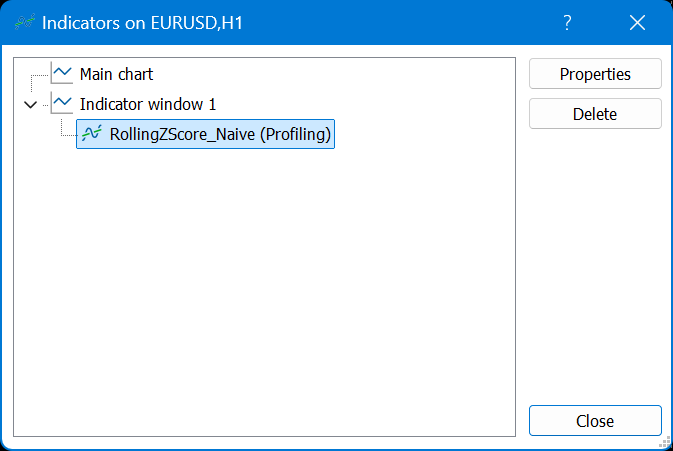
Fig. 2. The chart's indicator list confirms profiling is active
When the run is stopped, the report gives every function and every line two numbers, and the whole skill of reading a profile is understanding the difference between them. The documentation defines them precisely:
- "Total CPU - how many times the function appeared in the call stack."
- "Self CPU - the number of 'pauses' which occurred directly within the specified function. This variable is crucial in identifying bottlenecks: according to statistics, pauses occur more often where more processor time is required."
Put plainly: Self CPU is the time spent on the function's own lines, not counting anything it calls. Total CPU includes the time spent inside everything the function calls, all the way down. The distinction is the single most useful idea in profiling. A function can sit at the top of the report with a huge Total CPU and yet be completely innocent, because all that time is really being spent in some helper it calls. When that happens, optimizing the busy-looking function does nothing; the cost is one level down. I will hit exactly that situation in the first run, so keep the two definitions in mind.
The indicator: a rolling z-score, written the obvious way
The indicator computes a z-score: for each bar it takes the closing price, subtracts the mean of the last N closes, and divides by their standard deviation. The result says how many standard deviations the current close sits away from its recent average, and two flat lines mark a chosen threshold so extremes are easy to spot. The math is textbook, which is the point. I want a calculation everyone recognizes so the focus stays on the cost, not the cleverness.
Here is the logic in plain language before any code:
- For each bar, look back over a window of N closing prices ending at that bar.
- Compute the mean of that window.
- Compute the standard deviation of that window.
- The z-score is (current close minus mean) divided by standard deviation.
- Bars before the first full window have no value; leave them blank.
I started with two small helper functions, one for the mean and one for the standard deviation, because that is how the definition reads. Each takes the price array, the bar position, and the window length, and walks the window.
//+------------------------------------------------------------------+
//| Compute the mean of a window ending at bar `pos`                 |
//| (re-reads the whole window every time it is called)              |
//+------------------------------------------------------------------+
double WindowMean(const double &price[], const int pos, const int period)
  {
   double sum = 0.0;
   for(int k = 0; k < period; k++)
      sum += price[pos - k];
   return(sum / period);
  }

//+------------------------------------------------------------------+
//| Compute the standard deviation of a window ending at bar `pos`   |
//| (re-reads the whole window AGAIN, after WindowMean already did)  |
//+------------------------------------------------------------------+
double WindowStdDev(const double &price[], const int pos, const int period, const double mean)
  {
   double sumSq = 0.0;
   for(int k = 0; k < period; k++)
     {
      double diff = price[pos - k] - mean;
      sumSq += diff * diff;
     }
   return(MathSqrt(sumSq / period));
  }
Listing 1. The two window helpers
Notice the comments are honest about what these do: each one walks the entire window from scratch every time it is called. That felt fine when I wrote it, because each call is a short loop and the loop is correct. The cost only shows up when you count how many times that short loop runs.
The calculation handler ties them together. It does three things I will keep flagging as I go, because each one becomes a profiler target: it copies the price series into a local array, it recomputes every bar from scratch on every call, and per bar it calls both helpers so the window is walked twice.
//+------------------------------------------------------------------+
//| Custom indicator iteration function                              |
//+------------------------------------------------------------------+
int OnCalculate(const int rates_total,
                const int prev_calculated,
                const datetime &time[],
                const double &open[],
                const double &high[],
                const double &low[],
                const double &close[],
                const long &tick_volume[],
                const long &volume[],
                const int &spread[])
  {
   if(rates_total < InpPeriod)
      return(0);

//--- Copy the close series into a local working buffer.
   double price[];
   ArrayResize(price, rates_total);
   for(int i = 0; i < rates_total; i++)
      price[i] = close[i];

//--- Recompute every bar on every call (prev_calculated is not used).
   for(int i = 0; i < rates_total; i++)
     {
      if(i < InpPeriod - 1)
        {
         ZScoreBuffer[i] = 0.0;
         UpperBuffer[i]  = 0.0;
         LowerBuffer[i]  = 0.0;
         continue;
        }

      //--- Two passes over the window: one for the mean, one for the
      //--- standard deviation. Each helper rescans the full window.
      double mean   = WindowMean(price, i, InpPeriod);
      double stddev = WindowStdDev(price, i, InpPeriod, mean);

      double z = 0.0;
      if(stddev > 0.0)
         z = (price[i] - mean) / stddev;

      ZScoreBuffer[i] = z;
      UpperBuffer[i]  = InpThreshold;
      LowerBuffer[i]  = -InpThreshold;
     }

   return(rates_total);
  }
Listing 2. The naive OnCalculate
Read that outer loop with the window length in mind. At the default period of 100, each bar past the warm-up costs roughly 200 array reads, and the handler repeats that for every bar on the chart on every call. The work scales as bars times window length, so a chart with thousands of bars means millions of reads to draw a line that appears instantly.
Plotted in a subwindow, it looks like any other oscillator: the z-score line crosses zero as price moves through its rolling average and pushes toward the dotted threshold lines when a move stretches away from it.
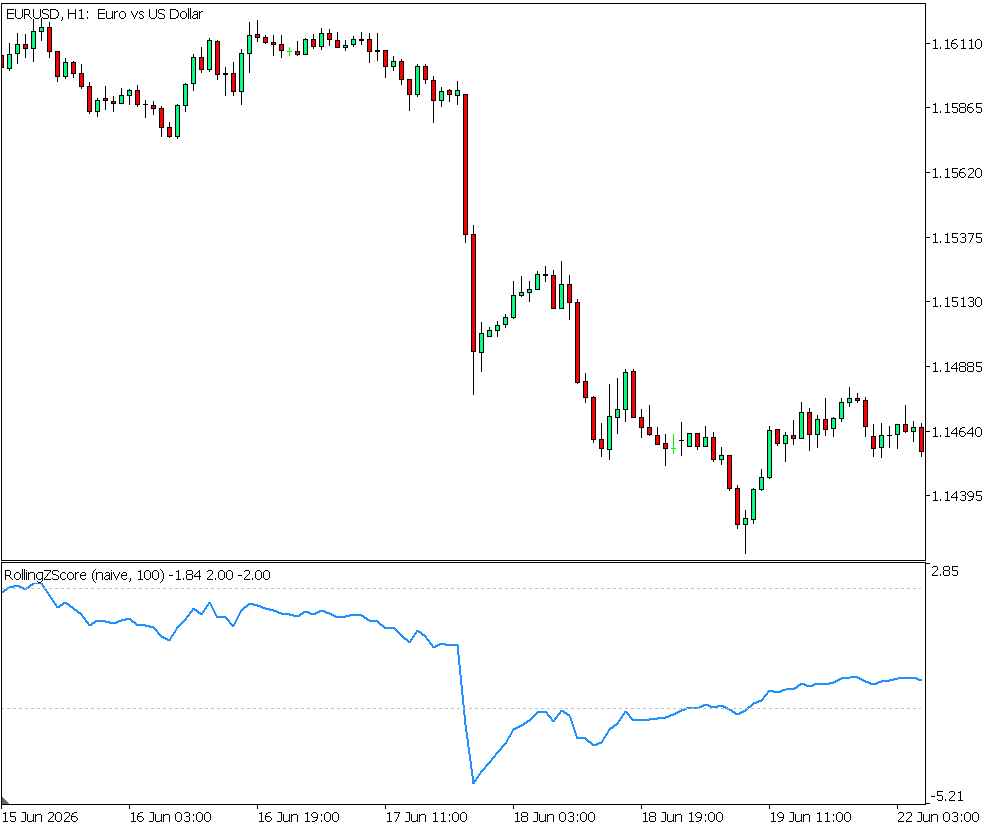
Fig. 3. The rolling z-score on EURUSD H1, with the threshold bands
It compiles, it is correct, and it looks reasonable. Whether that hidden multiplication actually matters is not something to argue about, so I profiled it.
First profiling run: reading the report
I compiled the indicator and started the profiler on real data, against a chart with a long history so the calculation had plenty of bars to chew through. After letting it run, I stopped profiling, and MetaEditor opened the report with every function and line ranked by cost.
The function list told the whole story at a glance. WindowMean and WindowStdDev sat at the top with almost identical Self CPU shares of about 49% and 48%, roughly 97% of everything the indicator did between them. The two innocent-looking helpers were the entire cost of the program.
The profiler also shades the source itself, line by line, from pale to deep red according to cost, with the sample counts printed right on the line. The heat map points at the exact statements doing the damage: inside WindowMean the sum += price[pos - k] line is the hottest thing in the function, and inside WindowStdDev it is the equivalent accumulation step.
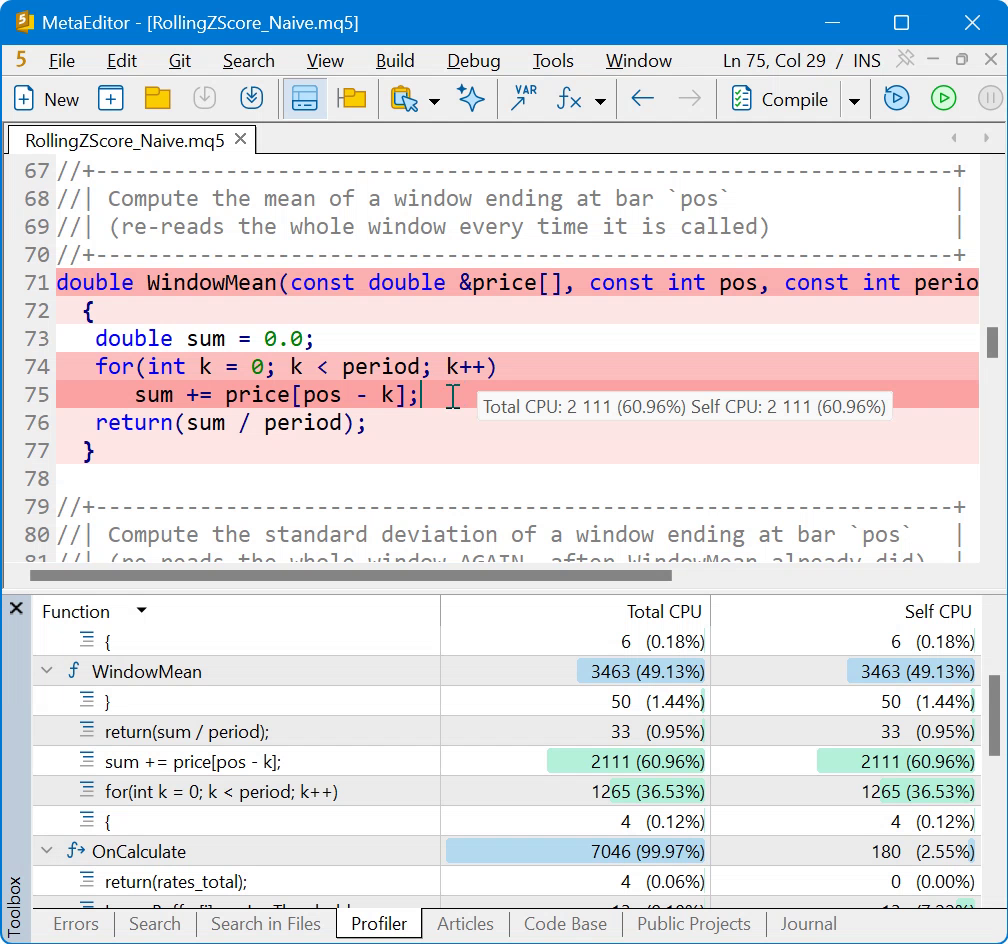
Fig. 4. The heat map inside WindowMean
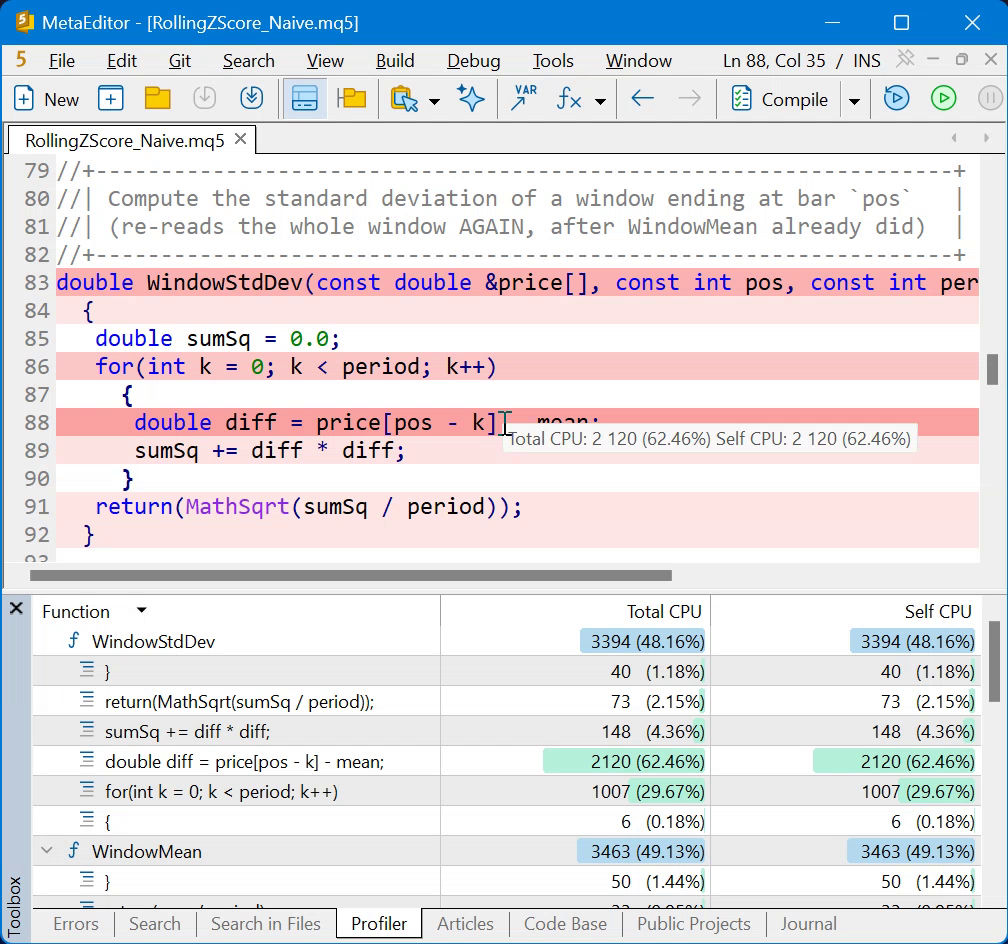
Fig. 5. The heat map inside WindowStdDev
This is where the two columns earn their keep. Look at the row for OnCalculate in the same report: its Total CPU is essentially 100%, yet its Self CPU is only about 2.5%. By the definitions from earlier, that pairing has an exact meaning. Almost all the program's time flows through OnCalculate, because it is the function that runs everything, but almost none of it is spent in OnCalculate itself. The handler is innocent. If I had trusted the Total column alone and started rewriting the loop in OnCalculate, I would have spent effort on the 2.5% and left the 97% untouched.
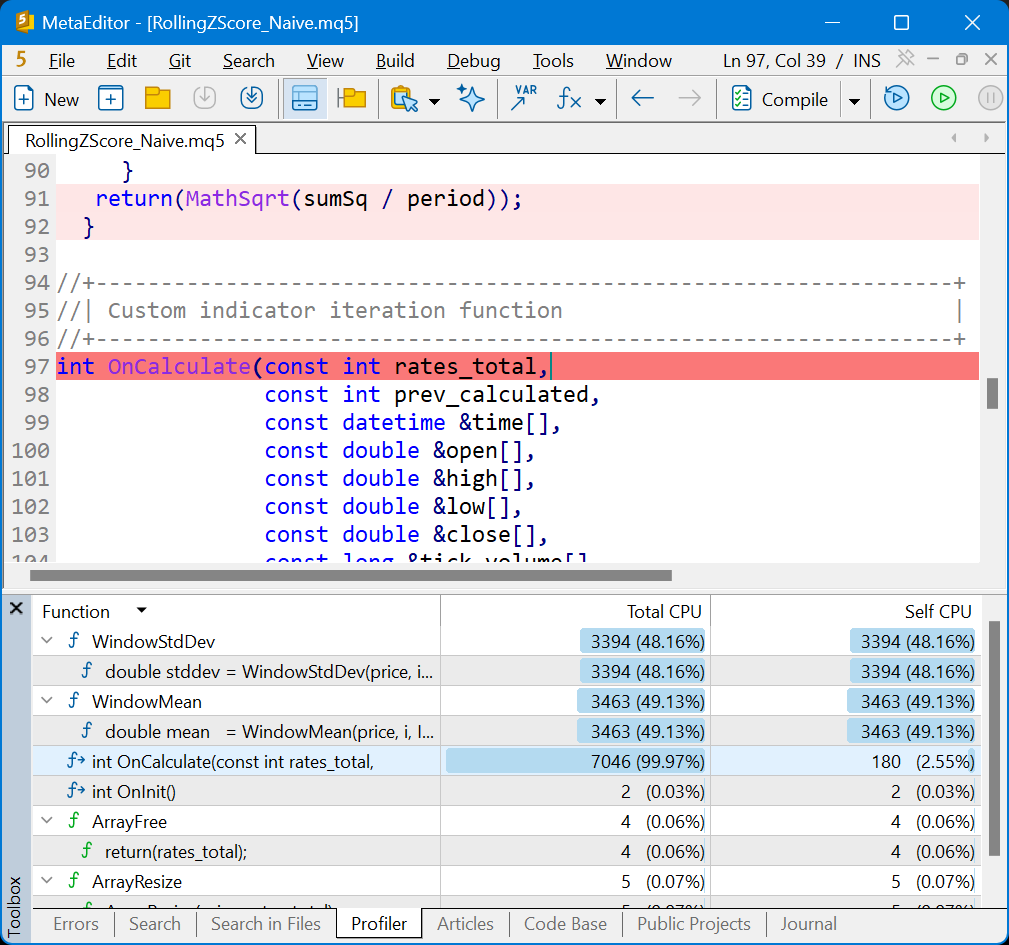
Fig. 6. The call tree: OnCalculate's time drains into the two helpers it calls
The diagnosis agrees with the back-of-the-envelope count from the last section, and it tells me precisely what to change: not the handler, not the copy, not the buffers, but the rescanning of the window itself.
Fix 1: stop rescanning the window
The waste is structural. The mean for bar 501 sums a hundred values, ninety-nine of which I just summed for bar 500. So carry a running sum and a running sum of squares and slide them: add the value that entered the window, subtract the value that left. Each bar becomes constant work regardless of window size. The mean is the running sum over N, the variance is the running sum of squares over N minus the mean squared, and both helper functions fold into the loop and disappear.
I kept the array copy and the full recompute in this version on purpose, so the measurement isolates the algorithmic change and nothing else. Here is the part that changed, seeding the accumulators once over the first window and then sliding them; the copy, the warm-up blanking and the buffer writes are exactly as they were in Listing 2:
//--- Seed the running accumulators with the first full window
//--- (the window that ends at bar InpPeriod-1).
   double sum   = 0.0;   // running sum of the window
   double sumSq = 0.0;   // running sum of squares of the window
   for(int k = 0; k < InpPeriod; k++)
     {
      double v = price[k];
      sum   += v;
      sumSq += v * v;
     }
//--- ... outer bar loop and warm-up blanking unchanged from Listing 2 ...
      //--- For i == InpPeriod-1 the accumulators are already seeded.
      //--- For every bar after that, slide the window forward by one:
      //--- add the new bar (i) and drop the bar that left (i-InpPeriod).
      if(i >= InpPeriod)
        {
         double vIn  = price[i];
         double vOut = price[i - InpPeriod];
         sum   += vIn - vOut;
         sumSq += vIn * vIn - vOut * vOut;
        }

      //--- Mean and variance straight from the running accumulators.
      //--- variance = E[x^2] - (E[x])^2
      double mean     = sum / InpPeriod;
      double variance = sumSq / InpPeriod - mean * mean;
      if(variance < 0.0)        // guard tiny negative from FP rounding
         variance = 0.0;
      double stddev   = MathSqrt(variance);
//--- ... z-score and buffer writes unchanged from Listing 2 ...
Listing 3. Sliding accumulators replace the window walk (excerpt)
One detail is a real change, not just a faster spelling of the same thing. The naive standard deviation summed squared differences from the mean, a two-pass formula; this version uses the mean of the squares minus the square of the mean, a one-pass formula. They are algebraically identical but not bit-for-bit identical in floating point, and the one-pass form can produce a tiny negative variance from rounding, which is what the guard clamps.
Then I profiled it the same way, on the same chart and timeframe, so the comparison would be fair. The result was decisive: WindowMean and WindowStdDev are gone from the report, because they no longer exist, and the total sample count for the whole indicator collapsed from roughly 7,050 down to 95. That is about a seventy-fold reduction in measured work, from a change to one idea.
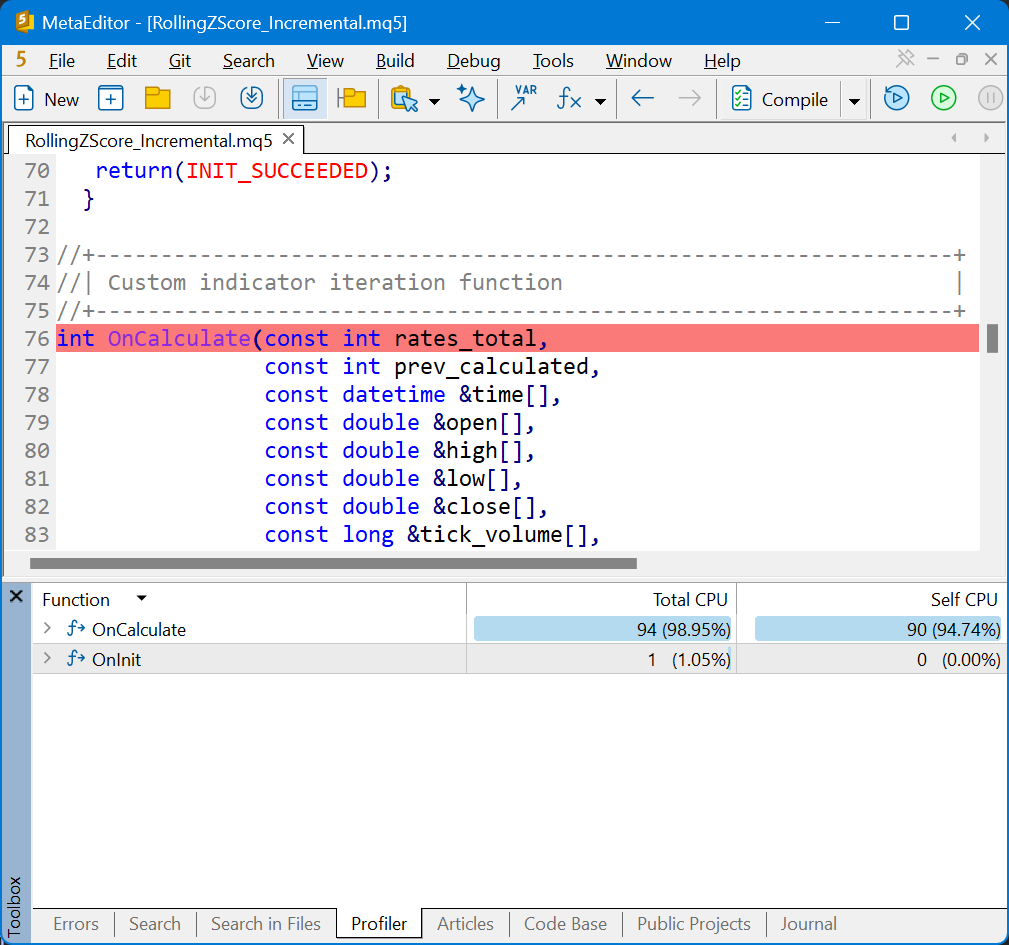
Fig. 7. After Fix 1: the helpers are gone and the totals are a fraction of before
The shape of the report inverted, too. With no called helpers left to absorb the time, OnCalculate's Self CPU jumped to about 95%, because the work finally lives in the function itself rather than in something it calls. The heat map now shades a different set of lines, and two of them are interesting: the division that produces the z-score, and the line that copies close into the local price array. The copy I kept on purpose has risen to near the top, because everything that used to dwarf it is gone, which you can see shaded on the price[i] = close[i] line below.
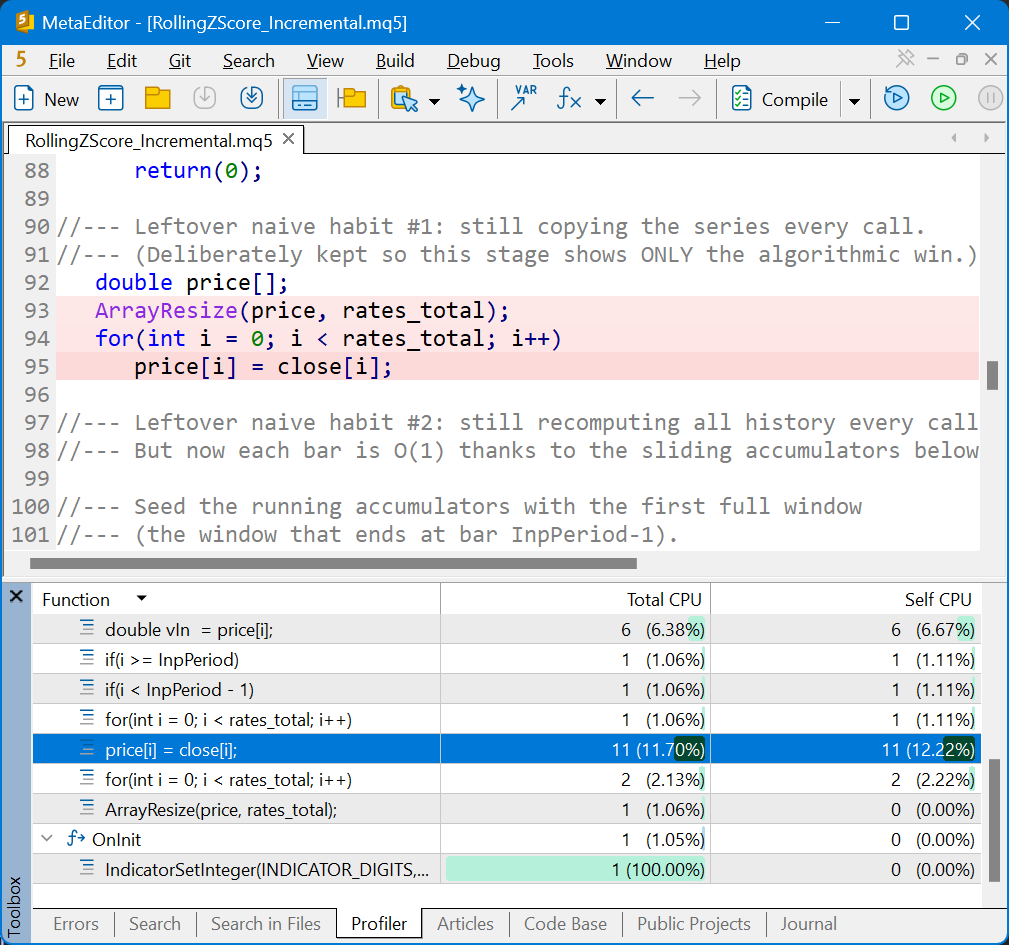
Fig. 8. The leftover copy is now one of the hottest lines
The profiler has already named my next target.
Fix 2: drop the copy and honor prev_calculated
Two leftover habits remain, and the second profile put both of them in view. The first is the local copy: every call resizes a price array to the full bar count and copies close into it, just so the rest of the code has an array to index. There was never a reason for it; close is already an indexable array passed straight into the handler. Removing the copy removes the resize, the copy loop, and the allocation behind them in one stroke.
The second habit is the bigger structural waste, and it is the one most custom indicators get wrong. The handler recomputes every bar from the beginning on every call. But after the first run, the only thing that changes from one tick to the next is the most recent bar, and occasionally a new bar appended to the end. Recomputing all of history to update one or two bars is pure waste, and MQL5 hands you the parameter to avoid it. The documentation describes prev_calculated directly:
"Contains the value returned by the OnCalculate() function during the previous call. It is designed to skip the bars that have not changed since the previous launch of this function."
To honor it, the accumulators can no longer be local variables that vanish at the end of each call. They have to persist between calls, holding the state of the window as it stood at the last computed bar, so the next call can resume instead of restarting. I moved them to global scope and added an index that records the last bar I finished.
//--- Persistent sliding accumulators (state kept BETWEEN calls).
//--- They describe the window that ends at bar g_lastComputed.
double g_sum         = 0.0;   // running sum of the current window
double g_sumSq       = 0.0;   // running sum of squares of the current window
int    g_lastComputed = -1;   // index of the last bar whose window we summed
Listing 4. Accumulators promoted to persistent state
The per-bar math is unchanged, so I lifted it into a small EmitBar function that reads the current accumulators and writes the three buffers for one bar. That keeps the handler readable once the resume logic is added around it.
//+------------------------------------------------------------------+
//| Compute the output for bar `i`, given current accumulators       |
//+------------------------------------------------------------------+
void EmitBar(const int i, const double price_i)
  {
   double mean     = g_sum / InpPeriod;
   double variance = g_sumSq / InpPeriod - mean * mean;
   if(variance < 0.0)            // guard tiny negative from FP rounding
      variance = 0.0;
   double stddev = MathSqrt(variance);

   double z = 0.0;
   if(stddev > 0.0)
      z = (price_i - mean) / stddev;

   ZScoreBuffer[i] = z;
   UpperBuffer[i]  = InpThreshold;
   LowerBuffer[i]  = -InpThreshold;
  }
Listing 5. The per-bar math, factored out
The handler now has two paths. On the first call, or after the terminal rebuilds history and hands back a prev_calculated of zero, it seeds from scratch exactly as before. On every later call it resumes from the last computed bar and rolls the accumulators forward only over the bars that are genuinely new.
One subtlety is easy to get wrong. The most recent bar is still forming, so the value computed for it on the previous tick is provisional. Picture the chart sitting on bar 1000 with several ticks arriving before it closes: the first tick slides the window to include bar 1000 and emits a z-score, then the next tick changes that bar's close. The accumulators have already absorbed the old value, so simply adding the new close would count the bar twice and corrupt every value after it.
Sliding a window is stateful, not idempotent. Each forward step bakes one specific close into g_sum and g_sumSq, so re-running the step with a different value stacks a second contribution on top of the first instead of replacing it. The fix is to rewind: step the index back, reverse the exact slide that pulled bar 1000 in, then roll forward again with the corrected close. The resume branch does that rewind before the forward loop runs, and getting it right is the difference between an indicator that stays correct as it ticks and one that slowly drifts.
//--- Decide where to start. On the first call (prev_calculated == 0)
//--- or after a history rebuild, we (re)seed from scratch. Otherwise
//--- we resume from the last fully-computed bar, recomputing only the
//--- few bars that are genuinely new since the previous call.
   int start;

   if(prev_calculated == 0 || g_lastComputed < InpPeriod - 1)
     {
      //--- Fresh start: blank the warm-up region and seed the first window.
      for(int i = 0; i < InpPeriod - 1 && i < rates_total; i++)
        {
         ZScoreBuffer[i] = 0.0;
         UpperBuffer[i]  = 0.0;
         LowerBuffer[i]  = 0.0;
        }

      g_sum   = 0.0;
      g_sumSq = 0.0;
      for(int k = 0; k < InpPeriod; k++)
        {
         double v = close[k];
         g_sum   += v;
         g_sumSq += v * v;
        }

      //--- first emittable bar is the end of that first window
      g_lastComputed = InpPeriod - 1;
      EmitBar(g_lastComputed, close[g_lastComputed]);

      start = g_lastComputed + 1;
     }
   else
     {
      //--- Resume. The last bar of the previous call may still be forming,
      //--- so step the window back one and recompute from there. This keeps
      //--- the in-progress bar correct as new ticks arrive.
      start = g_lastComputed;

      //--- roll the accumulators BACK to the window ending at start-1,
      //--- so the loop below can roll them forward consistently.
      if(start >= InpPeriod)
        {
         double vIn  = close[start];              // was added last time
         double vOut = close[start - InpPeriod];  // was dropped last time
         g_sum   -= vIn - vOut;
         g_sumSq -= vIn * vIn - vOut * vOut;
        }
     }

//--- Roll forward over the new (or re-forming) bars only.
   for(int i = start; i < rates_total; i++)
     {
      if(i >= InpPeriod)
        {
         double vIn  = close[i];
         double vOut = close[i - InpPeriod];
         g_sum   += vIn - vOut;
         g_sumSq += vIn * vIn - vOut * vOut;
        }
      EmitBar(i, close[i]);
      g_lastComputed = i;
     }

   return(rates_total);
Listing 6. The resume logic that honors prev_calculated
Profiling this version showed the copy gone for good, with no array resize or free anywhere in the report, and the total sample count down again to 59. Everything that remains sits inside EmitBar, which holds about 83% of the now-tiny total: one division, one square root, and the three buffer writes. There is no wasted motion left for the profiler to point at.
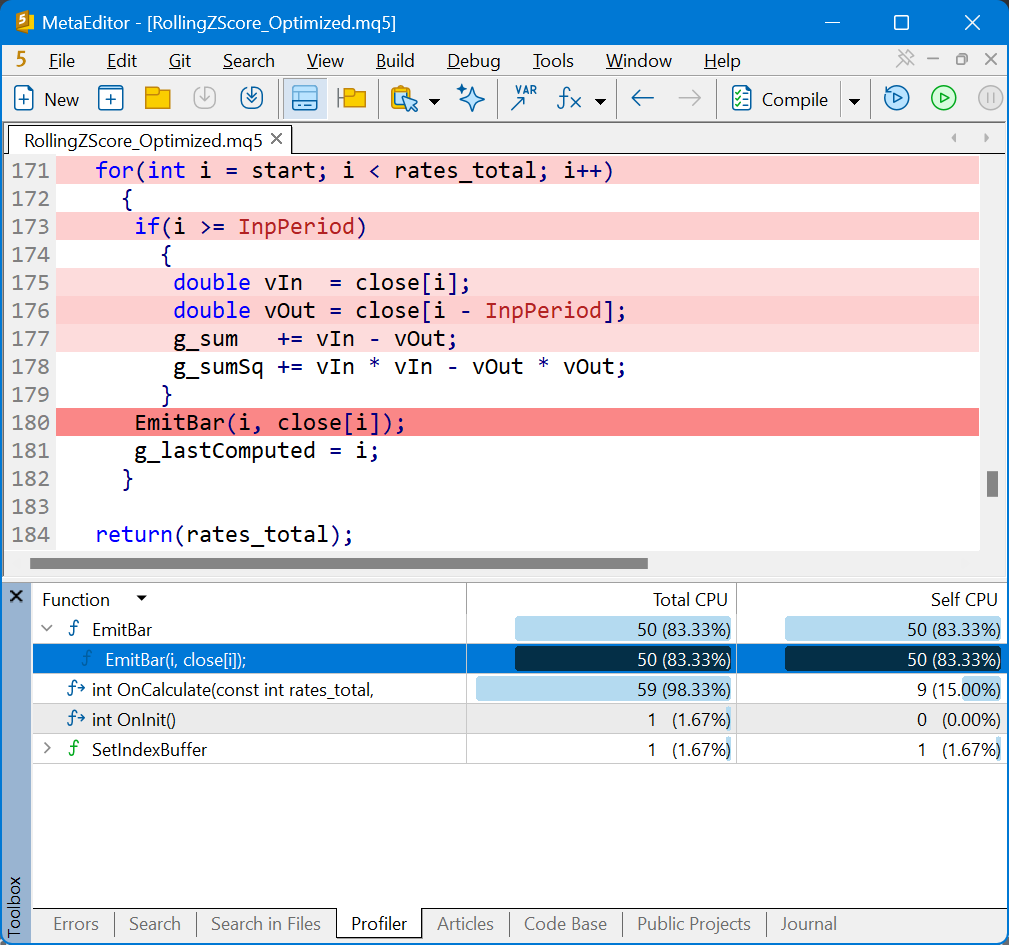
Fig. 9. After Fix 2: only EmitBar's core arithmetic remains
One honest qualification belongs here. When the indicator attaches it still computes every bar once, through the fresh-seed path, and that initial pass is where most of these samples come from. The prev_calculated saving does not show up in that first calculation; it pays out afterwards, on every tick that follows, when the handler touches only the one or two bars that actually changed. The copy removal is what the profile shows directly; the prev_calculated win is what you reason about.
The whole journey in one table, and when to stop
Laid side by side, the three runs trace a clean descent. The same indicator, drawing the same line, went from roughly 7,050 samples of measured work to 59.
| Stage | Total CPU samples | Where the time went | What changed |
|---|---|---|---|
| Naive | ~7,050 | WindowMean 49%, WindowStdDev 48% | The starting point |
| Incremental | 95 | division and the leftover copy | Sliding accumulators, O(N) per call |
| Optimized | 59 | EmitBar 83% (irreducible math) | No copy, honors prev_calculated |
Table 1. CPU samples per stage
Two things in that table deserve a closer look. The first is that the giant win was the first one: sliding accumulators took the count from about 7,050 to 95, while the second fix trimmed it from 95 to 59. That ordering is typical, with the algorithm dominating and the housekeeping a smaller correction on top.
The second is that 95 and 59 are small enough that the exact figures mean little. Read the table by the collapse in magnitude, from thousands to dozens, not by treating 59 as meaningfully different from, say, 65.
Which is exactly the signal to stop. When the profiler shows nothing but the arithmetic your formula actually requires, and the totals are down in the noise, there is no longer a hotspot to chase. Optimizing further would mean shaving the divide or the square root for fractions of a percent that no chart and no tester run will ever feel. The discipline the profiler teaches is not only where to optimize but when to quit.
Final Thoughts
The z-score example shows the value of measurement over intuition. Every optimization here was driven by evidence rather than guesswork: the profiler first exposed the redundant window rescans, which sliding accumulators eliminated, then revealed that what remained was an unnecessary array copy and a full recomputation of history, which led to a version that honors prev_calculated and preserves state between calls. By the final profile, nothing was left but the arithmetic the indicator genuinely had to perform.
The workflow applies far beyond this example. Whether you are profiling an indicator, an Expert Advisor, or a reusable library, the process is the same:
- Run the profiler on real or historical data.
- Start with Self CPU to find where a function spends its own time, and use Total CPU to trace expensive calls.
- Follow the heat map to the exact line responsible for the cost.
- Fix the algorithm before the housekeeping: remove repeated work first, then eliminate unnecessary copies, allocations, and full recomputations.
- Profile again, and stop when the report shows only the work your algorithm fundamentally requires.
Two practical caveats are worth remembering. A sampling profiler measures relative cost, not absolute execution time, and its results become increasingly noisy once the total sample count falls into the dozens, so trust large differences and treat small ones as statistical variation. Optimization also carries trade-offs of its own: the one-pass variance used here is much faster but slightly less numerically stable than the classic two-pass formulation, so choose the approach that fits your problem rather than assuming the fastest implementation is always the best one.
The same reasoning carries directly into larger projects. Indicators that repeatedly rescan windows, EAs that perform expensive work on every tick, and libraries that recompute values instead of caching them all produce the same profiler signatures. Once you learn to read those signatures, optimization becomes a methodical engineering process instead of trial and error.
I attached all three versions of the indicator so you can profile them yourself and watch the reports evolve from one optimization to the next. More importantly, point the profiler at your own projects. You may discover that code you were certain was fast enough has quietly been doing orders of magnitude more work than it ever needed to.
| # | File | Description |
|---|---|---|
| 1 | RollingZScore_Naive.mq5 | The first, intuitive version: two window helpers walked twice per bar. |
| 2 | RollingZScore_Incremental.mq5 | Fix 1: sliding sum and sum-of-squares accumulators, O(N) per call. |
| 3 | RollingZScore_Optimized.mq5 | Fix 2: no array copy, persistent accumulators, honors prev_calculated. |
| 4 | MQL5.zip | Archive containing all three indicators above. |
Warning: All rights to these materials are reserved by MetaQuotes Ltd. Copying or reprinting of these materials in whole or in part is prohibited.
This article was written by a user of the site and reflects their personal views. MetaQuotes Ltd is not responsible for the accuracy of the information presented, nor for any consequences resulting from the use of the solutions, strategies or recommendations described.

 Online Linear Regression with Recursive Least Squares in MQL5: A Parameter-Free Adaptive Trend Estimator
 Creating a Profit Concentration Analyzer in MQL5
 Dingo Optimization Algorithm (DOA)
 Building a Hierarchical Market Structure Framework (Prototype) in MQL5 Using Modular Architecture and Event-Driven Design

- Free trading apps
- Over 8,000 signals for copying
- Economic news for exploring financial markets
You agree to website policy and terms of use